* To whom correspondence should be addressed.
E-mail: [email protected] 청정에너지기술
양식 다시마의 수심과 부위에 따른 화학적 성분 특성
신태선*, 정 설, 도예원, 전상일, 우희철†, 김남길‡
전남대학교 식품공학영양학부 550-749 전남여수시 대학로 50
†부경대학교 화학공학과 608-739 부산광역시 남구 신선로 365
‡경상대학교 해양생명과학 650-160 경남 통영시 인평동 445
(2011년 11월 24일 접수; 2011년 12월 19일 수정본 접수; 2011년 12월 19일 채택)
Chemical Properties of Sea Tangle (Saccharina. japonica) Cultured in the Different Depths of Seawater
Tai Sun Shin*, Zheng Xue, Ye Won Do, Sang Il Jeong, Hee Chul Woo†, and Nam Gil Kim‡ Division of Food Technology and Nutrition, Chonnam National University
50 Daehak-ro, Yeosu, Jeonnam, 550-749, Korea
†Department of Chemical Engineering, Pukyong National University 365 Sinseon-ro, Yongdang-dong, Nam-gu, Busan, 608-739, Korea
‡Department Marine Biology and Aquaculture, Gyeongsang National University 445 Inpyeong-dong, Tongyeong-si, Gyeongsangnam, 650-160, Korea
(Received for review November 24, 2011; Revision received December 19, 2011; Accepted December 19, 2011)
요 약
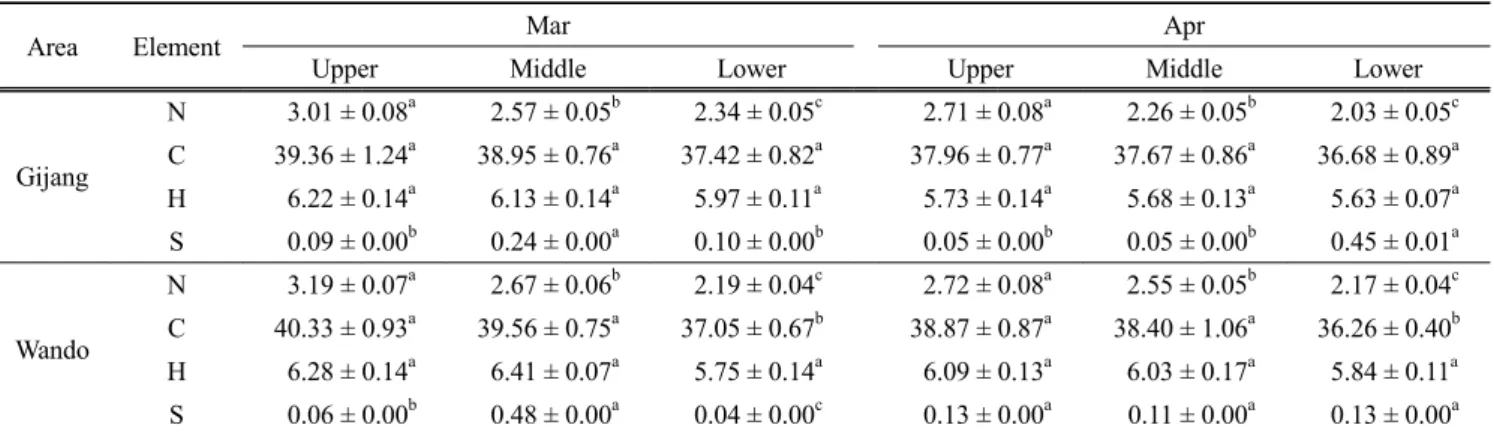
바이오에너지 생산을 위해 해조류 바이오매스의 대량생산 기술을 개발하기 위한 일환으로 다시마에 대한 고밀도 양식의 가 능성을 시험하였다. 기장과 완도 해역양식장에서 수심을 달리하여(0.5 m, 3 m) 다시마를 양식하고 다시마의 주요 부위별 화 학적 성분을 분석하여 비교하였다. 다시마의 상측 부위가 하측 부위보다 많은 조단백질 함량을 나타냈으며, 조지방은 중간 부위에 많이 함유하고 있었다(p<0.05). 조회분은 하측부위에 많은 함량을 나타내었지만 지역 간, 계절 간의 함량 차이는 보 이지 않았다(p>0.05). 또한 대조구(0.5 m)와 수심 3 m의 다시마 간에 일반성분 조성의 차가 없었다. 구성당의 함량은 실험군 에서 부위별 함량 차이는 있었으나, 부위에 따른 증감의 경향은 나타나지 않았으며 지역, 계절, 수심에 의한 뚜렷한 변화가 보이지 않았다. 모든 실험군에서 대부분의 아미노산이 다시마의 상측부위에 많이 함유하고 있었으며, 지역과 계절에 따라 일부 실험군 간에 아미노산 함량이 차이를 보였지만 수심에 따른 아미노산의 함량은 관찰되지 않았다. 지방산 함량은 부위 에 따라 많고 적은 지방산들이 있었고 불포화지방산들이 하측부위보다 상측부위에 많이 함유하고 있었다. 반면 포화지방산 은 하측부위에 많이 함유하고 있었다. 그러나 다시마의 양식 수심에 따라 이러한 조성들이 차이는 나타나지 않았다. 원소 N 는 상측부위가 많이 함유하고 있었으며 원소 C는 실험군에 따라 원소 N과 비교하여 경향을 띠었다.
주제어 : 다시마, 다시마 양식, 일반성분, 구성당, 아미노산, 지방산
Abstract : To develop the technology for cultivation of high-density seaweed, sea tangle was cultured from varying depths(0.5 m, 3 m) of seawater at Gijang and Wando area. Proximate composition, component sugar, total amino acid, fatty acid composition, and element composition of different parts of sea tangle (Saccharina japonica) have been examined. Significant differences were found in the amount of crude protein and ash content in lower, middle, and upper parts of algal blades. The upper parts of the sea tangle was rich in crude protein, while lower parts was rich in crude ash. Crude lipid content was higher in the middle parts than those of the other parts. The component sugars were not significantly different from all parts of algal blades. The highest content of most of the amino acids were found in the upper parts of the blades. The amount of saturated fatty acids concentrated mostly in lower parts of blades, while the content of polyunsaturated fatty acids concentrated in the upper parts. The highest N element contents were found in upper part of algal blades. However, the contents of those chemical component were not affected by the depths of seawater.
Keywords : Sea tangle, Cultivation of sea tangle, Proximate composition, Component sugar, Amino acid, Fatty acid
395
1. 서 론
석유 고갈로 인한 원유 수급의 불안정성과 개발도상국의 급 격한 경제성장으로 인한 세계 에너지 소비량 증가로 선진국들 은 에너지자원을 확보하기 위하여 노력을 다각도로 하고 있는 실정이다. 화석원료 자원이 전혀 없는 우리나라도 국내 실정에 맞는 지속 가능형 바이오매스를 활용한 수송용 바이오연료 개 발을 통해 국내 에너지 자립과 저탄소 녹색성장 구현이 절실하 나, 국내 고유의 다량 바이오매스 자원이 없고 바이오에너지에 대한 연구가 부족한 것이 현실이다.
해조류는 비식량계 바이오매스로써 경작지 잠식으로 인한 식 량생산 감소 및 식량 수급 불균형 문제를 야기하지 않으며, 육 상바이오매스 자원에 비해 단위면적 당 생산 수율이 높아, 해 조류를 원료로 하는 바이오에너지 생산기술은 국내 실정에 매 우 적합하며 경쟁력 있는 기술이라고 판단되어 진다. 더불어 해 조류는 목질계 원료에서 반드시 제거해야 하는 리그닌 성분이 없어 바이오에너지 생산 공정이 간편하다는 장점을 지닌다[1].
국내외에서 식탁용 및 기능성 제품에 필요한 해조류의 양 식기술은 일반화되어 있으나 바이오에너지 생산에 적합한 양 식 해조류 품종 및 양식 해역에 관한 연구는 전무하다. 바이 오에너지 생산을 위한 해조류의 전처리 및 당화 공정, 에너지 생산 공정에 대한 연구도 절실히 필요하지만 바이오매스의 대 량 생산을 위한 해조류 품종 및 양식 적지에 대한 연구가 체계 적이고 지속적으로 이루어 져야한다. 다시마는 성장속도나 단 위면적 및 단위시간당 생산량이 높은 해조류로서 바이오매스 대량생산 대상종으로 분류된다[2].
해조류는 영양학적으로 열량은 매우 낮으면서 비타민과 무 기질, 식이섬유소가 풍부하여 다시마, 미역 등과 같은 해조류 들은 건강기능성 식품으로 인기가 높다. 특히 다시마(Saccha- rina japonica Areschoug)는 갈조류로 칼슘, 칼륨, 마그네슘 및 인산 등이 풍부하며, 인체에 필요한 수십 종의 미량원소을 많 이 함유하고 있으며 다른 해조류에 비해 요오드의 함량이 높아 건강보조제품의 원료로 각광을 받고 있다. 더불어 탄수화물 중 다당류는 그 대부분이 비 섬유당질인 alginic acid, fucoidan 및 laminaran 등의 함량이 높아[3] 혈압저하, 혈중콜레스테롤저 하, 항암, 등 혈류개선 작용 및 지질대사 개선에 효과가 있는 것으로 밝혀졌다[4,5].
이러한 해조류 바이오매스의 대량생산과 이로부터 바이오 에너지 및 고부가 바이오소재를 생산하기 위한 산업을 이루기 위해서는 먼저 해조류 바이오매스에 대한 충분한 데이터베이 스가 구축이 되어야만 한다. 해조류 바이오매스 대량양식 해 역의 적지 선정과 우수한 대상종을 선별하기 위해서는 양식해 역의 영양염류 및 해조류의 구성성분의 분석이 필요하다. 또한, 청정액체연료와 기능성 식의약 제품, 고부가 바이오소재로 활 용하기 위해 체계적인 해조류의 데이터베이스 구축이 필요한 실정이다. 따라서 본 연구에서는 바이오에너지 생산을 위한 적 정 해조류를 선정하고, 대량생산 기술을 개발하기 위한 일환으 로 다시마가 많이 생산되는 기장과 완도에서 수심별로 다시마 를 양식하여 다시마의 주요 화학적 성분 함량을 변화를 관찰 하였다.
2. 실 험 2.1. 다시마 양식 및 다시마 전처리
다시마 양식은 전라남도 완도군 금일읍 사동어촌계와 부산 광역시 기장군 문동리 어촌계 어장에서 수행하였고 다시마 종 묘의 크기는 5 mm전후의 유아상태로 완도 금일에서는 2010 년 12월 1일에 종묘를 입식하였고, 기장에서는 2010년 12월 6일에 같은 크기의 종묘를 입식하였다. 양식은 일반적으로 어 민들이 수행하고 있는 표층 0.5 m 수층을 대조구로 하고 3 m 수심에서 양성시험을 수행하였다. 시료 채취는 3월과 4월에 시험양성중인 다시마를 0.5 m와 3 m 수층에서 한 클러스터씩 채취하여 실험실로 운반한 후, 조체의 엽장을 측정하였다. 기 장 다시마의 3월과 4월에 조체는 수돗물로 세척하고 조체 표 면의 이물질을 제거하였다. 엽장의 길이를 정확히 3등분하여 상, 중, 하(기저부: basal part)로 절단하고, 그늘에서 건조대를 이용하여 예비건조 한 후, 작은 조각으로 잘라 다시 동결건조 기로 48시간 이상 건조하였다. 수분함량이 10% 내외로 건조하 여 분말화하고, 각 다시마 분말은 3 등분하여(500 g) 3회 반복 시료로 사용하였다.
2.2. 일반성분 분석
일반성분 분석은 AOAC[6] 방법에 따라 분석하였다. 즉 수 분은 105 ℃ 건조법, 조회분은 550 ℃ 직접회화법, 조단백은 micro-Kjeldahl법, Folch et al.[7]의 방법, 탄수화물은 100에서 수분, 조지방, 조단백질, 조회분등을 뺀 값으로 하였다.
2.3. 구성당 분석
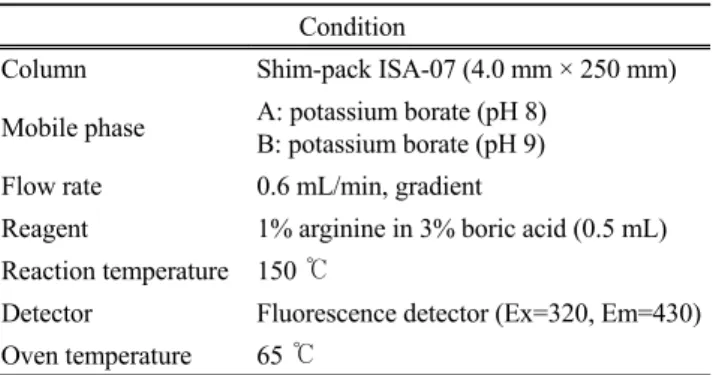
다시마 100 mg을 15 mL 시험관에 넣고 여기에 2 M HCl을 5.0 mL 가한 후 혼합하였다. 시험관 내부의 공기를 질소(N2) gas로 치환하고 마개를 하여 100 ℃로 가온된 가열블록에서 5시간 가열하여 가수분해 하였다[8]. 가수분해 된 시료를 냉각 하고 2 N NaOH를 5.0 mL 가하여 시료를 중화한 후 6000 rpm (650 x g)으로 30분간 원심분리하고, 상등액 3 mL를 취하여 0.45 µm membrane filter로 여과하고 구성당의 분석 시료로 사용하였다. 다시마의 구성당은 Table 1의 분석 조건에 따라 HPLC (Prominence HPLC, Shimadzu Co, Ltd. Kyoto, Japan)로 분석하였다[9].
Table 1. HPLC operating conditions for component sugars Condition
Column Shim-pack ISA-07 (4.0 mm × 250 mm) Mobile phase A: potassium borate (pH 8)
B: potassium borate (pH 9) Flow rate 0.6 mL/min, gradient
Reagent 1% arginine in 3% boric acid (0.5 mL) Reaction temperature 150 ℃
Detector Fluorescence detector (Ex=320, Em=430) Oven temperature 65 ℃
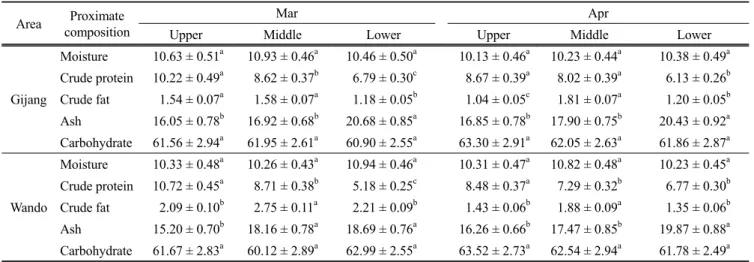
Table 2. Proximate composition(%) in the different parts of dried sea tangle (Saccharina. japonica) cultured in 0.5 m depth of water at Gijang and Wando areaa
Area Proximate composition
Mar Apr
Upper Middle Lower Upper Middle Lower
Gijang
Moisture 10.63 ± 0.51a 10.93 ± 0.46a 10.46 ± 0.50a 10.13 ± 0.46a 10.23 ± 0.44a 10.38 ± 0.49a Crude protein 10.22 ± 0.49a 8.62 ± 0.37b 6.79 ± 0.30c 8.67 ± 0.39a 8.02 ± 0.39a 6.13 ± 0.26b Crude fat 1.54 ± 0.07a 1.58 ± 0.07a 1.18 ± 0.05b 1.04 ± 0.05c 1.81 ± 0.07a 1.20 ± 0.05b Ash 16.05 ± 0.78b 16.92 ± 0.68b 20.68 ± 0.85a 16.85 ± 0.78b 17.90 ± 0.75b 20.43 ± 0.92a Carbohydrate 61.56 ± 2.94a 61.95 ± 2.61a 60.90 ± 2.55a 63.30 ± 2.91a 62.05 ± 2.63a 61.86 ± 2.87a
Wando
Moisture 10.33 ± 0.48a 10.26 ± 0.43a 10.94 ± 0.46a 10.31 ± 0.47a 10.82 ± 0.48a 10.23 ± 0.45a Crude protein 10.72 ± 0.45a 8.71 ± 0.38b 5.18 ± 0.25c 8.48 ± 0.37a 7.29 ± 0.32b 6.77 ± 0.30b Crude fat 2.09 ± 0.10b 2.75 ± 0.11a 2.21 ± 0.09b 1.43 ± 0.06b 1.88 ± 0.09a 1.35 ± 0.06b Ash 15.20 ± 0.70b 18.16 ± 0.78a 18.69 ± 0.76a 16.26 ± 0.66b 17.47 ± 0.85b 19.87 ± 0.88a Carbohydrate 61.67 ± 2.83a 60.12 ± 2.89a 62.99 ± 2.55a 63.52 ± 2.73a 62.54 ± 2.94a 61.78 ± 2.49a
aMean (n=3) values followed by the same letter within a row were not significantly different at p<0.05 according to Duncan’s multiple range test.
2.4. 총아미노산 분석
총아미노산의 분석은 ampoule에 분쇄한 시료 0.5 g과 6 N HCl 용액 15 mL를 각각 가한 후 진공 pump를 이용하여 진공 하에서 밀봉하여 110 ℃에서 24시간 가수분해하고 45 ℃에서 감압농축하여 산을 완전히 증발시킨 후, 구연산나트륨 완충 용액 (pH 2.2)을 사용하여 25 mL로 희석한 다음, 0.45 µm me- mbrane filter로 여과하여 분석시료로 사용하였다. 총아미노산 분석은 아미노산 자동분석기 (Shimadzu Co, Ltd. Kyoto, Japan) 를 사용하여 형광검출기를 이용하는 OPA (O-phthalaldehyde) 법으로 측정하였다. Column은 Shim-pack AMINO-Na (6.0×100 mm), buffer flow rate는 0.6 mL/min, OPA reagent flow rate는 0.3 mL로 설정하여 분석하였으며 형광검출기의 excitation 파 장은 350 nm와 emission 파장은 450 nm를 사용하였다[9].
2.5. 지방산조성 분석
다시마의 지방 추출은 Folch et al.[7]의 방법에 따라 시료 50 g을 homogenizer (Tissue grinder, IKA, Germany)로 마쇄한 후 chloroform-methanol (2:1, v/v) 용액을 시료의 약 10배량 가하 고 혼합하고 냉암소에서 하룻밤 방치한 후 상등액을 제거하고 하층 chloroform 부분을 무수 Na2SO4로 탈수 여과시켜 추출하 였다. 3회 추출 후 농축기로 농축하여 얻어진 지질을 15% BF3- methanol 용액을 사용하는 AOAC[6] 법에 따라 methylation을 하였다. 지방산 분석은 gas chromatography (Shimadzu GC-2010, Shimadzu Co, Ltd. Kyoto, Japan)를 사용하였으며 column은 SP-2560 (100 m × 0.25 mm id × 0.2 µm film thickness, Supelco Inc., Bellefonte, USA)과 oven의 온도는 150 ℃에서 5분간 머물 고 3 ℃/min로 상승시켜 250 ℃에서 5분간 유지하였다[9]. 운 반기체는 helium을 사용하여 18 cm/s로 유속을 설정하였으며 split rate는 1:50으로 하였다. FID (flame ionization detector)로 지방산을 검출하였고 이때 injection port와 FID의 온도는 각 각 270 ℃와 250 ℃로 하였다. 표준물질은 37 지방산 혼합물
(Supelco 37 Component FAME Mix, Sigma-Aldrich Co., Belle- fonte, PA, USA).
2.6. 원소분석
다시마의 원소분석(C, H, N, S)은 Flash FA 1112 (Finnegan) 원소분석기를 사용하였다. 분석조건은 He와 O2를 각각 130 mL/min과 100 mL/min을 사용하였으며 오븐온도는 50 ℃를 사용하였다.
2.7. 통계처리
모든 실험은 3회 반복하여 평균치로 나타내었으며, 유의성 검증은 SPSS (SPSS Inc., Chicago, IL, USA) software package (17)를 사용하여 p<0.05 수준에서 Duncan’s multiple range test 로 유의성을 검증하였다[10].
3. 결과 및 고찰 3.1. 일반성분
기장과 완도에서 수심 0.5 m(대조군)와 3 m에서 양식한 다 시마를 상․중․하로 나누어 분석한 결과 조단백질 함량은 상 측 부분이 하측부분 보다 유의적으로 높게 나타났다 (p<0.05) (Table 2, 3). 해조류의 조단백질함량은 같은 종류에 있어서도 생육장소, 해수 중의 영양염류 등에 따라 변한다[11]. 기장과 완도의 생육장소에 따른 조단백질함량의 차이는 대조구와 3 m에서 나타나지 않았다. 지방은 기장 3월 대조군을 제외한 모 든 시료에서 중>상=하 순서로 유의적인 함량 차이를 보였다 (p<0.05). 이 결과는 Khotimchenko and Kulikova[12]의 연구에 서 다시마의 지방산을 분석하기 위하여 상․중․하로 3등분 하여 실험한 결과와 유사하였다. 조회분은 대부분의 다시마에 서 하>중=상 순서로 함유하고 있었다(p<0.05). Choi et al.[13]
은 다시마의 일반성분 분석에서 조단백질 및 조회분의 함량 이 다른 연구와 비교할 때 다른 결과가 나타났다고 하였다.
Table 3. Proximate composition(%) in the different parts of dried sea tangle (Saccharina. japonica) cultured in 3 m depth of water at Gijang and Wando areaa
Area Proximate composition
Mar Apr
Upper Middle Lower Upper Middle Lower
Gijang
Moisture 10.25 ± 0.43a 10.69 ± 0.51a 10.48 ± 0.44a 10.51 ± 0.45a 10.69 ± 0.51a 10.73 ± 0.46a Crude protein 9.18 ± 0.39a 7.85 ± 0.35b 7.32 ± 0.30b 8.49 ± 0.42a 7.10 ± 0.30b 6.52 ± 0.30b Crude fat 0.77 ± 0.03b 0.87 ± 0.04a 0.57 ± 0.03c 1.46 ± 0.06b 1.80 ± 0.08a 1.59 ± 0.08b Ash 16.28 ± 0.66b 17.52 ± 0.72b 19.83 ± 0.92a 16.62 ± 0.70b 18.02 ± 0.81b 20.35 ± 0.93a Carbohydrate 63.53 ± 2.68a 63.07 ± 2.64a 61.79 ± 2.93a 62.92 ± 2.67a 62.39 ± 2.90a 60.81 ± 2.93a
Wando
Moisture 10.53 ± 0.45a 10.69 ± 0.45a 10.73 ± 0.53a 10.34 ± 0.46a 10.35 ± 0.46a 10.69 ± 0.51a Crude protein 9.84 ± 0.42a 8.18 ± 0.40b 6.91 ± 0.34c 8.43 ± 0.37a 7.83 ± 0.35a 6.81 ± 0.31b Crude fat 1.72 ± 0.07b 1.97 ± 0.08a 1.65 ± 0.08b 1.47 ± 0.07b 1.80 ± 0.08a 1.29 ± 0.06c Ash 15.02 ± 0.64c 16.25 ± 0.66b 18.62 ± 0.79a 17.56 ± 0.86b 18.33 ± 0.81b 20.95 ± 0.90a Carbohydrate 62.90 ± 3.03a 62.91 ± 2.55a 62.09 ± 2.52a 62.20 ± 2.92a 61.69 ± 2.48a 60.27 ± 2.79a
aMean (n=3) values followed by the same letter within a row were not significantly different at p<0.05 according to Duncan’s multiple range test.
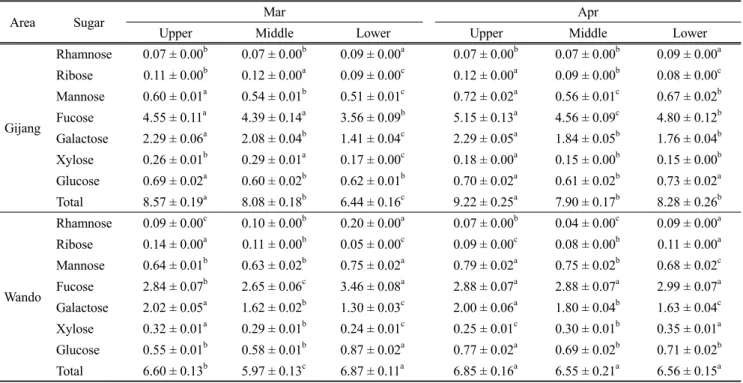
Table 4. The Variation of component sugar in the different parts of dried sea tangle (Saccharina. japonica) cultured in 0.5 m depth of water
at Gijang areaa g/100 g
Area Sugar Mar Apr
Upper Middle Lower Upper Middle Lower
Gijang
Rhamnose 0.07 ± 0.00b 0.07 ± 0.00b 0.09 ± 0.00a 0.07 ± 0.00b 0.07 ± 0.00b 0.09 ± 0.00a Ribose 0.11 ± 0.00b 0.12 ± 0.00a 0.09 ± 0.00c 0.12 ± 0.00a 0.09 ± 0.00b 0.08 ± 0.00c Mannose 0.60 ± 0.01a 0.54 ± 0.01b 0.51 ± 0.01c 0.72 ± 0.02a 0.56 ± 0.01c 0.67 ± 0.02b Fucose 4.55 ± 0.11a 4.39 ± 0.14a 3.56 ± 0.09b 5.15 ± 0.13a 4.56 ± 0.09c 4.80 ± 0.12b Galactose 2.29 ± 0.06a 2.08 ± 0.04b 1.41 ± 0.04c 2.29 ± 0.05a 1.84 ± 0.05b 1.76 ± 0.04b Xylose 0.26 ± 0.01b 0.29 ± 0.01a 0.17 ± 0.00c 0.18 ± 0.00a 0.15 ± 0.00b 0.15 ± 0.00b Glucose 0.69 ± 0.02a 0.60 ± 0.02b 0.62 ± 0.01b 0.70 ± 0.02a 0.61 ± 0.02b 0.73 ± 0.02a Total 8.57 ± 0.19a 8.08 ± 0.18b 6.44 ± 0.16c 9.22 ± 0.25a 7.90 ± 0.17b 8.28 ± 0.26b
Wando
Rhamnose 0.09 ± 0.00c 0.10 ± 0.00b 0.20 ± 0.00a 0.07 ± 0.00b 0.04 ± 0.00c 0.09 ± 0.00a Ribose 0.14 ± 0.00a 0.11 ± 0.00b 0.05 ± 0.00c 0.09 ± 0.00c 0.08 ± 0.00b 0.11 ± 0.00a Mannose 0.64 ± 0.01b 0.63 ± 0.02b 0.75 ± 0.02a 0.79 ± 0.02a 0.75 ± 0.02b 0.68 ± 0.02c Fucose 2.84 ± 0.07b 2.65 ± 0.06c 3.46 ± 0.08a 2.88 ± 0.07a 2.88 ± 0.07a 2.99 ± 0.07a Galactose 2.02 ± 0.05a 1.62 ± 0.02b 1.30 ± 0.03c 2.00 ± 0.06a 1.80 ± 0.04b 1.63 ± 0.04c Xylose 0.32 ± 0.01a 0.29 ± 0.01b 0.24 ± 0.01c 0.25 ± 0.01c 0.30 ± 0.01b 0.35 ± 0.01a Glucose 0.55 ± 0.01b 0.58 ± 0.01b 0.87 ± 0.02a 0.77 ± 0.02a 0.69 ± 0.02b 0.71 ± 0.02b Total 6.60 ± 0.13b 5.97 ± 0.13c 6.87 ± 0.11a 6.85 ± 0.16a 6.55 ± 0.21a 6.56 ± 0.15a
aMean (n=3) values followed by the same letter within arow were not significantly different at p<0.05 according to Duncan’s multiple range test.
이러한 결과는 다시마 채취 지역과 시기가 다른 이유에서도 이러한 결과가 나타날 수 있지만 다시마 조체의 전부를 시료로 사용하지 않고 일부분을 사용함으로서 나타날 수 도 있음을 본 연구에서 보여준다. 계절과 지역에 따른 일반성분의 함량 차이는 부위별 차이에 비해 유의적 차이를 나타내지 않았다 (p>0.05).
3.2. 구성당
다시마의 구성당은 일반적으로 fucose, galactose, glucose,
mannose 등의 순서로 함유하고 있었다(Table 4, 5). 해조류의 다당류는 세포벽골격다당류, 세포간점질다당류, 저장다당류 로 분류할 수 있는데, 다시마를 2 M HCl로 가수분해하여 얻 어진 단당류는 대부분 저장다당류로부터 분해된 것으로 판단 된다[11]. 기장과 완도의 대부분 다시마에서 부위별에 따른 각 구성당의 함량 차이는 있었으나(p<0.05) 일반성분과 같이 특징적 경향성은 띠지 않았다. Fucose의 함량은 모든 시료 군 에서 기장산이 완도산보다 높은 함량을 보였다(p<0.05). 대조 구와 3 m 수심에서 양식한 다시마 간의 각 구성당의 함량은
Table 5. The Variation of component sugar in the different parts of dried sea tangle (Saccharina. japonica) cultured in 3 m depth of water at
Gijang areaa g/100 g
Area Sugar Mar Apr
Upper Middle Lower Upper Middle Lower
Gijang
Rhamnose 0.07 ± 0.00b 0.07 ± 0.00b 0.10 ± 0.00a 0.04 ± 0.00c 0.09 ± 0.00b 0.11 ± 0.00a Ribose 0.11 ± 0.00a 0.08 ± 0.00c 0.09 ± 0.00b 0.12 ± 0.00a 0.11 ± 0.00b 0.10 ± 0.00c Mannose 0.62 ± 0.01a 0.46 ± 0.01c 0.50 ± 0.01b 0.65 ± 0.02a 0.65 ± 0.02a 0.63 ± 0.01a Fucose 4.42 ± 0.11a 3.85 ± 0.09b 3.78 ± 0.10b 5.22 ± 0.13a 4.91 ± 0.11b 4.68 ± 0.09c Galactose 1.86 ± 0.05a 1.36 ± 0.03b 1.43 ± 0.03b 2.28 ± 0.05a 2.04 ± 0.05b 1.76 ± 0.02c Xylose 0.20 ± 0.01a 0.15 ± 0.00c 0.19 ± 0.00b 0.21 ± 0.01b 0.21 ± 0.01b 0.26 ± 0.00a Glucose 0.55 ± 0.01b 0.46 ± 0.01c 0.67 ± 0.02a 0.64 ± 0.02b 0.72 ± 0.01a 0.73 ± 0.02a Total 7.83 ± 0.20a 6.44 ± 0.16b 6.76 ± 0.16b 9.17 ± 0.29a 8.73 ± 0.26ab 8.25 ± 0.19b
Wando
Rhamnose 0.08 ± 0.00c 0.10 ± 0.00b 0.16 ± 0.00a 0.10 ± 0.00b 0.10 ± 0.00b 0.13 ± 0.00a Ribose 0.09 ± 0.00c 0.12 ± 0.00b 0.13 ± 0.00a 0.12 ± 0.00a 0.10 ± 0.00c 0.11 ± 0.00b Mannose 0.72 ± 0.02b 0.84 ± 0.02a 0.74 ± 0.02b 0.84 ± 0.02a 0.79 ± 0.02b 0.79 ± 0.02b Fucose 2.89 ± 0.07c 3.53 ± 0.07b 4.45 ± 0.12a 4.50 ± 0.10b 4.80 ± 0.13a 5.00 ± 0.14a Galactose 1.97 ± 0.04b 2.10 ± 0.06a 1.97 ± 0.05b 2.84 ± 0.07a 2.33 ± 0.03b 2.25 ± 0.03b Xylose 0.27 ± 0.01c 0.43 ± 0.01b 0.47 ± 0.01a 0.48 ± 0.01c 0.52 ± 0.02b 0.62 ± 0.01a Glucose 0.58 ± 0.01c 0.80 ± 0.01b 0.92 ± 0.03a 0.66 ± 0.01b 0.64 ± 0.01b 0.81 ± 0.01a Total 6.61 ± 0.11c 7.92 ± 0.17b 8.84 ± 0.16a 9.54 ± 0.22a 9.29 ± 0.22a 9.72 ± 0.19a
aMean (n=3) values followed by the same letter within a row were not significantly different at p<0.05 according to Duncan’s multiple range test.
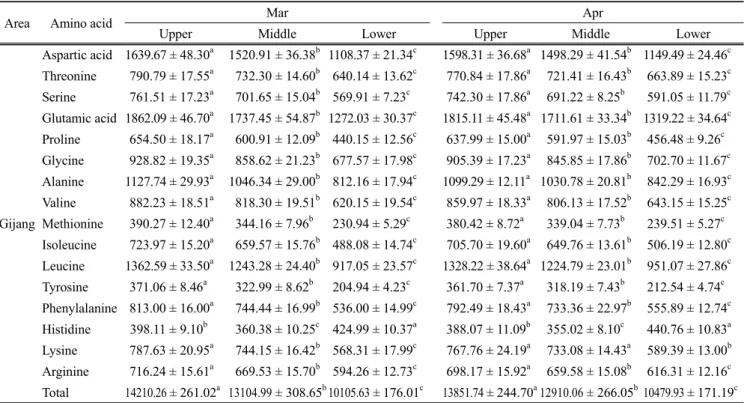
Table 6. The Variation of total amino acid contents in the different parts of dried sea tangle (Saccharina. japonica) cultured in 0.5 m depth of
water at Gijang and Wando areaa mg/100 g
Area Amino acid Mar Apr
Upper Middle Lower Upper Middle Lower
Gijang
Aspartic acid 1639.67 ± 48.30a 1520.91 ± 36.38b 1108.37 ± 21.34c 1598.31 ± 36.68a 1498.29 ± 41.54b 1149.49 ± 24.46c Threonine 790.79 ± 17.55a 732.30 ± 14.60b 640.14 ± 13.62c 770.84 ± 17.86a 721.41 ± 16.43b 663.89 ± 15.23c Serine 761.51 ± 17.23a 701.65 ± 15.04b 569.91 ± 7.23c 742.30 ± 17.86a 691.22 ± 8.25b 591.05 ± 11.79c Glutamic acid 1862.09 ± 46.70a 1737.45 ± 54.87b 1272.03 ± 30.37c 1815.11 ± 45.48a 1711.61 ± 33.34b 1319.22 ± 34.64c Proline 654.50 ± 18.17a 600.91 ± 12.09b 440.15 ± 12.56c 637.99 ± 15.00a 591.97 ± 15.03b 456.48 ± 9.26c Glycine 928.82 ± 19.35a 858.62 ± 21.23b 677.57 ± 17.98c 905.39 ± 17.23a 845.85 ± 17.86b 702.70 ± 11.67c Alanine 1127.74 ± 29.93a 1046.34 ± 29.00b 812.16 ± 17.94c 1099.29 ± 12.11a 1030.78 ± 20.81b 842.29 ± 16.93c Valine 882.23 ± 18.51a 818.30 ± 19.51b 620.15 ± 19.54c 859.97 ± 18.33a 806.13 ± 17.52b 643.15 ± 15.25c Methionine 390.27 ± 12.40a 344.16 ± 7.96b 230.94 ± 5.29c 380.42 ± 8.72a 339.04 ± 7.73b 239.51 ± 5.27c Isoleucine 723.97 ± 15.20a 659.57 ± 15.76b 488.08 ± 14.74c 705.70 ± 19.60a 649.76 ± 13.61b 506.19 ± 12.80c Leucine 1362.59 ± 33.50a 1243.28 ± 24.40b 917.05 ± 23.57c 1328.22 ± 38.64a 1224.79 ± 23.01b 951.07 ± 27.86c Tyrosine 371.06 ± 8.46a 322.99 ± 8.62b 204.94 ± 4.23c 361.70 ± 7.37a 318.19 ± 7.43b 212.54 ± 4.74c Phenylalanine 813.00 ± 16.00a 744.44 ± 16.99b 536.00 ± 14.99c 792.49 ± 18.43a 733.36 ± 22.97b 555.89 ± 12.74c Histidine 398.11 ± 9.10b 360.38 ± 10.25c 424.99 ± 10.37a 388.07 ± 11.09b 355.02 ± 8.10c 440.76 ± 10.83a Lysine 787.63 ± 20.95a 744.15 ± 16.42b 568.31 ± 17.99c 767.76 ± 24.19a 733.08 ± 14.43a 589.39 ± 13.00b Arginine 716.24 ± 15.61a 669.53 ± 15.70b 594.26 ± 12.73c 698.17 ± 15.92a 659.58 ± 15.08b 616.31 ± 12.16c Total 14210.26 ± 261.02a 13104.99 ± 308.65b10105.63 ± 176.01c 13851.74 ± 244.70a12910.06 ± 266.05b10479.93 ± 171.19c 차이는 부위별, 지역별, 채취시기별에 따라 유의적으로 함량
차이 나타났다(p<0.05). 3월과 4월에 채취한 기장 다시마의 경 우 fucose, galactose, glucose는 상측 부위가 하측 부위보다 유 의적으로 높은 함량을 나타내었으나 중간 부위와는 유의적 차 이를 나타내지 않았다(p<0.05). 반면, 완도 다시마의 하측 부위 는 fucose, mannose, glucose 함량이 상측 부위 보다 많은 함량을
나타내어(p<0.05) 지역간에 다른 단당류의 함량에서 양상을 보여 주었다.
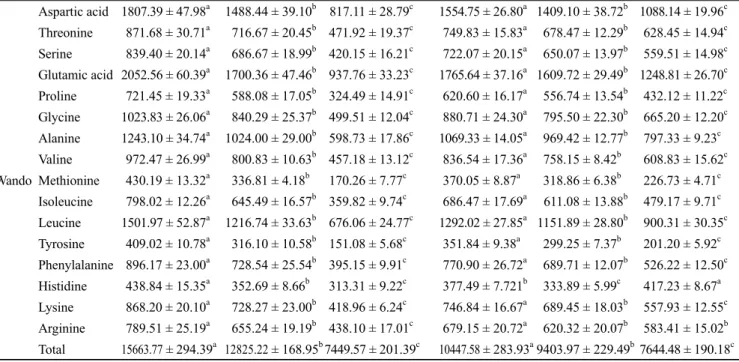
3.3. 총아미노산
다시마의 주요 아미노산은 glutamic acid, aspartic acid, leu- cine, alanine, glycine, valine, phenylalanine이었으며 cystine은
Wando
Aspartic acid 1807.39 ± 47.98a 1488.44 ± 39.10b 817.11 ± 28.79c 1554.75 ± 26.80a 1409.10 ± 38.72b 1088.14 ± 19.96c Threonine 871.68 ± 30.71a 716.67 ± 20.45b 471.92 ± 19.37c 749.83 ± 15.83a 678.47 ± 12.29b 628.45 ± 14.94c Serine 839.40 ± 20.14a 686.67 ± 18.99b 420.15 ± 16.21c 722.07 ± 20.15a 650.07 ± 13.97b 559.51 ± 14.98c Glutamic acid 2052.56 ± 60.39a 1700.36 ± 47.46b 937.76 ± 33.23c 1765.64 ± 37.16a 1609.72 ± 29.49b 1248.81 ± 26.70c Proline 721.45 ± 19.33a 588.08 ± 17.05b 324.49 ± 14.91c 620.60 ± 16.17a 556.74 ± 13.54b 432.12 ± 11.22c Glycine 1023.83 ± 26.06a 840.29 ± 25.37b 499.51 ± 12.04c 880.71 ± 24.30a 795.50 ± 22.30b 665.20 ± 12.20c Alanine 1243.10 ± 34.74a 1024.00 ± 29.00b 598.73 ± 17.86c 1069.33 ± 14.05a 969.42 ± 12.77b 797.33 ± 9.23c Valine 972.47 ± 26.99a 800.83 ± 10.63b 457.18 ± 13.12c 836.54 ± 17.36a 758.15 ± 8.42b 608.83 ± 15.62c Methionine 430.19 ± 13.32a 336.81 ± 4.18b 170.26 ± 7.77c 370.05 ± 8.87a 318.86 ± 6.38b 226.73 ± 4.71c Isoleucine 798.02 ± 12.26a 645.49 ± 16.57b 359.82 ± 9.74c 686.47 ± 17.69a 611.08 ± 13.88b 479.17 ± 9.71c Leucine 1501.97 ± 52.87a 1216.74 ± 33.63b 676.06 ± 24.77c 1292.02 ± 27.85a 1151.89 ± 28.80b 900.31 ± 30.35c Tyrosine 409.02 ± 10.78a 316.10 ± 10.58b 151.08 ± 5.68c 351.84 ± 9.38a 299.25 ± 7.37b 201.20 ± 5.92c Phenylalanine 896.17 ± 23.00a 728.54 ± 25.54b 395.15 ± 9.91c 770.90 ± 26.72a 689.71 ± 12.07b 526.22 ± 12.50c Histidine 438.84 ± 15.35a 352.69 ± 8.66b 313.31 ± 9.22c 377.49 ± 7.721b 333.89 ± 5.99c 417.23 ± 8.67a Lysine 868.20 ± 20.10a 728.27 ± 23.00b 418.96 ± 6.24c 746.84 ± 16.67a 689.45 ± 18.03b 557.93 ± 12.55c Arginine 789.51 ± 25.19a 655.24 ± 19.19b 438.10 ± 17.01c 679.15 ± 20.72a 620.32 ± 20.07b 583.41 ± 15.02b Total 15663.77 ± 294.39a 12825.22 ± 168.95b7449.57 ± 201.39c 10447.58 ± 283.93a9403.97 ± 229.49b7644.48 ± 190.18c
aMean (n=3) values followed by the same letter within a row were not significantly different at p<0.05 according to Duncan’s multiple range test.
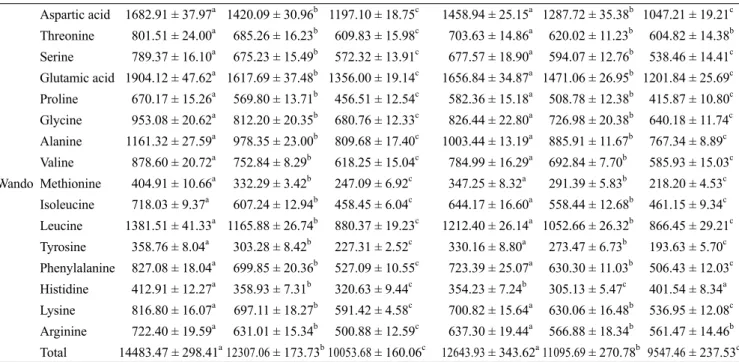
Table 7. The Variation of total amino acid contents in the different parts of dried sea tangle (Saccharina. japonica) cultured in 3 m depth of
water at Gijang and Wando areaa mg/100 g
Area Amino acid Mar Apr
Upper Middle Lower Upper Middle Lower
Gijang
Aspartic acid 1502.16 ± 36.93a 1295.03 ± 30.98b 1136.52 ± 21.88c 1468.24 ± 43.23a 1265.79 ± 35.09b 1039.65 ± 22.12c Threonine 724.47 ± 15.98a 623.54 ± 12.43c 656.40 ± 13.97b 708.11 ± 5.48a 609.46 ± 13.88b 600.45 ± 13.77b Serine 697.65 ± 13.77a 597.45 ± 12.81b 584.38 ± 7.41b 681.89 ± 17.15a 583.96 ± 6.97b 534.57 ± 10.66c Glutamic acid 1705.93 ± 36.16a 1479.41 ± 46.72b 1304.33 ± 31.14c 1667.41 ± 26.54a 1446.01 ± 28.16b 1193.16 ± 31.33c Proline 599.61 ± 9.39a 511.67 ± 10.29b 451.33 ± 12.88c 586.07 ± 10.75a 500.11 ± 12.69b 412.86 ± 8.37c Glycine 850.92 ± 22.30a 731.11 ± 18.08b 694.77 ± 18.44c 831.71 ± 19.78a 714.60 ± 15.09b 635.56 ± 10.56c Alanine 1033.17 ± 25.12a 890.95 ± 24.69b 832.78 ± 18.40c 1009.84 ± 27.04a 870.83 ± 17.58b 761.80 ± 15.31c Valine 808.24 ± 22.21a 696.78 ± 16.61b 635.89 ± 20.03c 789.99 ± 20.52a 681.04 ± 14.80b 581.69 ± 13.79c Methionine 357.54 ± 6.47a 293.05 ± 6.78b 236.81 ± 5.43c 349.47 ± 6.41a 286.43 ± 6.53b 216.62 ± 4.77c Isoleucine 663.25 ± 14.25a 561.61 ± 13.42b 500.48 ± 15.11c 648.28 ± 7.51a 548.93 ± 11.49b 457.82 ± 11.58c Leucine 1248.32 ± 22.87a 1058.64 ± 20.78b 940.34 ± 24.17c 1220.13 ± 37.90a 1034.73 ± 19.44b 860.19 ± 25.20c Tyrosine 339.94 ± 8.27a 275.02 ± 7.34b 210.14 ± 4.34c 332.27 ± 8.52a 268.81 ± 6.27b 192.23 ± 4.29c Phenylalanine 744.82 ± 20.88a 633.88 ± 14.46b 549.62 ± 15.37c 728.00 ± 15.13a 619.56 ± 19.41b 502.77 ± 11.52c Histidine 364.73 ± 4.80b 306.86 ± 8.73c 435.78 ± 10.63a 356.49 ± 10.18b 299.93 ± 6.84c 398.64 ± 9.80a Lysine 721.58 ± 15.76a 633.64 ± 13.98b 582.74 ± 18.44c 705.28 ± 22.22a 619.33 ± 12.19b 533.07 ± 11.76c Arginine 656.18 ± 7.29a 570.10 ± 13.37c 609.35 ± 13.06b 641.36 ± 14.62a 557.23 ± 12.74b 557.41 ± 11.00b Total 13018.52 ± 260.59a11158.73 ± 339.32b10361.68 ± 234.22c 12724.55 ± 289.90a10906.75 ± 290.20b 9478.49 ± 200.93c 모든 실험구에서 검출되지 않았다(Table 6, 7). Glutamic acid
와 aspartic acid가 총아미노산의 약 20% 이상을 차지하였다.
해조 단백질의 구성아미노산은 일반적으로 alanine, aspartic acid, glycine, proline과 같은 중성 및 산성아미노산이 많은 것 으로 알려져 있으나[11] 다시마는 glycine과 proline함량이 대 체로 낮게 함유하고 있었다. 함황아미노산 cystine과 cysteine은
검출되지 않았으며, methionine은 적은 함유량을 보였다(Table 6, 7). 또한, histidine과 tyrosine은 methionine과 유사한 함유량 을 보였다(Table 6). 모든 실험구의 다시마에서 glutamic acid, aspartic acid, leucine, alanine, valine 등 아미노산은 상>중>하 순서로 감소하는 경향을 보여 총 아미노산 함량도 같은 경향을 띠었다(p<0.05). 대조구(0.5 m) 완도 다시마는 3월보다 4월의
Wando
Aspartic acid 1682.91 ± 37.97a 1420.09 ± 30.96b 1197.10 ± 18.75c 1458.94 ± 25.15a 1287.72 ± 35.38b 1047.21 ± 19.21c Threonine 801.51 ± 24.00a 685.26 ± 16.23b 609.83 ± 15.98c 703.63 ± 14.86a 620.02 ± 11.23b 604.82 ± 14.38b Serine 789.37 ± 16.10a 675.23 ± 15.49b 572.32 ± 13.91c 677.57 ± 18.90a 594.07 ± 12.76b 538.46 ± 14.41c Glutamic acid 1904.12 ± 47.62a 1617.69 ± 37.48b 1356.00 ± 19.14c 1656.84 ± 34.87a 1471.06 ± 26.95b 1201.84 ± 25.69c Proline 670.17 ± 15.26a 569.80 ± 13.71b 456.51 ± 12.54c 582.36 ± 15.18a 508.78 ± 12.38b 415.87 ± 10.80c Glycine 953.08 ± 20.62a 812.20 ± 20.35b 680.76 ± 12.33c 826.44 ± 22.80a 726.98 ± 20.38b 640.18 ± 11.74c Alanine 1161.32 ± 27.59a 978.35 ± 23.00b 809.68 ± 17.40c 1003.44 ± 13.19a 885.91 ± 11.67b 767.34 ± 8.89c Valine 878.60 ± 20.72a 752.84 ± 8.29b 618.25 ± 15.04c 784.99 ± 16.29a 692.84 ± 7.70b 585.93 ± 15.03c Methionine 404.91 ± 10.66a 332.29 ± 3.42b 247.09 ± 6.92c 347.25 ± 8.32a 291.39 ± 5.83b 218.20 ± 4.53c Isoleucine 718.03 ± 9.37a 607.24 ± 12.94b 458.45 ± 6.04c 644.17 ± 16.60a 558.44 ± 12.68b 461.15 ± 9.34c Leucine 1381.51 ± 41.33a 1165.88 ± 26.74b 880.37 ± 19.23c 1212.40 ± 26.14a 1052.66 ± 26.32b 866.45 ± 29.21c Tyrosine 358.76 ± 8.04a 303.28 ± 8.42b 227.31 ± 2.52c 330.16 ± 8.80a 273.47 ± 6.73b 193.63 ± 5.70c Phenylalanine 827.08 ± 18.04a 699.85 ± 20.36b 527.09 ± 10.55c 723.39 ± 25.07a 630.30 ± 11.03b 506.43 ± 12.03c Histidine 412.91 ± 12.27a 358.93 ± 7.31b 320.63 ± 9.44c 354.23 ± 7.24b 305.13 ± 5.47c 401.54 ± 8.34a Lysine 816.80 ± 16.07a 697.11 ± 18.27b 591.42 ± 4.58c 700.82 ± 15.64a 630.06 ± 16.48b 536.95 ± 12.08c Arginine 722.40 ± 19.59a 631.01 ± 15.34b 500.88 ± 12.59c 637.30 ± 19.44a 566.88 ± 18.34b 561.47 ± 14.46b Total 14483.47 ± 298.41a12307.06 ± 173.73b10053.68 ± 160.06c 12643.93 ± 343.62a11095.69 ± 270.78b 9547.46 ± 237.53c
aMean (n=3) values followed by the same letter within a row were not significantly different at p<0.05 according to Duncan’s multiple range test.
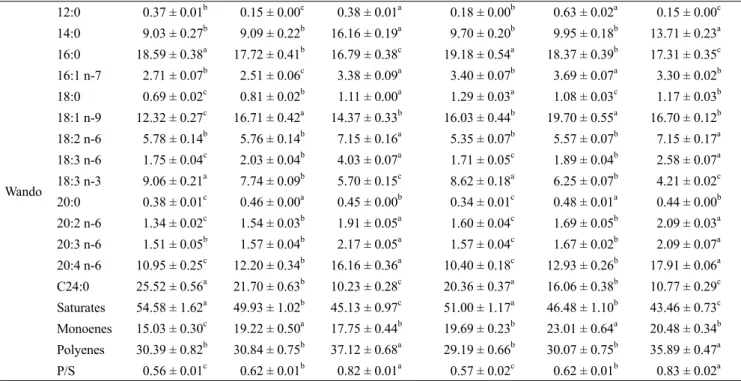
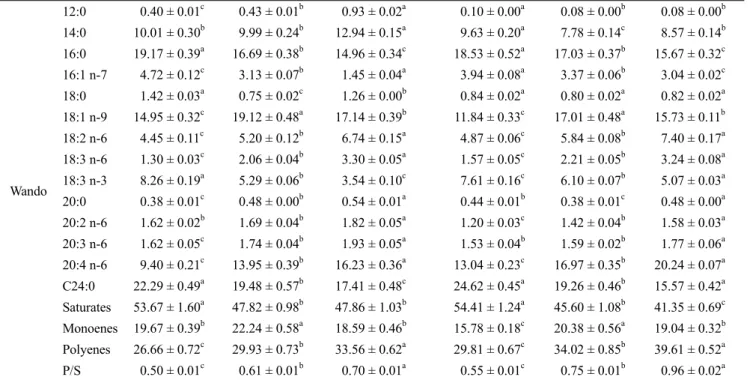
Table 8. The Variation of fatty acid composition (percentage of weight) in the different parts of dried sea tangle (Saccharina. japonica) cultured in 0.5 m depth of water at Gijang and Wando areaa
Area Fatty acid Mar Apr
Upper Middle Lower Upper Middle Lower
Gijang
12:0 0.44 ± 0.01a 0.20 ± 0.00b 0.18 ± 0.00c 0.35 ± 0.01b 0.22 ± 0.01c 0.42 ± 0.01a 14:0 11.05 ± 0.25a 8.45 ± 0.17c 9.46 ± 0.20b 7.98 ± 0.18b 7.63 ± 0.17b 9.04 ± 0.21a 16:0 17.63 ± 0.40a 16.82 ± 0.36b 14.29 ± 0.18c 18.09 ± 0.44a 17.44 ± 0.21a 16.14 ± 0.32b 16:1 n-7 5.21 ± 0.13a 3.52 ± 0.11b 2.62 ± 0.06c 5.02 ± 0.13a 3.77 ± 0.07b 2.69 ± 0.07c 18:0 0.96 ± 0.03b 1.02 ± 0.02a 1.02 ± 0.03a 0.82 ± 0.02b 0.96 ± 0.02a 0.80 ± 0.02b 18:1 n-9 16.49 ± 0.34b 18.74 ± 0.46a 15.28 ± 0.41c 15.13 ± 0.29b 18.44 ± 0.39a 18.33 ± 0.30a 18:2 n-6 4.50 ± 0.12c 7.23 ± 0.20b 8.63 ± 0.19a 4.74 ± 0.05c 5.56 ± 0.11b 7.11 ± 0.14a 18:3 n-6 1.31 ± 0.03c 1.87 ± 0.04b 3.34 ± 0.08a 1.67 ± 0.02c 2.63 ± 0.08b 3.46 ± 0.10a 18:3 n-3 9.67 ± 0.20a 5.28 ± 0.13b 4.66 ± 0.15c 6.78 ± 0.14a 5.35 ± 0.12b 3.94 ± 0.09c 20:0 0.38 ± 0.01c 0.68 ± 0.02a 0.45 ± 0.01b 0.43 ± 0.01b 0.33 ± 0.01c 0.56 ± 0.01a 20:2 n-6 1.47 ± 0.03c 1.84 ± 0.04b 1.96 ± 0.06a 1.42 ± 0.04c 1.52 ± 0.03b 1.80 ± 0.05a 20:3 n-6 1.81 ± 0.04c 1.98 ± 0.04b 2.07 ± 0.05a 1.51 ± 0.04c 1.82 ± 0.03b 1.96 ± 0.06a 20:4 n-6 9.51 ± 0.22c 13.94 ± 0.37b 21.32 ± 0.44a 10.81 ± 0.22c 14.87 ± 0.35b 19.81 ± 0.44a C24:0 19.59 ± 0.39a 18.42 ± 0.42b 14.71 ± 0.41c 25.26 ± 0.59a 19.47 ± 0.61b 13.94 ± 0.32c Saturates 50.05 ± 1.15a 45.61 ± 1.30b 40.12 ± 0.98c 52.92 ± 1.51a 46.05 ± 1.05b 40.89 ± 1.02c Monoenes 21.70 ± 0.58b 22.25 ± 0.49a 17.90 ± 0.57c 20.15 ± 0.63b 22.21 ± 0.44a 20.91 ± 0.52b Polyenes 28.26 ± 0.62c 32.14 ± 0.75b 41.98 ± 0.90a 26.93 ± 0.61c 31.75 ± 0.73b 38.08 ± 0.66a P/S 0.56 ± 0.01c 0.70 ± 0.02b 1.05 ± 0.02a 0.51 ± 0.01c 0.69 ± 0.02b 0.93 ± 0.02a 아미노산 함량이 낮게 나타났으나 기장의 같은 실험구에서는
이러한 경향은 보이지 않았다(Table 6). 대조구 완도 다시마 의 하측 부위는 대조구 기장 다시마 보다 낮은 아미노산의 함 량을 보였으나, 수심 3 m 완도 다시마의 하측 부위는 같은 군 의 기장 다시마와 유사한 아미노산 함량을 나타내었다. 기장
다시마의 대조구와 수심 3 m 다시마의 아미노산 함량을 비교 할 때 대조군이 대부분의 다시마 부위에서 높은 아미노산 함 량의 결과를 보였다(p<0.05). 반면, 완도 다시마에서는 수심 3 m 다시마가 대조구보다 모든 부위에서 아미노산 함량이 높은 것으로 나타났다(p<0.05, Table 6, 7).