Ⅰ. Introdution
Recently, emotion recognition has been an increasingly important area in HCI (Human-Computer Interface), ergonomics, robotics, etc[1~2]. There are many emotion representation methods such as
emotional dimension, facial expression, bio-signal, etc.
Because user can not adjust their bio signalsartificially, many studies utilize these signals to decide emotion[3~5].
The most widely used physiological responses are Electroencephalogram (EEG), Electrocardiogram (ECG) and Skin conductance, etc. Among them, the EEG signal has a higher correlation with emotion than other bio-signals[3]. Therefore, many researchers utilize EEG signal to classify emotion. EEG signals are commonly categorized based on their amplitude, shape, frequency and the locations of its sensors (frontal, parietal, temporal and occipital). The frequency 논문 2017-54-7-9
EEG 신호 기반 경사도 방법을 통한 감정인식에 대한 연구
( A Novel Method for Emotion Recognition based on the EEG Signal using Gradients )
한 의 환*, 차 형 태**
( EuiHwan Han and HyungTai Chaⓒ)
요 약
감정을 분류하는 대표적인 알고리즘에는 Support-vector-machine (SVM), Bayesian decision rule 등이 있다. 하지만 기존의 연구자들은 위와 같은 방법에는 문제점이 있다고 지적하였다. 이를 보완하기 위해 다른 연구자는 경사도를 이용하여 새로운 패턴인식 알고리즘을 제안하였다. 본 논문에서는 이 알고리즘을 통해 새로운 EEG 기반의 감정 인식 알고리즘을 제안하고 기 존의 연구와 비교한다. 본 논문에서는 신뢰도 높은 자료를 얻기 위해 여러 논문에서 사용된 DEAP (a database for emotion analysis using physiological signals)를 사용하였다. 또한, 객관적인 검증을 위해 기존의 연구에서 사용된 4개의 뇌파 채널 (Fz, Fp2, F3, F4)의 PSD (Power Spectral Density)를 특징으로 사용하여 감정의 2개 척도 (Arousal, Valence)를 분류하였다.
본 논문에서 실시한 교차검증 (4-fold)에 의하면 Valence 축에서 85%, Arousal 축에서 87.5의 정확도를 얻을 수 있었다.
Abstract
There are several algorithms to classify emotion, such as Support-vector-machine (SVM), Bayesian decision rule, etc.
However, many researchers have insisted that these methods have minor problems. Therefore, in this paper, we propose a novel method for emotion recognition based on Electroencephalogram (EEG) signal using the Gradient method which was proposed by Han. We also utilize a database for emotion analysis using physiological signals (DEAP) to obtain objective data. And we acquire four channel brainwaves, including Fz (α), Fp2 (β), F3 (α), F4 (α) which are selected in previous study. We use 4 features which are power spectral density (PSD) of the above channels. According to performance evaluation (4-fold cross validation), we could get 85% accuracy in valence axis and 87.5% in arousal. It is 5-7% higher than existing method’s.
Keywords : Emotion, DECAF, Pattern recognition, Gradient method
*정회원, 숭실대학교 대학원 전자공학과 (Department of Electronic Engineering, Graduate School of Soongsil University)
**정회원, 숭실대학교 전자전보공학부 (Department of Electronic Engineering, Soongsil University)
ⓒCorresponding Author (E-mail : [email protected]) Received ; March 6, 2017 Revised ; April 13, 2017 Accepted ; June 30, 2017
(1059)
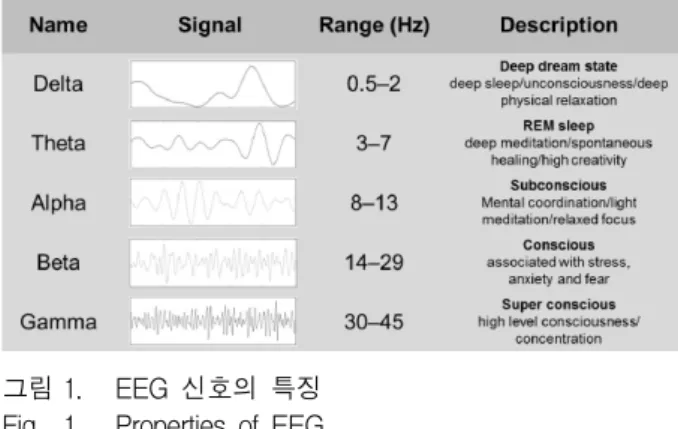
(Delta, Beta, Alpha, Theta and Gamma) is the most familiar parameter of classification[4~5]. The frequency characteristics of the human EEG are shown in Fig. 1.
그림 1. EEG 신호의 특징 Fig. 1. Properties of EEG.
Studies on emotional classification which based on EEG signal commonly take advantage of pattern recognition algorithms to decode emotion. There are many machine learning methods. Among them, the most typical methods of machine learning are SVM (support-vector-machine) and Bayesian decision rule, etc.
The Bayesian decision rule is a parametric learning method that utilizes prior probability density and likelihood. And it decides emotional state based on the confidence level of distribution. Because this method utilizes data distribution assumption, it is easy to mathematize decision curve as a formula[6]. The SVM is a non-parametric learning algorithm which finds maximum-margin hyperplane to decide classes. Using this hyperplane, the SVM method could maximize generalization ability[6]. Actually, this algorithm is renowned for its excellent generalization ability.
However, several studies have insisted that these methods have minor problems[7~10]. Therefore, we propose a new emotion classification method using the Gradient method. This algorithm that was proposed by Han[7]. The method assumes data distribution to be Gaussian (like parametric learning method) and it determines classes using the gradient of Gaussian functions. Another researcher investigated that this method could obtain higher accuracy than
Naïve Bayesian (NB) method[7].
Our paper is composed of five themed chapters including an introduction. Chapter 2 begins by laying out the related studies that are fundamental to understand our algorithm. The third chapter contains problems in the existing method and indicates our aim of study. The fourth section is concerned with the experiment protocol and analysis of our paper.
Finally, in chapter five, the conclusion gives a brief summary and critique of our study, and includes a discussion of the implication of the findings for future research into this field.
Ⅱ. Related Work
1. Gradient decision method
The NB classifier that commonly used in pattern recognition theory, researchers assume data set to be Gaussian, find discriminant function and obtain decision curve using Bayesian decision theory. We describe a Bayesian classifier in Fig. 2 and Equation 1.
그림 2. Bayesian 분류기 Fig. 2. Bayesian classifier.
arg x → x∈ (1)
x xi (Bayes rule)
where P() is probability operator and P(|) is condition probability.
The Gradient decision method that was proposed by Han[7] classify classes using the gradient vector.
This method has four steps: 1. Assume dataset to be
Gaussian distribution; 2. Obtain the gradient vector; 3.
Find the angle between a resultant vector and gradient; 4. Classify classes using the angle. It could complement the existing model (Naïve Gaussian classifier) and could obtain high accuracy result. We described in Fig. 3. As you are shown in Fig. 3, we could explain the Gradient decision method caparison with Naïve Bayesian (NB) classifier. The Gradient decision method (right in Fig. 3), it is same first step (assuming to be Gaussian) with NB classifier, however, the other steps are little different.
그림 3. 나이브 베이지안 결정 이론 (왼쪽), 경사도 결정 방법 (오른쪽)
Fig. 3. Naïve Bayesian decision rule (left) and Gradient decision method (right).
This method finds decision curve using the summation of the gradient vector. Researchers calculate the angle between resultant vector ( ) and each gradient vector ( and ) at a point (red dot). And they compare magnitudes of angles (It is easy to calculate using the inner product of vector).
Using this way, they could get zero point gradient line (like the discriminant function in NB classifier) and determine which classes are contained
2. Valence-Arousal model
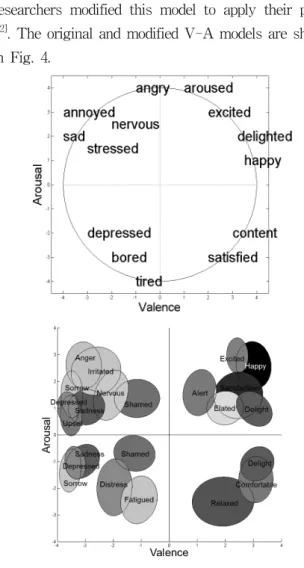
The emotional dimension (V-A model) was proposed by Russell[11]. This model represents the state of one’s emotion on the two axes. One is valence which means pleasantness of a stimulus. The other is arousal, the intensity of emotion provoked by
a stimulus. This model could quantify sentiment easily and indicates emotion geometrically. So, there are many studies which utilize this model. Many researchers modified this model to apply their paper
[12]. The original and modified V-A models are shown in Fig. 4.
그림 4. V-A 오리지널 모델(위), V-A 수정된 모델(아래) Fig. 4. V-A original model (up) and V-A modified model
(down).
Ⅲ. Troubleshooting
In chapter two, we discussed typical two algorithms of pattern recognition. However, other researchers have insisted that SVM and NB have several problems. We indicate them as below.
First, Burges[8] said that “the biggest limitation of support vector is selecting of the kernel and the second problem is lies in speed and size in training and testing”.
Second, Olson[9] has insisted that “the most serious problems in SVMs are requesting high algorithmic complexity and extensive memory on programming”.
Third, Han[7] said that “the NB classifier is reasonable and produce proper results only when the features of it have same”.
Finally, Rennie[10] said that “NB selects poor weights to find a decision curve if one class has more training sets than another. And NB classifier assumed that all of the features are independent”.
Therefore, we proposed a novel method for emotion recognition that based on EEG signals. To complement above problems and in order to improve accuracy of result, we utilize the Gradient decision rule which was discussed in Chapter 2.2.
Ⅳ. The Proposed Algorithm
그림 5. 알고리즘 흐름도
Fig. 5. Algorithm flow.
In this chapter, we introduce a reliable emotion recognition method. To do this, we utilize a database for emotion analysis using physiological signals (DEAP)[13] and Gradient decision rule which is mentioned in Chapter 3. We provide our algorithm flow in Fig. 5 and given the following information about our algorithm.
1. Experiment Protocol
In this section, we discuss our experiment settings.
At first, for reliable dataset, we utilize a DEAP dataset. The DEAP dataset is data set of the EEG signals of 32 participants (19-37 years old, mean:
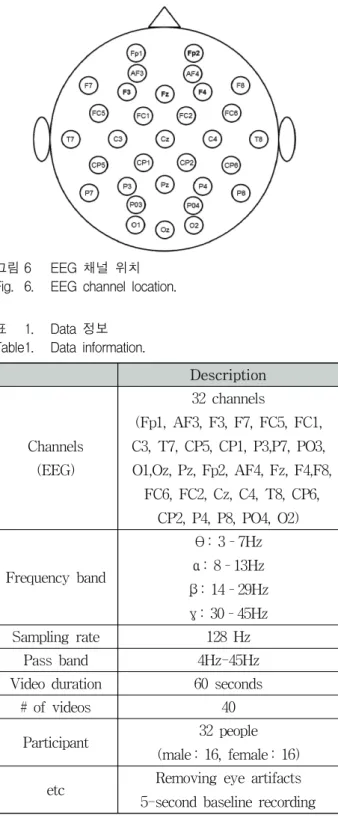
26.9) about 40 one-minute long excerpts of music video[13]. The EEG channel location and properties of their EEG signals are shown below (Fig. 6 & Table 1).
그림 6 EEG 채널 위치 Fig. 6. EEG channel location.
표 1. Data 정보 Table1. Data information.
Description
Channels (EEG)
32 channels
(Fp1, AF3, F3, F7, FC5, FC1, C3, T7, CP5, CP1, P3,P7, PO3, O1,Oz, Pz, Fp2, AF4, Fz, F4,F8,
FC6, FC2, Cz, C4, T8, CP6, CP2, P4, P8, PO4, O2)
Frequency band
θ: 3–7Hz α: 8–13Hz β: 14–29Hz γ: 30–45Hz
Sampling rate 128 Hz
Pass band 4Hz-45Hz
Video duration 60 seconds
# of videos 40
Participant 32 people
(male : 16, female : 16) etc Removing eye artifacts
5-second baseline recording
Participants also rated videos in terms of arousal, valence, like/dislike, dominance and familiarity using self-assessment manikins (SAM) scales[14] (Fig. 7).
그림 7. SAM 척도 Fig. 7. SAM scales.
In this paper, we utilize a portion of the DEAP dataset. According to existing study[3], they use only four channel signals (Fz, Fp2, F3, F4), four participants (s01 - s04) and two ratings (valence, arousal) about 40 videos. Therefore, we set the same conditions (features, participant, etc.) with this paper’s, and then we compare our results and theirs.
2. Classifying methods
In chapter two, we discussed several pattern recognition algorithms. However, there are minor problems, so we introduced the Gradient decision method (Chapter 3). Therefore, in this paper, we utilize this algorithm. Detailed process is given below.
At first, we should select features. As we mentioned in chapter 4.1, we match all conditions with existing study[3]. Therefore, we utilize power spectral density (PSD) of 4 channels’ EEG signal which are acquired from four participants (s01—s04).
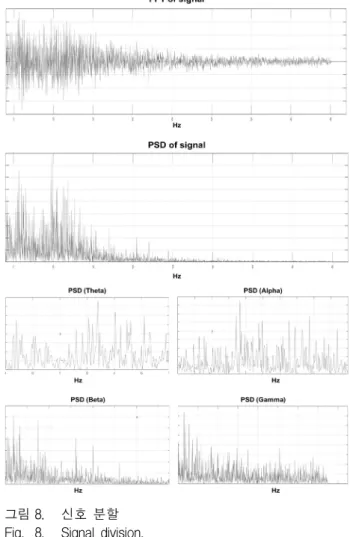
To do this, we calculate FFT (fast Fourier transform) of signals and divide it according to frequency band.
We described in Fig. 8. And we also use two rating score, which is valence and arousal. (EEG signals and rating score are about 40 videos.) PSD equation is shown in Equation 2 and information of selected features are shown in Table 2.
lim
→∞
(2)그림 8. 신호 분할 Fig. 8. Signal division.
where T is the time duration of a signal x(t), E() is energy operator and e is the natural logarithm.
표 2. 선택된 특징 정보
Table2. nformation of selected features.
Description Channels
(EEG)
4 channels (F3, Fp2, Fz, F4,) Ratings Valence and Arousal Participant
s 4 (s01—s04).
Features
Valence Arousal
F3 (α)
F3 (α)– F4
(α)
Fz (α)/
Fp2 (β)
Fp2 (β)/
Fp2 (α)
As you are shown in Table 2, we utilize alpha waves for F3 (F3 (α)) and differential alpha waves for F3 and F4 (F3 (α)-F4 (α)) to classify valence
ratings. And we use the ratio of alpha waves for Fz to beta waves for Fp2 (Fz (α)/Fp2 (β)) and ratio of beta waves for Fp2 to alpha waves for Fp2 (Fp2 (β) /Fp2 (α)). These four channels are located in the frontal lobe that was related to emotion[3].
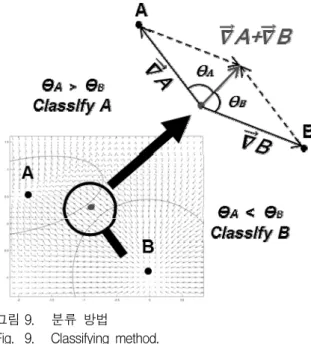
Second, we classify valence and arousal using Gradient decision rule which is mentioned in Chapter 2. We describe this method using Fig. 9.
그림 9. 분류 방법
Fig. 9. Classifying method.
Each rating (valence and arousal) has two features (F3(α) and F3(α)-F4(α) are used for valence, Fz (α)/Fp2(β) and Fp2(β)/Fp2(α) are for arousal), so we utilize bivariate normal function. After we find the distribution equation, we could obtain the gradient of the function. We describe an example of this step in Figure 9. As you are shown in Fig. 9, we express the gradient vectors of distribution (red is A’s gradient vector and blue is B’s). And then, we calculate summation two vectors ( ). Finally, we could get the angle between a resultant vector and each vector using inner product. We indicate it in Equation 3.
cos
(3)
where v1, v2 are vector, and |a| is magnitude of vector a.
After we measure angle, we could find decision curve and we could determine which class is suitable.
The example of the Gradient decision curve is shown in Fig. 10.
그림 10. 경사도 결정 곡선 Fig. 10. Gradient decision curve.
3. Analysis of Our study
In this section, we analysis our results and compare with existing study[3]. We indicate previous results in Table 3.
표 3. 정확도 (기존이론)
Table3. Results of exisiting study.
Accuracy(%) Valence
s01 s02 s03 s04
80.25 75.61 76.94 79.43
Arousal
s01 s02 s03 s04
73.65 74.04 74.56 72.58
They utilized SVM algorithm to classify classes.
According to their paper, they got the best accuracy with 80.25% (s01) in valence and 74.56% (s03) in arousal (We shaded high value in Table 3). And the average value is 78.05% in valence and 73.7% in arousal. Next, we describe our results in Table 4.
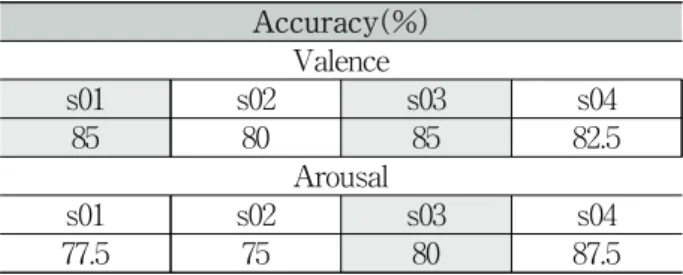
표 4. 정확도 (본 논문) Table4. Results of our study.
Accuracy(%) Valence
s01 s02 s03 s04
85 80 85 82.5
Arousal
s01 s02 s03 s04
77.5 75 80 87.5
Our algorithm obtains the best accuracy with 85%
(s01 and s03) in valence and 87.5% (s04) in arousal (We shaded high value in Table 4). And the average value is 83.125% in valence and 80% in arousal.
Ⅴ. Results and Conclusion
In this paper, we introduce a novel method for emotion recognition. There are several problems in existing pattern recognition algorithms, so we utilize the Gradient decision method. We also use DEAP database set (same condition with existing study) for an objective performance evaluation. According to this appraisal, our algorithm has higher accuracy than existing study about 5-7% using the same training set. As a result, we could propose a more reliable method. Of course, the reader should bear in mind that our study focuses on higher accuracy rather than low computation. However, it could be solved by downsizing resolution and using high computing power. Using our method, researchers could obtain high accurate results. In the future, we are going to investigate more reliable algorithm and compare our method with other pattern recognition methods using many bio-signals.
REFERENCES
[1] E. H. Han, and H. T. Cha., “A Study of Emotional Dimension for Mixed Feelings,” Korea Journal of KOSES, Vol. 16, No. 4, pp. 469-480, 2013.
[2] E. H. Han, and H. T. Cha., “A Study of Emotional Dimension that takes into account the Characteristics of the Arousal axis,” Korea Journal of KOSES, Vol. 17, No. 3, pp. 57-64, 2014.
[3] David. Lee, S. G. Lee, “The EEG Signal Based Emotion Recognition Using the EMD,” Journal of KIIT, Vol. 12, No. 6, pp. 47–53, June 2014.
[4] Blume. Warren. T, and Kaibara. Masako, Atlas of Pediatric, Philadelphia: Lippincott Williams &
Wilkins.
[5] Niedermeyer. E. and Lopes da Silva F., Electroencephalography: Basic Principles, Clinical Applications, and Related Fieldstlas of Pediatric, Philadelphia: Lippincott Williams & Wilkins.
[6] I. S. Oh., Pattern Recognition, Seoul: Kyobobook Press.
[7] E. H. Han, and H. T. Cha., “A Novel Method for Reliable Classifier using Gradient,” IEEK Transactions on Smart Processing and Computing, Vol. 6, No. 2, 2016.
[8] Christopher J. C. Burges, “A Tutorial on Support Vector Machines for Pattern Recognition,” Data Min Knowl Discov, Vol. 2, No. 2, pp. 121-167, Jun. 1998.
[9] Olson. David. L, and Delen. D, Advanced Data Mining Techniques, Berlin: Springer Press.
[10] J. D. Rennie, et al., “Tackling the Poor Assumptions of Naive Bayes Text Classifiers,”
in Proc. of ICML, pp. 616-623, 2003.
[11] James. A. Russell., “A Circumplex Model of Affect,” Journal of Personality and Social Psychology, Vol. 39, No. 6, pp. 1161-1178, 1980.
[12] E. H. Han, and H. T. Cha., “A Novel Method for Classifying Affective Terms using the Emotional Region Model,” Korea Journal of KOSES, Vol. 20, No. 2, 2016.
[13] S. Koelstra, et al., “DEAP: A Database for Emotion Analysis using Physiological Signals,”
IEEE Transaction on Affective Computing, Vol.
3, No. 4, pp. 18-31, 2012.
[14] Bradley. M. M. and Lang. P.J, “Measuring emotion: the Self-Assessment Manikin and the Semantic Differential,” Journal of Behav Ther Exp Psychiatry, Vol. 25, No. 1, pp. 49-59, Mar.
1994.
저 자 소 개 한 의 환(정회원)
2012년 숭실대학교 정보통신전자 공 학부 학사 졸업.
2014년 숭실대학교 전자공학과 석 사 졸업.
2014년~현재 숭실대학교 전자공학 과 통합과정.
<주관심분야: Pattern Recognition, Emotion Estimation, Bio-signal, Statistical Signal Processing>
차 형 태(정회원)
1985년 숭실대학교 전자공학과 학사 졸업.
1988년 Pittsburgh 전자공학과 석사 졸업.
1993년 Pittsburgh 전자공학 박사 졸업.
1996년~현재 숭실대학교 전자공학부 정교수
<주관심분야 : Multimedia Signal Processing, Communication System, ASIC Implementation>