https://doi.org/10.12997/jla.2017.6.1.29
pISSN 2287-2892 • eISSN 2288-2561
JLA
Association between Metabotropic Glutamate Receptor 1 Polymorphism and Cardiovascular Disease in Korean Adults
Yoonjin Shin1, Jaehyun Park2, Sungho Won2,3, Yangha Kim1
1Department of Nutritional Science and Food Management, Ewha Womans University, Seoul,
2Interdisciplinary Program in Bioinformatics, Seoul National University, Seoul,
3Department of Public Health Science, Graduate School of Public Health, Seoul National University, Seoul, Korea
Objective: The mGluR1 (metabotropic glutamate receptor 1) gene, a G protein–coupled receptor, is known to mediate perceptions of umami tastes. Genetic variation in taste receptors may influence dietary intake, and in turn have an impact on nutritional status and risk of chronic disease. We investigated the association of mGluR1 rs2814863 polymorphism with lipid profiles and cardiovascular disease (CVD) risk, together with their modulation by macronutrient intake in Korean adults.
Methods: The subjects consisted of 8,380 Koreans aged 40-69 years participating in the Anseong and Ansan Cohort Study, which was a part of the Korean Genome Epidemiology Study (KoGES). Data was collected using self-administered questionnaires, anthropometric measurements, and blood chemical analysis.
Results: Carriers of C allele at mGluR1 rs2814863 was associated with decreased high density lipoprotein cholesterol (HDL-C) and increased triglyceride as compared to carriers of TT. Also, carriers of the C allele showed higher fat intake and lower carbohydrate intake than those with carriers of TT. After adjustment for multiple testing using false-discovery rate method, the significant difference of HDL-C, triglyceride, dietary fat, and carbohydrate across genotypes disappeared. Gene-diet interaction effects between rs2814863 and macronutrients intake were not significantly associated with HDL-C and triglyceride levels. However, carriers of C allele demonstrated significantly higher odds of CVD {odds ratio=1.13, 95% CI=1.02-1.25}
compared with carriers of TT.
Conclusions: Our findings support significant associations between the mGluR1 rs2814863 genotype and CVD-related variables in Korean adults. However, these associations are not modified by macronutrient intake. (J Lipid Atheroscler 2017 June;6(1):29-38) Key Words: mGluR1, rs2814863, Single nucleotide polymorphism, Macronutrient intake, Cardiovascular disease
Received:
Revised:
Accepted:
February 10, 2017 May 16, 2017 May 19, 2017
Corresponding Author: Yangha Kim, Department of Nutritional Science and Food Management, Ewha Womans University, 52, Ewhayeodae-gil, Seodaemun-gu, Seoul 03760, Korea
Tel: +82-2-3277-3101, Fax: +82-2-3277-4425, E-mail: [email protected]
This is an Open Access article distributed under the terms of the Creative Commons Attribution Non-Commercial License (http://creativecommons.org/licenses/by-nc/3.0) which permits unrestricted non-commercial use, distribution, and reproduction in any medium, provided the original work is properly cited.
INTRODUCTION
Cardiovascular disease (CVD) continues to be a leading cause of mortality among adults in developed countries.1 The poor lipid profiles are major risk factor of CVD, including increased total cholesterol, low density lipoprotein cholesterol (LDL-C), triglyceride, and reduced
high density lipoprotein cholesterol (HDL-C) concen- trations.2-5 Lipid profiles can be modified or controlled though lifestyle intervention such as dietary changes.6,7 Several epidemiological studies have shown that dietary fat intake is strongly and positively associated with coronary artery disease.8,9 On the contrary, low- carbohydrate and high-protein diet improves the lipid
profiles and is negatively associated with cardiovascular risk.10 Furthermore, recent reports indicate that inter- actions between genetic variations and dietary macro- nutrient intake could modify the CVD risk.11,12
The mGluR1 (metabotropic glutamate receptor 1) is a member of class C G-protein coupled receptor family, which is expressed in taste buds and responsible for umami taste perception. In the tongue, umami substance binds to mGluR1 genes which, upon being activated, change the firing rate of innervating sensory nerves. Umami is a pleasant savoury taste imparted by monosodium glutamate (MSG) and 5′-ribonucleotides,13 which are naturally occurring in foods including vegetable, seafood, meat and cheese. One report14 suggested that high intensity of umami perception was associated with an increased BMI, and another15 found that obese women showed a lower umami sensitivity and prefer higher concentration of MSG. These results somewhat suggest that altered umami sensitivity or preference may affect eating behavior and nutritional status.
The mGluR1 gene variations are reportedly associated with umami taste sensitivity in humans.16,17 Raliou et al.
identified the associations between sensitivity to MSG and single nucleotide polymorphisms (SNPs) in mGluR1 at the individual level.16 The mutation T2977C in mGluR1 tended to be associated with the non-taster phenotype that presented specific ageusia for glutamate. Also, Shigemura et al. have reported that P993S in mGluR1 was observed in almost all populations that were included in the HapMap project; they assumed that the mGluR1 variant may relate not only to individual differences but also to population differences in umami sensitivities.17 This variability could affect food choices, and might influence health status.18 The variation of umami taste perception is associated with SNPs in umami receptor gene. However, these SNPs have yet to be linked nutrient intake and nutrition-related chronic disease risk.
Therefore, the aim of this study was to investigate the
association between mGluR1 rs2814863 and the CVD risk factors in a population-based cohort study composed of Korean adults. We also examined whether mGluR1 rs2814863 interacts with dietary macronutrient intake to modulate the lipid profiles and risk of CVD.
MATERIALS AND METHODS
1. SubjectsOur study subjects were participants in the Anseong and Ansan Cohort Study, which is an ongoing investigation within the Korean Genome and Epidemiology Study (KoGES).19 The population was collected in two different communities in South Korea, the Ansan cohort repre- senting an urban community and Ansung cohort representing a rural community. The KoGES was performed to investigate the relationship between the genetic and environmental factors associated with metabolic diseases in Korean adults aged between 40-69 years old. Results from the large-scale genome-wide genotyping among 10,004 participants available for DNA and 8840 genotypes (4,182 men and 4,658 women) were made publicly available after cleaning. The records with extremely low or high energy intake (<500 or >4,000 kcal) were excluded (n=460). Finally, 8,380 subjects were included for the analysis. This study was approved by the Institutional Review Board of Ewha Womans University (85-4, December 2014), and the procedures followed were in accordance with the Helsinki Declaration of 1975, as revised in 2009.
2. General characteristics, anthropometric measurements, biochemical variables
The questionnaire included information on age, gender, smoking status (current smoker or non-current smoker), alcohol intake (g/d), and exercise (metabolic equivalent task hours/d). Height was measured with a stadiometer to the nearest 0.1 cm; and weight in light clothes with
no shoes was measured with a metric scale to the nearest 0.01 kg. BMI was calculated as weight (kg) / height2 (m2).
Waist circumference over the unclothed abdomen at a minimal diameter was measured by non-stretchable standard tape. Blood pressures were measured with subjects in a lying position after 5 min of rest. Blood samples were collected after >8 h of fasting, and plasma concentrations of total cholesterol, HDL-C, triglyceride, hemoglobin A1c (HbA1c), fasting glucose, fasting insulin were measured using biochemical assays performed by a central laboratory (Seoul Clinical Laboratories, Seoul, Republic of Korea). The homeostasis model assessment of insulin resistance (HOMA-IR) was calculated as fasting insulin (μIU/mL)×fasting glucose (mmol/L)/22.5.20 LDL-C levels were calculated by the following equations described by Friedewald for subjects with triglyceride concentrations <400 mg/dL:21 LDL-C= [Total cholesterol- {HDL-C-(Triglycerides/5)}]
3. Cardiovascular disease
CVD was defined as hypertension, myocardial infarction, coronary artery disease, and cerebrovascular diseases.
Disease histories were collected by using an interview- administered questionnaire on any previous diagnosis by a physician and taking agents for treatment.
4. Dietary measurements
Dietary intake was collected by trained interviewers using a semi-quantitative food frequency questionnaire (SQFFQ) that had been developed and validated for the KoGES.22,23 It consisted of questions on 103 food items over a period of 12 months, which were combined into the 23 nutrients used in the Korean food composition table,24 for the average daily dietary intake. The nutrient intakes were estimated by using a weighted frequency per day and a portion size per unit that was provided by KoGES.22
5. Genotyping and SNP selection
Genomic DNA samples were isolated from whole blood and genotyped on an Affymetrix Genome-Wide Human SNP array 5.0 (Affymetrix, Inc., Santa Clara, CA, USA).
Bayesian robust linear modeling using the Mahalanobis distance genotyping algorithm was used for genotype calling. The genotype calling and quality-control processes were as previously described.25 Six SNPs in and around mGluR1 were initially found from the KoGES and one SNP that deviated from Hardy–Weinberg equilibrium (p>0.05) were eliminated. Then, SNPs with minor allele frequencies below 0.10 were eliminated in the analysis.
Finally, mGluR1 rs2814863, which presented the significant associations with CVD-related phenotypes, was selected.
6. Statistical analysis
The mGluR1 rs2814863 polymorphism was in HWE (p>0.05) according to the chi-squared test. To determine the most appropriate model, we tested different genetic models (dominant, recessive, and additive). A dominant model was a better fit for rs2814863 concerning the CVD traits, thus we combined heterozygous with homozygous for the minor allele. Data was expressed as the mean±SEM (standard error of mean) for continuous variables and as percentages for categorical variables. Continuous variables were examined for normal distribution, and logarithmic transformations were applied to BMI, alcohol intake, total cholesterol, HDL-C, triglycerides, HbA1c, fasting glucose, fasting insulin, HOMA-IR, and protein intake. Data for those variables are presented as untransformed median (interquartile range). We used independent t-test or chi-square test to compare differences between male and female participants. The effect of mGluR1 rs2814863 on traits was analyzed with generalized linear models, and age and gender were considered as covariates to prevent their confounding
Table 1. General characteristics of study subjects
ㅤ Male
(n=3,993)
Female (n=4,387)
Age (years) 51.6±0.1† 52.6±0.2
Height (cm) 167.0±0.1† 153.8±0.1
Weight (kg) 67.8±0.2† 59.0±0.1
Waist circumstance (cm) 83.7±0.1† 81.6±0.2
BMI (kg/m2) 24.3±0.1† 24.9±0.1
Blood pressure (mm Hg)
Systolic 117.1±0.3 117.2±0.3
Diastolic 76.1±0.2† 73.8±0.2
Alcohol intake (g/d) 26.7±0.6† 5.3±0.3
Exercise (MET-h/d) 4.0±0.1† 3.3±0.1
Current smokers (%) 49.3† 3.5
High school education (%) 58.7† 32.0
Total cholesterol (mg/dL) 198.6±0.6 199.5±0.6
HDL-C (mg/dL) 47.7±0.2† 50.9±0.2
LDL-C (mg/dL) 118.9±0.6* 121.6±0.5
Triglycerides (mg/dL) 171.0±2.0† 138.1±1.4
HbA1c (%) 5.8±0.02 5.8±0.01
Fasting glucose (mg/dL) 95.2±0.4† 90.6±0.3
Fasting insulin (μIU/mL) 7.1±0.1† 8.0±0.1
HOMA-IR (arbitrary units) 1.7±0.02† 1.8±0.02
Dietary intake
Energy intake (kcal) 1992.3±8.6† 1830.9±8.5
Protein (% of energy) 13.6±0.04† 13.3±0.04
Fat (% of energy) 15.4±0.1† 13.4±0.1
Carbohydrate (% of energy) 69.8±0.1† 72.4±0.1
mGluR1 rs2814863 T>C (MAF/HWE) 0.37 / 0.94 0.38 / 0.44
BMI; body mass index, MET; metabolic equivalent task, HDL-C; high density lipoprotein cholesterol, LDL-C; low density lipoprotein cholesterol, HbA1c; Hemoglobin A1c, HOMA-IR; homeostasis model assessment of insulin resistance, MAF; Minor allele frequency, HWE; Hardy-Weinberg equilibrium.
The data represent the means±SEM and p values obtained in the independent t-test or chi-square test for differences between male and female participants (*p<0.001, †p<0.0001).
Fasting glucose, Fasting insulin, HOMA-IR were measured in 3,891 male and 4,251 female participants.
If triglycerides were <400 mg/dL, LDL-C=[Total cholesterol−{HDL-C+(triglyceride/5)}], and LDL-C was measured in 3,823 male and 4,309 female participants.
effect. HDL-C and triglyceride were dichotomized (based on less than and equal or greater than median); and the interaction between the rs2814863 and dietary macro- nutrient intake was detected with the logistic regression.
Age and gender were also considered as covariates in our logistic regression. Also, the association between mGluR1 rs2814863 polymorphism and risk of CVD were examined using logistic regression. Odds ratios (ORs) of CVD risk and 95% CIs were estimated. To address the possibility of multiple comparisons, we calculated the false-discovery rate (FDR) by using the method of
Benjamini and Hochberg for each p value of <0.05.26 The FDR is the expected proportion of false positive results among all significant hypotheses. All statistical analyses were performed with SAS v9.3 (SAS Institute Inc., Cary, NC, USA); and a p value of 0.05 was considered to be statistically significant.
RESULTS
Subject’s characteristics classified by gender were listed in Table 1. Significant differences in age, height, weight,
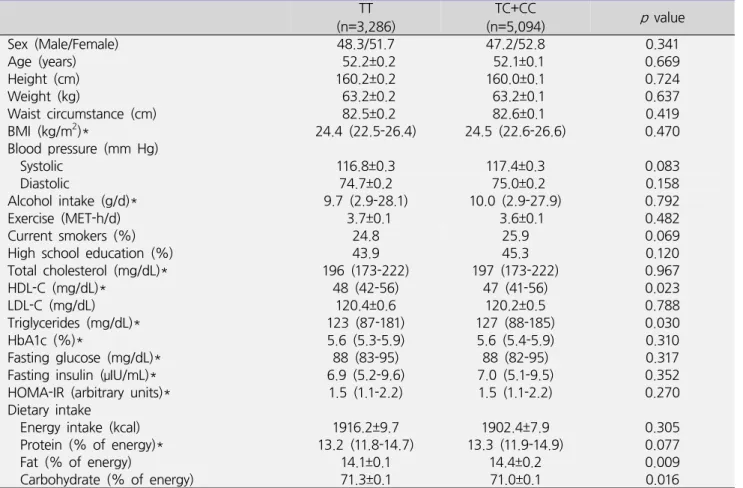
Table 2. Comparison of characteristics according to mGluR1 rs2814863 genotype
ㅤ TT
(n=3,286) TC+CC
(n=5,094) p value
Sex (Male/Female) 48.3/51.7 47.2/52.8 0.341
Age (years) 52.2±0.2 52.1±0.1 0.669
Height (cm) 160.2±0.2 160.0±0.1 0.724
Weight (kg) 63.2±0.2 63.2±0.1 0.637
Waist circumstance (cm) 82.5±0.2 82.6±0.1 0.419
BMI (kg/m2)* 24.4 (22.5-26.4) 24.5 (22.6-26.6) 0.470
Blood pressure (mm Hg)
Systolic 116.8±0.3 117.4±0.3 0.083
Diastolic 74.7±0.2 75.0±0.2 0.158
Alcohol intake (g/d)* 9.7 (2.9-28.1) 10.0 (2.9-27.9) 0.792
Exercise (MET-h/d) 3.7±0.1 3.6±0.1 0.482
Current smokers (%) 24.8 25.9 0.069
High school education (%) 43.9 45.3 0.120
Total cholesterol (mg/dL)* 196 (173-222) 197 (173-222) 0.967
HDL-C (mg/dL)* 48 (42-56) 47 (41-56) 0.023
LDL-C (mg/dL) 120.4±0.6 120.2±0.5 0.788
Triglycerides (mg/dL)* 123 (87-181) 127 (88-185) 0.030
HbA1c (%)* 5.6 (5.3-5.9) 5.6 (5.4-5.9) 0.310
Fasting glucose (mg/dL)* 88 (83-95) 88 (82-95) 0.317
Fasting insulin (μIU/mL)* 6.9 (5.2-9.6) 7.0 (5.1-9.5) 0.352
HOMA-IR (arbitrary units)* 1.5 (1.1-2.2) 1.5 (1.1-2.2) 0.270
Dietary intake
Energy intake (kcal) 1916.2±9.7 1902.4±7.9 0.305
Protein (% of energy)* 13.2 (11.8-14.7) 13.3 (11.9-14.9) 0.077
Fat (% of energy) 14.1±0.1 14.4±0.2 0.009
Carbohydrate (% of energy) 71.3±0.1 71.0±0.1 0.016
BMI; body mass index, MET; metabolic equivalent task, HDL-C; high density lipoprotein cholesterol, LDL-C; low density lipoprotein cholesterol, HbA1c; Hemoglobin A1c, HOMA-IR; homeostasis model assessment of insulin resistance The data represent the means±SEM and p values obtained in the generalized linear model (GLM), with adjustment for age and gender.
Fasting glucose, Fasting insulin, HOMA-IR were measured in 3,891 male and 4,251 female participants.
If triglycerides were <400 mg/dl, LDL-C=[Total cholesterol−{HDL-C+(triglyceride/5)}], and LDL-C was measured in 3,202 individuals with the AA genotype and 4,940 with the AG+GG genotype.
*Values are median (interquartile range).
waist circumstance, BMI, diastolic blood pressure, alcohol intake, exercise, smoke status were observed between male and female participants. The plasma levels of HDL-C, LDL-C, fasting insulin, and HOMA-IR were lower in male than in female, but triglyceride and fasting glucose were higher in male than in female. The intake of dietary energy, protein, and fat was higher in male than in female, but dietary carbohydrate intake was lower in male than in female. The MAF of mGluR1 rs2814863 was 0.37 in male and 0.38 in female participants. The genotype distri- butions did not deviate from Hardy-Weinberg equilibrium
(p>0.05). No significant interaction between mGluR1 rs2814863 genotype and gender for the main outcomes was observed; in addition, we carried out gender-adjusted analysis in all subjects combined.
The characteristics of subjects according to rs2814863 genotype were compared in Table 2. Carriers of the C allele had lower HDL-C and higher triglyceride levels as compared with carriers of TT, after adjustment for age and gender (p=0.023, p=0.030). Also, carriers of the C allele had higher fat intake and lower carbohydrate intake than those with carriers of TT (p=0.009, p=0.016). The
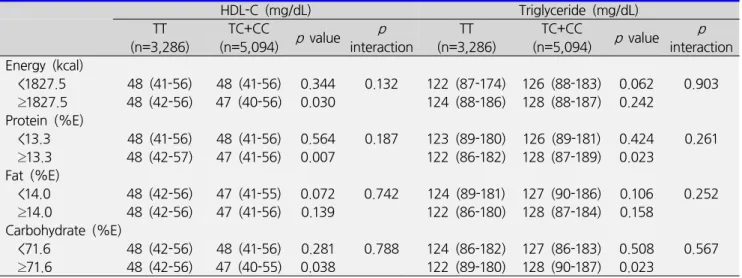
Table 3. Interaction between mGluR1 rs2814863 genotype and dietary intake on lipid profiles
HDL-C (mg/dL) Triglyceride (mg/dL)
TT
(n=3,286) TC+CC
(n=5,094) p value p
interaction TT
(n=3,286) TC+CC
(n=5,094) p value p interaction Energy (kcal)
<1827.5 48 (41-56) 48 (41-56) 0.344 0.132 122 (87-174) 126 (88-183) 0.062 0.903 ≥1827.5 48 (42-56) 47 (40-56) 0.030 124 (88-186) 128 (88-187) 0.242
Protein (%E)
<13.3 48 (41-56) 48 (41-56) 0.564 0.187 123 (89-180) 126 (89-181) 0.424 0.261 ≥13.3 48 (42-57) 47 (41-56) 0.007 122 (86-182) 128 (87-189) 0.023
Fat (%E)
<14.0 48 (42-56) 47 (41-55) 0.072 0.742 124 (89-181) 127 (90-186) 0.106 0.252 ≥14.0 48 (42-56) 47 (41-56) 0.139 122 (86-180) 128 (87-184) 0.158
Carbohydrate (%E)
<71.6 48 (42-56) 48 (41-56) 0.281 0.788 124 (86-182) 127 (86-183) 0.508 0.567 ≥71.6 48 (42-56) 47 (40-55) 0.038 122 (89-180) 128 (90-187) 0.023
HDL-C; high density lipoprotein cholesterol, LDL-C; low density lipoprotein cholesterol
The participants were categorized by total energy intake and the percentage of energy they obtained from their median levels of protein, fat, and carbohydrate.
The data represent the median (interquartile range) and p values obtained in the generalized linear model (GLM), p interactions obtained in logistic regression model after adjustment for age and gender.
difference in protein intake between genotypes showed no significant value (p=0.063). After adjustment for multiple testing using FDR method, the significant difference of HDL-C (FDR=0.158), triglyceride (FDR=
0.158), dietary fat (FDR=0.158), and carbohydrate (FDR=0.158) across genotypes disappeared.
We determined whether interaction between rs2814863 genotype and dietary macronutrient intake affected the levels of HDL-C and triglyceride, which were associated with rs2814863 genotype in dominant model (Table 3). We dichotomized total energy intake (1827.5 kcal) and the percentage of intakes for protein (13.3%), fat (14.0%) and carbohydrate (71.6%) according to their respective medians. Carriers of the C allele showed a lower HDL-C only in participants who consumed high levels of energy (TT 48 [42-56] mg/dL vs. TC+CC 47 [40-56] mg/dL, p=0.030), protein (TT 48 [42-57] mg/dL vs. TC+CC 47 [41-56] mg/dL, p=0.007), and carbohydrate (TT 48 [42-56] mg/dL vs. TC+CC 47 [40-55] mg/dL, p=0.038) than carriers of TT, whereas those were not significantly different genotypes in participants with low intake of
energy (p=0.344), protein (p=0.564), and carbohydrate (p=0.281). After correction of multiple testing, carriers of the C allele did not have significantly lower HDL-C in the group of high levels of energy (FDR=0.101), protein (FDR=0.055), and carbohydrate (FDR=0.101).
Also, carriers of the C allele showed a higher level of triglyceride than carriers of TT among participants with high levels of protein (TT 122 [86-182] mg/dL vs. TC+CC 128 [87-189] mg/dL, p=0.023) and carbohydrate intake (TT 122 [89-180] mg/dL vs. TC+CC 128 [90-187] mg/dL, p=0.023). However, carriers of the C allele did not show significantly higher triglyceride in the group of high levels of protein (FDR=0.092) and carbohydrate (FDR=0.092), after adjustment for multiple testing. After adjustment for age and gender, statistically significant interactions were not observed between rs2814863 and intake of energy, protein, and carbohydrate in relation to HDL-C and triglyceride.
We then analyzed the effects of the rs2814863 genotype on the odds of CVD after adjustment of age, gender, and dietary fat intake (Table 4). Carriers of the C allele
Table 4. Association between mGluR1 rs2814863 genotype and cardiovascular disease TT
(n=3,286)
TC+CC
(n=5,094) p value
Hypertension 1.0 1.11 (1.00-1.23) 0.047
Myocardial infarction 1.0 1.17 (0.72-1.90) 0.531
Coronary artery disease 1.0 1.43 (0.86-2.37) 0.171
Congestive heart failure 1.0 0.89 (0.59-1.34) 0.582
Cardiovascular disease 1.0 1.13 (1.02-1.25) 0.020
The data are represented the as odds ratio (95% confidence interval) and p values obtained in logistic regression model, after adjustment for age, gender, and dietary fat intake.
had higher odds of hypertension as compared with carriers of TT (OR=1.11, 95% CI=1.00-1.23, p=0.047). The odds of CVD was significantly higher in subjects who carriers of the C allele than those who carriers of TT (OR=1.13, 95% CI=1.02-1.25, p=0.020). There were no significant difference in the odds of myocardial infarction (p=0.531), coronary artery disease (p=0.171), and cerebrovascular diseases (p=0.582) between two groups.
DISCUSSION
The mGluR1 rs2814863 is a T/C single-nucleotide variation in the intron region on human chromosome 6.
The MAF for the rs2814863 was 37-38% in the present study. This MAF is similar to those in other Asian (China:
30.6%, Japanese: 40.9%) and an African-American (32.0%) population, obtained from the 1000 Genomes Project.
Our results indicated that carriers of the C allele of rs2814863 showed lower HDL-C and higher triglyceride levels as compared with carriers of TT. Also, carriers of the C allele had higher fat intake than those with carriers of TT. Previous study has shown that mGluR1 gene polymorphisms partly account for the inter-individual variance of umami taste perception.16,17 In addition, umami taste perception is related to nutrient intake and health outcome. One report showed that a greater sensitivity for monosodium glutamate was associated with a greater protein liking in healthy adults.27 Donaldson et al. reported
that a heightened umami perception may relate to an increased body weight,14 whereas Pepino et al. reported that obese women have a significantly higher mono- sodium glutamate detection threshold, and prefer a higher concentration of monosodium glutamate than women with normal weight.15 Although mixed results have been reported, these findings suggested that umami taste perception is determined genetically and leads to diffe- rential preferences for certain types of diet that affect the health status. Individuals with an increased taste perception could have a lower taste preference than less sensitive individuals. Therefore, in subject with mGluR1 variant, the attenuated taste perception may contribute to increased fat intake and elevated plasma lipid level.
The interactions between mGluR1 rs2814863 genotype and dietary macronutrient intake were not observed in relation to the plasma lipid profiles in this study. On the other hand, recent studies have reported that interactions between genetic variations and dietary nutrient intake modify CVD risk.28,29 In the Framingham Heart Study, APOA5 (Apolipoprotein A5) gene, a major locus involved in triglyceride metabolism, variant displayed increased fasting triglyceride and decreased LDL size in subjects consuming a high-PUFA diet alone.28 Also, Moreno et al. demonstrated that as compared to a high-carbohydrate diet, a Mediterranean-style, MUFA-rich diet increased LDL size in individuals with certain APOE (Apolipoprotein E) gene variants but decreased LDL size in those with other APOE variants.29 Individuals with certain gene variants may
experience changes in lipid concentrations when placed on a particular diet, whereas individuals with other gene variants may be resistant to the effects of that diet. In this study, the significant gene-dietary intake interactions on lipid profiles and CVD in genotypes of rs2814863 were not observed. Further study on the interaction between mGluR1 gene polymorphisms and dietary intake on CVD-related variables is required to further support these findings.
We analyzed the odds of CVD depending on the genotypes of rs2814863, and there were significantly higher odds of CVD in subjects who carriers of the C allele. There are few studies about association between umami taste receptor, such as mGluRs, polymorphisms and nutrition-related chronic disease risk to our know- ledge. Change in taste perception due to taste receptor gene polymorphism, may alter dietary habits and thus affect nutritional status and nutrition-related chronic disease risk. In this study, we didn’t found a significant interaction between the rs2814863 genotype and dietary intake on lipid profiles. However, subject with rs2814863 variant had significantly higher risk of CVD.
The present study had several limitations. First, since the association between genetic variant and CVD risk was analyzed with a cross-sectional study design, it was not possible to establish a cause-effect relation. Second, we were able to measure the dietary intake by SQFFQ, which may reflect inaccurate measures of real consumption amounts. Although trained interviewers used a validated SQFFQ with pictures of portion sizes, measurement errors in dietary intake data are unavoidable and could weaken the real associations. Despite these limitations, this is the first study, to our best knowledge, to show that umami receptor gene polymorphism may modulate the risk of CVD.
In conclusion, our findings add to the current know- ledge regarding associations of the mGluR1 rs2814863 genotype with plasma HDL-C and triglyceride levels, as
well as dietary fat and carbohydrate intake in Korean adults. These associations were no longer significant after adjustment for multiple testing. mGluR1 rs2814863 didn’t interact with macronutrient intake to modulate the lipid profiles and CVD. However, the odds of CVD was affected by rs2814863 genotype. Although these results need replication and mechanistic studies, they support the concept of personalized approaches in CVD prevention.
ACKNOWLEDGEMENTS
This study was provided with bioresources from National Biobank of Korea, the Center for Disease Control and Prevention, Republic of Korea (4845-301, 4851-302 and -307), and supported by the National Research Foundation of Korea (NRF), funded by the BK 21 plus (No.
22A20130012143).
REFERENCES
1. GBD 2013 Mortality and Causes of Death Collaborators.
Global, regional, and national age-sex specific all-cause and cause-specific mortality for 240 causes of death, 1990–2013: a systematic analysis for the Global Burden of Disease Study 2013. Lancet 2015;385:117-171.
2. Verschuren WM, Jacobs DR, Bloemberg BP, Kromhout D, Menotti A, Aravanis C, et al. Serum total cholesterol and long-term coronary heart disease mortality in different cultures. Twenty-five-year follow-up of the seven countries study. JAMA 1995;274:131-136.
3. Krauss RM. Triglycerides and atherogenic lipoproteins:
rationale for lipid management. Am J Med 1998;105:
58S-62S.
4. Forrester JS. Triglycerides: risk factor or fellow traveler?
Curr Opin Cardiol 2001;16:261-264.
5. Malloy MJ, Kane JP. A risk factor for atherosclerosis:
triglyceride-rich lipoproteins. Adv Intern Med 2001;47:
111-136.
6. Varady KA, Jones PJ. Combination diet and exercise interventions for the treatment of dyslipidemia: an effective preliminary strategy to lower cholesterol levels?
J Nutr 2005;135:1829-1835.
7. Vogel JH, Bolling SF, Costello RB, Guarneri EM, Krucoff MW, Longhurst JC, et al. Integrating complementary medicine into cardiovascular medicine. A report of the american college of cardiology foundation task force on clinical expert consensus documents (writing committee to develop an expert consensus document on comple- mentary and integrative medicine). J Am Coll Cardiol 2005;46:184-221.
8. Hegsted DM, Ausman LM. Diet, alcohol and coronary heart disease in men. J Nutr 1988;118:1184-1189.
9. Artaud-Wild SM, Connor SL, Sexton G, Connor WE.
Differences in coronary mortality can be explained by differences in cholesterol and saturated fat intakes in 40 countries but not in France and Finland. A paradox.
Circulation 1993;88:2771-2779.
10. Acheson KJ. Carbohydrate for weight and metabolic control: where do we stand? Nutrition 2010;26:141-145.
11. Lee YC, Lai CQ, Ordovas JM, Parnell LD. A database of gene-environment interactions pertaining to blood lipid traits, cardiovascular disease and type 2 diabetes. J Data Mining Genomics Proteomics 2011;2:106.
12. Ordovas JM. Nutrigenetics, plasma lipids, and cardio- vascular risk. J Am Diet Assoc 2006;106:1074-1081.
13. Zhang F, Klebansky B, Fine RM, Xu H, Pronin A, Liu H, et al. Molecular mechanism for the umami taste synergism. Proc Natl Acad Sci U S A 2008;105:20930- 20934.
14. Donaldson LF, Bennett L, Baic S, Melichar JK. Taste and weight: is there a link? Am J Clin Nutr 2009;90:800S- 803S.
15. Pepino MY, Finkbeiner S, Beauchamp GK, Mennella JA.
Obese women have lower monosodium glutamate taste sensitivity and prefer higher concentrations than do normal-weight women. Obesity (Silver Spring) 2010;18:
959-965.
16. Raliou M, Wiencis A, Pillias AM, Planchais A, Eloit C, Boucher Y, et al. Nonsynonymous single nucleotide polymorphisms in human tas1r1, tas1r3, and mGluR1 and individual taste sensitivity to glutamate. Am J Clin Nutr 2009;90:789S-799S.
17. Shigemura N, Shirosaki S, Ohkuri T, Sanematsu K, Islam AA, Ogiwara Y, et al. Variation in umami perception and in candidate genes for the umami receptor in mice and
humans. Am J Clin Nutr 2009;90:764S-769S.
18. Garcia-Bailo B, Toguri C, Eny KM, El-Sohemy A. Genetic variation in taste and its influence on food selection.
OMICS 2009;13:69-80.
19. Lim S, Jang HC, Lee HK, Kimm KC, Park C, Cho NH. A rural-urban comparison of the characteristics of the metabolic syndrome by gender in Korea: the Korean Health and Genome Study (KHGS). J Endocrinol Invest 2006;29:313-319.
20. Matthews DR, Hosker JP, Rudenski AS, Naylor BA, Treacher DF, Turner RC. Homeostasis model assessment:
insulin resistance and β-cell function from fasting plasma glucose and insulin concentrations in man. Diabetologia 1985;28:412-419.
21. Friedewald WT, Levy RI, Fredrickson DS. Estimation of the concentration of low-density lipoprotein cholesterol in plasma, without use of the preparative ultracentri- fuge. Clin Chem 1972;18:499-502.
22. Ahn Y, Lee JE, Paik HY, Lee HK, Jo I, Kimm K.
Development of a semi-quantitative food frequency questionnaire based on dietary data from the Korea National Health and Nutrition Examination Survey. Nutr Sci 2003;6:173-184.
23. Ahn Y, Lee JE, Cho NH, Shin C, Park C, Oh BS, et al.
Validation and calibration of semi-quantitative food frequency questionnaire: with participants of the Korean Health and Genome Study. Korean J Community Nutr 2004;9:173-182.
24. Korean Nutrition Society. Appendix III. Food composition and nutrition table. In: Korean Nutrition Society, editor.
Recommended dietary allowances for Koreans. 7th ed.
Seoul: Korean Nutrition Society; 2000. p.259-464.
25. Cho YS, Go MJ, Kim YJ, Heo JY, Oh JH, Ban HJ, et al.
A large-scale genome-wide association study of Asian populations uncovers genetic factors influencing eight quantitative traits. Nat Genet 2009;41:527-534.
26. Benjamini Y, Hochberg Y. Controlling the false discovery rate: a practical and powerful approach to multiple testing. J R Stat Soc B 1995;57:289-300.
27. Luscombe-Marsh ND, Smeets AJ, Westerterp-Plantenga MS. Taste sensitivity for monosodium glutamate and an increased liking of dietary protein. Br J Nutr 2008;99:
904-908.
28. Lai CQ, Corella D, Demissie S, Cupples LA, Adiconis X,
Zhu Y, et al. Dietary intake of n-6 fatty acids modulates effect of apolipoprotein A5 gene on plasma fasting triglycerides, remnant lipoprotein concentrations, and lipoprotein particle size: the Framingham Heart Study.
Circulation 2006;113:2062-2070.
29. Moreno JA, Pérez-Jiménez F, Marín C, Gómez P, Pérez-Martínez P, Moreno R, et al. The effect of dietary fat on LDL size is influenced by apolipoprotein E genotype in healthy subjects. J Nutr 2004;134:2517- 2522.