Printed in the Republic of Korea DOI 10.5012/jkcs.2010.54.01.125
요약. 본 연구에서는 수용액 중에서 유해한 brilliant green (BG) 제거를 위한 탄소와 산화철 나노복합재료의 흡착특성을 살펴 보았다. 탄소와 산화철 나노복합재료는 화학침전법과 750 oC에서 질산 철과 탄소를 열처리 함으로서 합성하였다. 그 생성물 은 TEM, XRD, 그리고 TGA를 이용하여 확인하였다. 나노복합재료에 대한 BG의 흡착 연구는 열역학적 인자와 반응속도론적 인자들을 이용하여 수행하였다. 흡착 속도식은 준 이차 속도식이 준 일차 속도식에 비해 잘 들어맞는다고 보여준다. 실험 결 과는 Langmuir 과 Freundlich 흡착 등온선을 이용하여 분석하였다. 평형 데이터는 Langmuir모델에 잘 들어맞으며 최대 단일 층 흡착 용량 64.1 mg/g 을 갖는다. 열역학적 인자들은 나노복합재료에 BG의 흡착 으로부터 유도하며 흡착은 자발적이며 흡 열 과정임을 확인하였다.
주제어: 나노복합재료, 흡착, 열열학, 반응속도론, 탈착
ABSTRACT. In the present work, we have investigated the adsorption efficiency of carbon/iron oxide nanocomposite towards removal of hazardous brilliant green (BG) from aqueous solutions. Carbon/iron oxide nanocomposite was prepared by chemical precipitation and thermal treatment of carbon with ferric nitrate at 750 oC. The resulting material was thoroughly characterized by TEM, XRD and TGA. The adsorption studies of BG onto nanocomposite were performed using kinetic and thermodynamic parameters. The adsorption kinetics shows that pseudo-second-order rate equation was fitted better than pseudo-first-order rate equation. The experimental data were analyzed by the Langmuir and Freundlich adsorption isotherms. Equilibrium data was fitted well to the Langmuir model with maximum monolayer adsorption capacity of 64.1 mg/g. The thermodynamic parameters were also deduced for the adsorption of BG onto nanocomposite and the adsorption was found to be spontaneous and endothermic.
Keywords: Nanocomposite, Adsorption, Kinetic, Thermodynamic, Desorption
탄소/산화철 나노복합재료의 Brilliant Green 흡착에 대한 반응속도론적, 열역학적 연구
Rais Ahmad* and Rajeev Kumar
Environmental Research Laboratory, Department of Applied Chemistry, Aligarh Muslim University, Aligarh, 202002, India (접수 2009. 10. 5; 수정 2009. 12. 2; 게재확정 2009. 12. 29)
Kinetic and Thermodynamic Studies of Brilliant Green Adsorption onto Carbon/Iron Oxide Nanocomposite
Rais Ahmad* and Rajeev Kumar
Environmental Research Laboratory, Department of Applied Chemistry, Aligarh Muslim University, Aligarh, 202002, India (Received October 5, 2009; Revised December 2, 2009; Accepted December 29, 2009)
INTRODUCTION
Textile industries are using large amount of water and organic chemicals for coloring. Discharging of dyes into water stream even in small amount can affect the aquatic life.1 The adsorption technique is an effective and attractive process for the treatment of dye-bearing wastewaters. In the literature, clays, zeolites, chitin, bentonite, montmorillonite, fly ash, coconut husk, rice husk, bagasses, apple pomace, sulfonated coal etc. were used for the adsorption studies. Increasing use of dyes endangering the environment, encourage the search for low cost and better effi- cient materials to remove color contaminant from waste water.
The use of nanomaterials as an adsorbent is a new field of interest. Their basic properties like extremely small size and high surface area provide better binding sites for the adsorption of
dyes. More recently, magnetic materials have been employed for the water purification due to easy control and fast separa- tion.2-3 It is well known that iron oxides are strong adsorbents for the removal of pollutants such as arsenate, chromates, phos- phates, pesticides and humic acids etc.4 The high adsorption capacity of the iron oxides arise from the hydroxyl groups interaction with the dyes molecules.5
In this work, magnetic nanocomposite of carbon/iron oxide was prepared by simple method and their adsorptive charac- teristic for the removal of brilliant green from aqueous solution was studied. The adsorption studies such as effect of contact time, initial dye concentration, pH and temperature were explor- ed in batch experiments and thermodynamic, kinetic and adsorp- tion isotherm analysis were used to elucidate the adsorption mechanism.
46-59 nm
Fig. 1. TEM image of carbon/iron oxide nanocomposite at 18 K.
5 25 45 65
2 Theta (degree)
3000
2500
2000
1500
1000
500
0
Intensity
Fig. 2. XRD pattern of carbon/iron oxide nanocomposite.
EXPERIMENTAL Adsorbate
Brilliant green dye (M.F. = C27H34N2O4S, C.I. = 42040, FW = 462.65, λmax = 625 nm), supplied by CDH New Delhi, India was used as an adsorbate. BG molecules exists as cation in aqueous medium.
Preparation of carbon/iron oxide nanocomposite
Carbon was prepared from ginger (Zingiber officinale) waste rhizome in muffle furnace at 600 oC. Carbon was then exten- sively washed with double distilled water and dried at 450 oC.
The composite was prepared from a suspension of carbon (5 gm) in 15 mL aqueous solution of ferric nitrate (5 gm) and NaOH (10 mL of 10 M) was then added drop wise to precipitate the iron oxide. The precipitated material was agitated at 30 oC for 6 h, filtered and calcined at 750 oC for 1 h. The resulting material was then thoroughly washed with double distilled water, dried at 60 oC and used as such for adsorption studies.
Characterization
The morphology of nanocomposite was obtained using trans- mission electron microscopy (Philips TEM 420). Thermograva- metric analysis was performed by (DTG-60H, Shimadzu) in the presence of nitrogen at the flow rate 30 mL min-1. The crystal structure of the particles was characterized by Philips X'Pert PRO X-ray diffraction system.
Adsorption and desorption studies
Adsorption studies of carbon/iron oxide nanocomposite were performed in batch for the removal of BG from aqueous solu- tion. For kinetic study, 20 mL of dye solution of known con- centration was poured into 100 mL flask with a fixed amount (0.02 g) of nanocomposite and was shaken at different time intervals. To obtain the equilibrium isotherms, initial concent- ration of BG was varied from 10 - 50 mg/L while keeping the adsorbents dose (0.02 g), pH (6.2) and contact time constant.
The effect of initial pH on BG adsorption was investigated by varying the initial pH of the dye solution from 5.0 - 9.0 because of the fact that below the pH 5.0 iron oxide starts getting di- ssolve in the acidic solution6 and above pH 9.0, BG shows color change. The initial pH values of the solution were adjusted with diluted HCl and NaOH. The amount left in solution after adsorption was determined by the UV-visible (Elico SL-164 model) double bean spectrophotometer at 625 nm. The extent of dye removal was calculated as follows
qe = (Ci – Cf)V/m (1)
where qe is the adsorption capacity (mg g-1), Ci and Cf are the initial and final concentrations (mg l-1) of dye in the solution,
m is the mass of adsorbent (g) and V is the volume of solution (l).
Desorption of BG was studied by placing 0.02 g dye saturated adsorbent into 20 mL acetic acid (0.1 and 1 M) for 3 hrs contact time and the amount of dye desorbed was analyses spectrophoto- metrically.
RESULT AND DISCUSSION Characterization
The morphology of nanocomposite was characterized by TEM. Fig. 1 shows that the particles are spherical in shape and size varies from 46 - 59 nm.
Fig. 2 illustrate the X-ray diffractogram of nanocomposite in the 2θ range of 5 - 80o. Six narrow peaks at 2θ values of 29.40, 31.90, 38.90, 42.5, 47.90 and 48.38 indicate that nano- composite is crystalline in nature. The crystallite sizes were calculated using the Scherrer’s equation:
D = k λ/β cos θ (2)
where k is a constant ~0.9, λ is the wavelength of X-rays, β is the full width of diffraction peak at half maximum intensity and θ is the Bragg’s angle. The calculated crystallite sizes were
0.00 500.00 1000.00
Temp (C)
TGAmg
10.00
8.00
6.00
4.00
2.00
Fig. 3. TGA curve of carbon/iron oxide nanocomposite.
4 6 8 10
pH
50 45 40 35 30 25 20 15 10 5 0
qe (mg/g)
Fig. 4. Effect of initial solution pH on BG adsorption (dye conc.: 20 mg/L, adsorbent dose: 0.02 g, temp.: 30 oC).
found to be in the range of 10.2 - 15.9 nm. The crystallinity of the composite was originated due to the iron oxide because it is well know that carbon is amorphous in nature.
TEM showed the larger particle size than XRD. This may be due to the fact that the particle size given by XRD corres- ponds to the average of the smallest undistorted regions in the nanocomposite, whereas TEM counting is related to regions separated by more-or-less sharp contours in the TEM micro- graph. Therefore, when dislocations are arranged in a confi- guration, which causes small orientation differences between two adjacent regions, the XRD size corresponds to the two sepa- rate regions, whereas in the TEM micrograph the two regions may seem to correspond to the same particle.7-8
Fig. 3 shows the thermogravametric analysis of the carbon/
iron oxide nanocomposite. The first weight loss is due to the moisture while the second weight loss is related to the oxidation of carbon. As the thermo analysis temperature increase, the Fe atom oxidizes.9
FeOx + y CO2 → FeOx+y + (x+y) CO2 + z CO2
The approximate amount of iron oxide in the composites was calculated by subtracting the residual weight of the blank carbon from residual weight of composite at 1120 oC. It was observed that the estimated weight percent of iron oxide is 31%.
Effect of initial solution pH
Adsorption of BG onto nanocomposite was influenced by pH of the solution. The results as depicted in Fig. 4 shows that dye removal increases with increasing initial pH of the dye solution and maximum removal was found to be at pH 9.0. The adsorption mechanism under the influence of initial solution pH may be explained with respect to the carbon and iron oxide.
The most abundant surface functional group participating in the adsorption on adsorbent is the hydroxyl group, which is amphoteric and reactive.3 The hydroxyl group may undergo deprotonation in basic condition and get negative charge, which make the adsorption favorable due to electrostatic interaction between cationic BG dye (BG+) and anionic iron oxide. There- fore, the following reactions were expected to occur at the iron oxide/liquid interface in basic medium:
FeOH → FeO‒ + H+ FeO‒ + BG+ → (FeO)BG
and the adsorption onto carbon probably due to the presence of excess OH− groups on the adsorbent surface, which enhance the electrostatic interaction between cationic dye and negati- vely charged adsorbent surface. Therefore, C-OH‒ + BG+ → (C-OH)BG, reaction was expected to occur at the carbon/liquid interface in basic medium.
Effect of contact time and kinetics
Adsorption of BG increases with increase in contact time (Fig. 5) and reaches the equilibrium within 120 min, indicating high affinity of dye molecules for nanocomposite. The rate of BG removal was very rapid initially (exterior surface). After that dye molecules entered into the pores of nanocomposite and were adsorbed by the interior surface, which takes relatively long time.10
Lagergren pseudo-first11 and Ho’s pseudo-second-order rate12 equations were used to describe the BG adsorption kinetics.
Pseudo-first and pseudo-second-order rate equations are pre- sented in equations (3) and (4), respectively
log (qe-qt) = loq qe ‒ k1 t/2.303 (3)
t/qt = 1/k2 qe2 + t/qe (4)
where qe and qt are the amount of dye adsorbed (mg g-1) at
0 50 100 150 200
Time (min)
40 35 30
25
20 15
10 5 0
qe (mg/g)
Fig. 5. Effect of contact time on BG adsorption (dye concentration- 20 mg/L, adsorbent dose- 0.02 g, temp.- 30 oC).
y = -0.0359x - 0.2226 R2 = 0.9345
0 20 40 60 80 100
Time (min)
0
-0.5
-1 -1.5
-2
-2.5
-3
-3.5 -4
ln (1-F)
Fig. 6. Time vs ln (1-F) graph for BG adsorption.
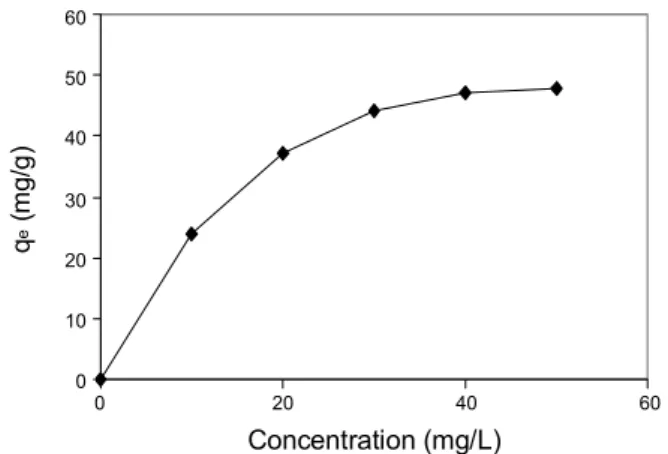
0 20 40 60
Concentration (mg/L)
60
50
40
30
20
10
0
qe (mg/g)
Fig. 7. Effect of BG concentration on its adsorption (adsorbent dose:
0.02 g, pH: 5.6, temp.: 30 oC).
equilibrium and at time t (min). k1 and k2 are the pseudo-first and pseudo-second-order rate constants, respectively. The qe, k1 and k2 values could be determined from the slope and inter- cept of their respective plots of log (qe-qt) vs t and t/qt vs t.
Linear equations of pseudo-first and pseudo-second-order rate kinetics, based on experimental data in Fig. 5 were pre- sented as:
log (qe-qt) = 1.397 ‒ 0.0133 t, R2 = 0.8055 (5) t/qt = 0.363 + 0.024 t, R2 = 0.9948 (6) The high value of correlation coefficient for pseudo-second- order equation shows that adsorption of BG is following pseudo- second-order kinetic model.
In order to identify the rate of adsorption process and ascer- taining that whether the on-going process is particle diffusion or film diffusion, the applicability of film diffusion model was studied.
ln (1- F) = ‒Kft (7)
where F is the fraction attainment of equilibrium. Kf is the film diffusion rate constant (min-1). To find the actual process in- volved, time vs ln (1-F) was plotted (Fig. 6), and a straight line deviating from origin was obtained, which suggests the film diffusion as rate determining step.13
Effect of dye concentration
The influence of BG concentration on dye adsorption was presented in Fig. 7. When the BG concentration was increased from 10 to 50 mg/L, dye adsorption onto carbon/iron oxide increased from 24 to 48 mg/g.
The adsorption isotherm describes how adsorbate molecules interact with adsorbents when the adsorption process approa- ches to an equilibrium state. Equilibrium adsorption isotherm data were analyzed according to Langmuir and Freundlich models. The linear Langmuir and Freundlich equation were, respectively, described as:
Ce/qe = Ce/Qe + 1/b Qe (8)
log qe = log Kf + 1/n log Ce (9) where Ce is the equilibrium concentration of the dye solution (mg l-1), qe is the amount of dye adsorbed at equilibrium (mg g-1), Qe is the calculated maximum monolayer adsorption capa- city (mg g-1) and b is Langmuir constant. Kf and n are Freund- lich constants indicating adsorption capacity and intensity, res- pectively. The values of Langmuir and Freundlich parameters were calculated from the slope and intercept of linear plots of Ce/qe vs Ce and log qe vs log Ce, respectively.
Langmuir and Freundlich equations based on the experi- mental data in Fig. 7, can be presented as:
Ce/qe = 0.0156Ce + 0.0655, R2 = 0.9925 (10) log qe = 0.9649 + 0.4407 log Ce, R2 = 0.9468 (11)
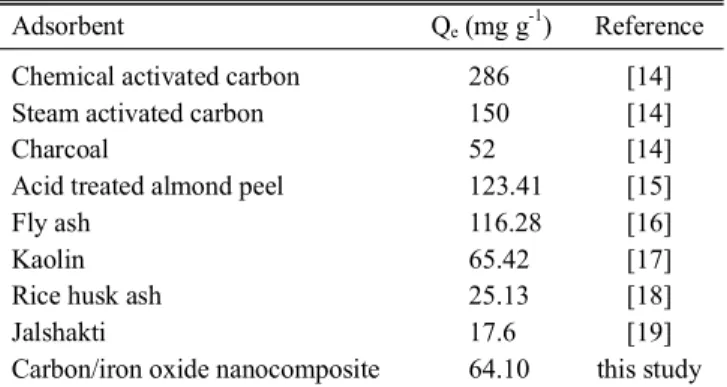
Table 1. Comparison of maximum monolayer adsorption capacity for the BG onto various adsorbents
Adsorbent Qe (mg g-1) Reference
Chemical activated carbon 286 [14]
Steam activated carbon 150 [14]
Charcoal 52 [14]
Acid treated almond peel 123.41 [15]
Fly ash 116.28 [16]
Kaolin 65.42 [17]
Rice husk ash 25.13 [18]
Jalshakti 17.6 [19]
Carbon/iron oxide nanocomposite 64.10 this study
Table 2. Thermodynamic parameters for BG adsorption
∆G0 (kJ mol‐1)
∆H0 (kJ mol‐1) ∆S0 (J mol‐1 K‐1)
298 K 303 K 308 K
-2.980 -5.214 -7.669 124.152 6.178
It was found that the correlation coefficient of Langmuir and Freundlich isotherms were 0.9925 and 0.9468. This revealed the data were better fitted to the Langmuir equation than Freund- lich equation. The maximum monolayer adsorption capacity (Qe) of nanocomposite for BG was found to be 64.10 mg g-1. The Comparison of maximum monolayer adsorption capacity for the BG onto various adsorbents is shown in Table 1.
Effect of temperature and thermodynamics
The adsorption of BG was found to increase from 28 to 38 mg g-1 when the temperature was increased from 298 to 308 K.
The enhancement in the adsorption capacity may be due to the decrease in viscosity of solution and increase in rate of diffu- sion of adsorbate molecules in the internal pores of adsorbent particles.20
Thermodynamic studies were performed, to find the nature of adsorption process. Thermodynamics parameters i.e. free energy (∆G0), enthalpy (∆H0) and entropy (∆S0) were calculated using Van’t Hoff and Gibb’s-Helmholtz equations:
∆G0 = - RT ln Kc (12)
Kc = Cae/Ce (13)
ln Kc = ∆S0/R ‒ ∆H0/RT (14)
where Cae and Ce are the equilibrium concentration of dye (mg g-1) on the adsorbent and solution, respectively. Kc is the equili- brium constant, T is the solution temperature (K) and R is the gas constant.
The negative ∆G0 values indicate the feasibility and spon- taneity of the adsorption process (Table 2). The positive value of ∆H0 suggests the endothermic nature of adsorption. The positive value of ∆S0 shows the increase in randomness at solid/
solution interface and entropically favorable adsorption of BG.
DESORPTION
In order to investigate the regeneration capacity, sodium hydroxide, water and acetic acid were used for desorption from BG saturated adsorbent. NaOH (1 M) and water did not show any desorption of BG. But 0.1 and 1 M CH3COOH solubilised 58 and 80% of dye. The dye molecules attached on the adsor- bent surface easily desorbs in 0.1 M CH3COOH but at high concentration, CH3COOH (1M) get diffuse into pores of the adsorbents and as a result, solubility of dye increases.21
ADSORPTION MECHANISM
Adsorption of BG may take place by either chemisorption or physisorption or both. There are many factors that may in- fluence the adsorption behavior, such as dye structure and size, adsorbent surface properties, stearic effect and hydrogen bond- ing etc. BG is a cationic dye. In aqueous solution, it dissociate as:
R N
C H3
C H3
H S O4 H 2O R
C H
C H
3
3
H S O N + 4
where R is used for the rest of the dye molecule.
The interactions between BG and composite surface can be divided into weak and strong interactions. The weak interaction occurs due to the presence of van der Walls forces, while strong interaction occurs due to (a) the hydrogen bonding between the oxygen and nitrogen containing functional groups of dye mole- cules and adsorbent (b) hydrophobic-hydrophobic interactions between the hydrophobic part of BG molecules and adsorbent.
Under the influence of dye solution pH, the adsorption may take place by electrostatic force which was discussed earlier (Effect of initial solution pH).
CONCLUSION
The present study confirmed that carbon/iron oxide nano- composite is a promising adsorbent for the removal of BG from aqueous solution. The maximum adsorption was attained within 120 min. The optimum pH for the adsorption of BG was found to be at 9.0 and an electrostatic attraction was observed between negatively charged adsorbent at pH > 7.0 with positively charg-
ed dye molecules. The equilibrium data fitted well in the Lang- muir model of adsorption, showing monolayer coverage of dye molecules at the outer surface of nanocomposite. Adsorption of BG increases with increase in temperature, indicating endo- thermic nature of adsorption following pseudo second order kinetic.
REFERENCES
1. Bhatnagar, A.; Jain, A. K.; Mukul, M. K. Environ. Chem. Lett.
2005, 2, 199.
2. Chang, C. F.; Lin, P. H.; Hall, W. Colloid. Surface. A. Physico- chem. Eng. Asp. 2006, 280, 194.
3. Banerjee, S. S.; Chen, D. H. J. hazard. Mater. 2007, 147, 792.
4. Stipp, S. L. S.; Hansen. M.; Kristensen, R.; Hochella, M. F.; Benned- sen, L.; Diderikesen, K.; Balic, Z. T.; Leonard, D.; Mathieu, H. J.
Chem. Geol. 2002, 190, 321.
5. Pirillo, S.; Ferreia, M. L.; Rueda, E. H. Ind. Eng. Chem. Res. 2007, 46, 8255.
6. Oliveira, L. C. A.; Rios, R. V. R. A.; Fabris, J. D.; Garg, V.; Sapag, K.; Lago, R. M. Carbon 2002, 40, 2177.
7. Ungar, T. J. Mater. Sci. 2007, 42, 1584.
8. Zhong, Y.; Ping, D.; Song. X.; Yin, F. J. Alloy. Comp. 2009, 476, 113.
9. Pomogailo, A. D.; Dzhardimalieva, G. I.; Rozinberg, A. S.; Mura- viev, D. M. J. Nanopart. Res. 2003, 4, 497.
10. Anirudhan, T. S.; Divya. L.; Suchithra, P. S. J. Envir. Manag. 2009, 90, 549.
11. Lagergren, S. K. Svenska Vetenskapsad Handl. 1898, 24, 1.
12. Ho, Y. S. Ph. D. thesis, University of Birmingham, Birmingham, U. K. 1995.
13. Mittal, A. J. hazard. Mater. 2006, 133, 196.
14. Asadullah, M.; Asaduzzaman, M.; Kabir, M. S.; Mostofa, M. G.;
Miyazawa T. J. hazard. Mater. 2010, 174, 437.
15. Ahmad, R.; Mondal P. K. Sep. Sci. Tech. 2009, 44, 638.
16. Mane, V. S.; Mall, I. D.; Srivastava, V. C. Dyes Pigm. 2007b, 73, 269.
17. Nandi, B. K.; Goswami, A.; Purkait, M. K. J. hazard. Mater. 2009, 161, 387.
18. Mane, V. S.; Mall, I. D.; Srivastava, V. C. J. Environ. Manage.
2007, 84, 390.
19. Dhodapkar, R.; Rao, N. N.; Pande, S. P.; Nandy, T.; Devotta, S.
React. Funct. Poly. 2007, 67, 540.
20. Wang, S.; Zhu, Z. H.; Dyes. Pig. 2007, 75, 306.
21. Inbaraj, B. S.; Sulochana. N.; Ind. J. chem. Tech. 2006, 1, 17.