ABSTRACT
Purpose: Four and a half LIM protein 1 (FHL1) is involved in breast cancer (BC) development, but the regulatory mechanism involved remain unclear. In the present study, we examined the role of FHL1 in BC development.
Methods: The expression of FHL1, miR-183-5p, and miR-96-5p in BC tissues was analyzed using StarBase analysis. FHL1 expression in BC tissues, a normal human breast epithelial cell line, and BC cell lines was detected using quantitative reverse transcription polymerase chain reaction (qRT-PCR). The relationship between FHL1 and miR-183-5p/miR-96-5p was analyzed via Pearson's rank correlation, TargetScan, and a dual-luciferase reporter assay. BT549 and MDA-MB-231 cells were transfected with either FHL1 and miR-183-5p mimics, or siFHL1 and a miR-183-5p inhibitor, respectively. The viability, colony number, migration, invasion, and tube length of BT549 and MDA-MB-231 cells were examined using cell counting kit-8, colony formation, wound-healing, Transwell, and tube formation assays, respectively. The levels of FHL1, vascular endothelial growth factor (VEGF), p53, E-cadherin, N-cadherin, and vimentin were quantified using western blotting and qRT-PCR.
Results: FHL1 expression was downregulated in BC tissues and cells, whereas miR-183-5p and miR-96-5p were upregulated in BC tissues (negative correlation with FHL1 expression).
FHL1 overexpression inhibited the viability, colony number, migration, and invasion of BC cells and the expression of VEGF, N-cadherin, and vimentin, and increased the expression of FHL1, p53, and E-cadherin in BT549 cells. Furthermore, a miR-183-5p mimic reversed these effects of FHL1 overexpression, whereas FHL1 silencing caused opposite results to those observed in MDA-MB-231 cells; however, this was reversed by a miR-183-5p inhibitor.
Conclusion: Our study suggests that miR-183-5p promotes cell proliferation, metastasis, and angiogenesis by negatively regulating FHL1 in BC.
Keywords: Breast neoplasms; FHL1 protein, human; MicroRNAs; Neoplasm metastasis
Original Article
Received: Mar 13, 2020 Accepted: Aug 17, 2020 Correspondence to Xuexia Zhang
Department of Anesthesiology and Guangdong Provincial Key Laboratory of Biomedical Imaging, The Fifth Affiliated Hospital, Sun Yat-sen University, No. 52 Meihua East Road, Xiangzhou District, Zhuhai, Guangdong Province 519000, China.
E-mail: [email protected]
*These authors contributed equally to this work.
© 2020 Korean Breast Cancer Society This is an Open Access article distributed under the terms of the Creative Commons Attribution Non-Commercial License (https://
creativecommons.org/licenses/by-nc/4.0/) which permits unrestricted non-commercial use, distribution, and reproduction in any medium, provided the original work is properly cited.
ORCID iDs Yi Li
https://orcid.org/0000-0001-9717-1719 Qing'an Zeng
https://orcid.org/0000-0001-7309-4229 Jiliang Qiu
https://orcid.org/0000-0001-6541-515X Ting Pang
https://orcid.org/0000-0003-1437-7442 Lin Huang
https://orcid.org/0000-0002-4899-9621 Xuexia Zhang
https://orcid.org/0000-0002-5031-8936
Yi Li
1,2,*, Qing'an Zeng
1,*, Jiliang Qiu
3, Ting Pang
4, Fenglian Ye
1, Lin Huang
1, Xuexia Zhang
2,51
Department of Thyroid & Breast Surgery, The Fifth Affiliated Hospital, Sun Yat-sen University, Guangzhou, China
2
Guangdong Provincial Key Laboratory of Biomedical Imaging, The Fifth Affiliated Hospital, Sun Yat-sen University, Guangzhou, China
3
Department of Surgery, Sun Yat-sen University Cancer Center, State Key Laboratory of Oncology in South China, Collaborative Innovation Center for Cancer Medicine, Guangzhou, China
4
Department of Anesthesiology, The Sixth Affiliated Hospital, Sun Yat-sen University, Guangzhou, China
5
Department of Anesthesiology, The Fifth Affiliated Hospital, Sun Yat-sen University, Guangzhou, China
MiR-183-5p Promotes Proliferation, Metastasis and Angiogenesis in Breast Cancer Cells through Negatively
Regulating Four and a Half LIM Protein 1
Conflict of Interest
The authors declare that they have no competing interests.
Author Contributions
Conceptualization: Li Y, Zeng Q; Data curation:
Zeng Q, Huang L; Formal analysis: Li Y, Qiu J; Investigation: Pang T; Methodology: Qiu J, Pang T, Zhang X; Project administration: Qiu J, Huang L; Software: Zhang X; Validation: Pang T; Visualization: Zhang X; Writing - original draft: Li Y, Zeng Q.
INTRODUCTION
Driven by many genetic or epigenetic alterations and molecular events, breast cancer (BC) is a molecularly heterogeneous disease that represents the most frequent malignant tumor in women and is a predominant cause of tumor-associated mortality worldwide [1]. Metastasis imposes substantial difficulties on the treatment of patients with BC [2]. The survival rate of patients with BC is still low despite the constant development of modern treatments [2,3].
Blood vessels provide tumors with nutrition and oxygen used for growing into a solid tumor [4], and angiogenesis is a precondition for tumor growth and metastasis [5]. Therefore, the identification of novel cancer markers and the potential molecular mechanisms of metastasis and angiogenesis of BC is urgently needed.
Four and a half LIM protein 1 (FHL1), which has been identified as a tumor suppressor gene in multiple malignancies [6-8], suppresses the growth of tongue squamous cell carcinoma cells through G1/S cell cycle arrest [7]. FHL1 silencing promotes the growth of HepG2 and HeLa cells [8]. Low expression of FHL1 is speculated to play a role in the development and progression of lung cancer [6]. Moreover, Qin et al. [9] suggested that low expression of FHL1 is closely correlated to tumor invasion and metastasis of BC. Additionally, FHL1 modulates BC cell growth [10]. However, the exact role(s) of FHL1 in the metastasis and angiogenesis of BC remains unclear.
MicroRNAs (miRNAs) inhibit protein translation by targeting the 3′-untranslated region (3′- UTR) of target messenger RNAs (mRNAs) [11]. Recently, differentially expressed miRNAs in cancer cells have been reported to be closely associated with tumor occurrence and development [12,13]. Differentially expressed miRNAs in BC often play an important role in BC development by binding to their target mRNAs [14]. Shi et al. [15] reported that miR-96-5p plays a role in the development of BC and therefore could be used as an anti-cancer drug for improving BC treatment. Cheng et al. [14] demonstrated that miR-183-5p enhances cell proliferation and suppresses apoptosis of human BC cells by regulating programmed cell death protein 4, which might be a potential therapeutic target for patients with BC. Our study explored the relationship between FHL1 and miR-183-5p/miR-96-5p, and the role of the interaction between FHL1 and miR-183-5p in the proliferation, metastasis, and angiogenesis of BC.
METHODS
Clinical specimens
Fifty pairs of BC tissues and neighboring non-tumor breast tissues were collected from patients diagnosed with triple-negative BC (TNBC) at The Fifth Affiliated Hospital, Sun Yat- sen University, between June 2017 and July 2018. All these patients underwent surgery and did not undergo radiotherapy or chemotherapy prior to the study. Signed informed consent was obtained before surgery. The current experiment was approved by the Ethics Committee of The Fifth Affiliated Hospital, Sun Yat-sen University (approval number: SY2017040212).
Cell culture
A normal human breast epithelial cell line (MCF-10A) and BC cell lines (SK-BR-3, BT549,
MCF7, MDA-MB-231, MDA-MB-453, and BT20) were purchased from American Tissue
Culture Collection (ATCC, Manassas, USA). MCF-10A cells were cultured using the MEGM
Bullet Kit (CC-3150; Lonza/Clonetics Corporation, Basel, Switzerland). SK-BR-3 cells were
cultured in McCoy's 5A Modified Medium (30-2007; ATCC). BT549 cells were cultured in Roswell Park Memorial Institute Medium 1640 (10491; Solarbio, Beijing, China). MCF7 cells were cultured in Eagle's Minimum Essential Medium (30-2003; ATCC). MDA-MB-231 and MDA-MB-453 cells were cultured in Leibovitz's L-15 Medium (30-2008; ATCC). BT20 cells were cultured in Dulbecco's Modified Eagle's Medium (DMEM, 11965; Solarbio). All culture media were supplemented with 10% fetal bovine serum (FBS, 11011-8611; Solarbio) and 1%
penicillin-streptomycin liquid (P1400; Solarbio).
Cell transfection
The FHL1 sequence (GenePharma, Shanghai, China) was sub-cloned into the pcDNA3.1 vector (V79020; Thermo Fisher Scientific, Waltham, USA). siRNAs specifically targeting FHL1 (siFHL1) and siRNA negative control (siNC), miR-183-5p mimics, miR-96-5p mimics, and the miR-183-5p inhibitor were purchased from GenePharma. The scrambled RNA clone (GenePharma) with a disrupted sequence of miR-183-5p mimics or the miR-183-5p inhibitor was used as a negative control for miR-183-5p mimics and the miR-183-5p inhibitor, respectively. siNC was used as a negative control for siFHL1. The cells were transfected with different miRNAs, inhibitors, RNAs, and siRNAs for 48 hours using Lipofectamine 2000 (11668; Thermo Fisher Scientific).
Reverse transcription quantitative real-time polymerase chain reaction (PCR) TRIzol reagent (15596018; Invitrogen, Carlsbad, USA) was used to extract total RNA. Non- miRNA genes were synthesized into cDNA via first-strand DNA synthesis (Thermo Fisher Scientific). PCR amplification was performed in a 7500 Fast Real-Time PCR System with SYBR Premix Ex Taq (Takara Biotechnology, Dalian, China). For the detection of miRNA expression, miRNAs from cultured cells were extracted using the miRNA Extraction Kit (B1802; HaiGene, Harbin, China). miRNA cDNA synthesis was performed with the HG TaqMan miRNA cDNA Synthesis Kit (B1802; HaiGene). Real-time quantitative polymerase chain reaction (qRT-PCR) analysis of miR-183-5p was performed in a 7500 Fast Real-Time PCR system using the HG TaqMan miRNA qPCR Kit (TAP02304; HaiGene). The levels of non-miRNAs and miRNAs were normalized to that of glyceraldehyde 3-phosphate dehydrogenase (GAPDH) and U6, respectively. Primers used for PCR amplification were synthesized by Sangon Biotech Co., Ltd., (Shanghai, China) and are shown in Table 1.
Relative levels of gene expression were calculated using the 2
−ΔΔCtmethod [16].
Western blotting
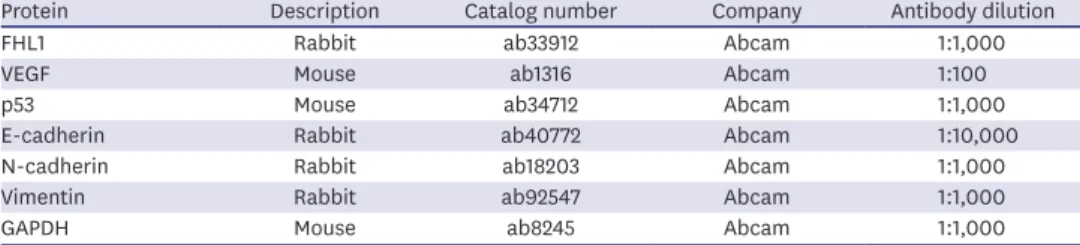
Protein isolation from cultured cells were performed using radioimmunoprecipitation assay buffer (P0013; Beyotime, Nantong, China) with phenylmethylsulfonyl fluoride (ST506; Beyotime). Bicinchoninic acid (P0009; Beyotime) was used to determine protein concentrations. Proteins (20 μg/well) were separated on an sodium dodecyl sulfate- polyacrylamide gel electrophoresis gel and transferred onto a polyvinylidene fluoride (PVDF) membrane (IPVH00010; Millipore Corp. Bedford, USA). The PVDF membranes were washed, blocked, and incubated with primary antibodies (shown in Table 2) overnight at 4°C. Afterwards, the membranes were washed and incubated with a horseradish peroxidase- conjugated secondary antibody (Goat Anti-Mouse, 1:2,000, ab205719 or Goat Anti-Rabbit, 1:2,000, ab205718; both from Abcam, Cambridge, UK) at 25°C for 2 hours. Specific protein signals were developed using a luminescent image analyzer (ImageQuant LAS4000 mini;
GE Healthcare, Chicago, USA) with BeyoECL Star (P0018FS; Beyotime). GAPDH was used a
loading control.
Cell Counting Kit (CCK)-8 assay
Cell viability was detected via CCK-8 assays (CA1210; Solarbio) according to the manufacturer's protocol. In brief, transfected cells (2 × 10
4cell/well) were cultivated in 96-well plates for 48 hours. CCK-8 solution was added to the 96-well plates and cells were incubated for 4 hours. Absorbance was detected at 450 nm using a microplate reader (SpectraMax iD5; Molecular Devices, San Jose, USA).
Colony formation assay
Transfected cells (1 × 10
3cells/well) were cultured in 60-mm dishes for 2 weeks at 37°C.
Cells were then washed, fixed with methanol for 5 minutes, and stained with crystal violet (IC0600; Solarbio) for 3 minutes at 37°C. Colonies were counted using a microscope (Ts2r- FL; Nikon, Tokyo, Japan).
Table 1. Primer sequences used for qRT-PCR
Genes Primer sequences (5′-3′)
miR-183-5p
forward TATGCCACTGCTAGA ATTCACT
reverse GTGCACGGTCCGACGT
FHL1
forward TGCTGCCTGAAATGCTTTGAC
reverse GCCAGAAGCGGTTCTTATAGTG
VEGF
forward AGGGCAGAATCATCACGAAGT
reverse AGGGTCTCGATTGGATGGCA
p53
forward CAGCACATGACGGAGGTTGT
reverse TCATCCAAATACTCCACACGC
E-cadherin
forward CGAGAGCTACACGTTCACGG
reverse GGGTGTCGAGGGAAAAATAGG
N-cadherin
forward TCAGGCGTCTGTAGAGGCTT
reverse ATGCACATCCTTCGATAAGACTG
Vimentin
forward GACGCCATCAACACCGAGTT
reverse CTTTGTCGTTGGTTAGCTGGT
GADPH
forward GGAGCGAGATCCCTCCAAAAT
reverse GGCTGTTGTCATACTTCTCATGG
U6
forward CTCGCTTCGGCAGCACA
reverse ACGCTTCACGAATTTGCGT
qRT-PCR = quantitative real-time reverse transcription polymerase chain reaction; FHL1 = four and a half LIM protein 1; VEGF = vascular endothelial growth factor; GAPDH = glyceraldehyde 3-phosphate dehydrogenase.
Table 2. List of primary antibodies used for western blots
Protein Description Catalog number Company Antibody dilution
FHL1 Rabbit ab33912 Abcam 1:1,000
VEGF Mouse ab1316 Abcam 1:100
p53 Mouse ab34712 Abcam 1:1,000
E-cadherin Rabbit ab40772 Abcam 1:10,000
N-cadherin Rabbit ab18203 Abcam 1:1,000
Vimentin Rabbit ab92547 Abcam 1:1,000
GAPDH Mouse ab8245 Abcam 1:1,000
FHL1 = four and a half LIM protein 1; VEGF = vascular endothelial growth factor; GAPDH = glyceraldehyde
3-phosphate dehydrogenase.
Scratch wound healing assay
Transfected cells were cultivated in 6-well plates until they reached 80%–90% confluence.
After the medium was discarded, confluent cells were scratched using a 10 μL tip, washed with serum-free medium, and incubated for 24 hours. Migration was measured by counting the migrating cells under an inverted microscope at 100× magnification (Ts2r-FL; Nikon).
Transwell assay
Cells were cultivated in Transwell chambers (Corning Inc., Corning, USA) in the upper chamber with 200 µL serum-free medium, while 500 µL medium with 10% FBS was added into the lower wells. After 24 hours of culture at 37°C, non-invasive cells were gently scraped off using cotton swabs, whereas the cells adhered to the lower surface were fixed with 4%
methanol for 30 minutes and stained with 0.1% crystal violet solution (IC0600; Solarbio) for 20 min at 37 °C and then photographed.
Angiogenesis assay
The BC cell culture medium was replaced by serum-free DMEM and cells were cultured for 48 h. Next, the cells were collected, centrifuged, and filtered to obtain tumor-conditioned medium. The 96-well plates were coated with 50 µL ice-cold Matrigel (Solarbio) and incubated for 30 minutes at 37°C. Then, 1 × 10
4human umbilical vein endothelial cells (HUVECs) were seeded onto the gel with 200 µL tumor-conditioned medium. After incubation at 37°C for 6 hours, the tube length of HUVECs was evaluated using a 100×
inverted microscope (Ts2r-FL; Nikon).
Dual-luciferase activity assay
HEK293T cells were used in a dual-luciferase activity assay. The possible target relationships between FHL1 and miR-183-5p/miR-96-5p were predicted via TargetScan. A sequence corresponding to the FHL1-3ʹ-UTR with the predicted miR-183-5p or miR-96-5p binding site was synthesized by RiboBio Co., Ltd. (Guangzhou, China) and cloned into a luciferase reporter gene vector (E1330; Promega, Madison, USA). The sequence of the putative miR- 183-5p or miR-96-5p binding site in the FHL1-3ʹ-UTR was mutated, and FHL1-3ʹ-UTR- mut (sequence: 5ʹ-UGUAUUGUCCCGACUGCAAUAAA-3ʹ) was constructed using the QuickChange Site-Directed Mutagenesis kit (Stratagene, Cedar Creek, USA). To confirm target relationships between FHL1 and miR-183-5p/miR-96-5p, HEK293T cells were cultured in 96-well plates and co-transfected either with FHL1-3ʹ-UTR or FHL1-3ʹ-UTR mut and a miR-183-5p mimic, or a miR-96-5p mimic by Lipofectamine 2000 (11668; Thermo Fisher Scientific). The Dual-Luciferase Reporter Assay system (E1910; Promega) was used to quantify the luciferase activity.
Statistical analysis
The data shown as mean ± standard deviation were analyzed using SPSS 19.0 software
(SPSS, Inc., Chicago, USA). Significant differences between BC and normal breast samples
were analyzed using StarBase. Correlation coefficients were calculated via Pearson's rank
correlation. Paired t-tests were used for comparison of paired samples. Multiple groups were
compared via one-way analysis of variance analysis. Differences were considered statistically
significant when p < 0.05.
RESULTS
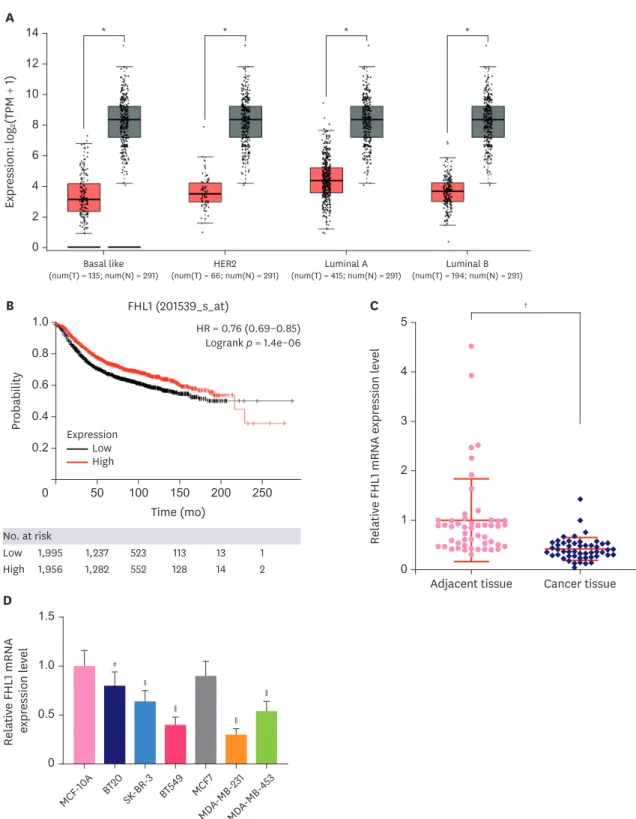
FHL1 was lowly expressed in BC tissues and cell lines
Low FHL1 expression was detected from three BC cells (basal like, HER2, luminal A, and luminal B tissues) (Figure 1A, p < 0.05). High or low expression of FHL1 was determined using the median. Based on the Gene Expression Omnibus, European Genome-Phenome Archive, and The Cancer Genome Atlas databases and Kaplan Meier plotter (http://kmplot.
com/analysis/index.php?p=background), survival analysis showed that patients with high FHL1 expression had a good prognosis (Figure 1B, p < 0.001). According to qRT-PCR, FHL1 expression was lower in TNBC tissues than that in adjacent tissues (Figure 1C, p < 0.001).
Except for MCF7 cells, FHL1 expression was lower in BT20, SK-BR-3, BT549, MDA-MB-231, and MDA-MB-453 cells compared to MCF-10A cells, and as it was especially low in BT549 and MDA-MB-231 cells (Figure 1D, p < 0.05 or p < 0.01 or p < 0.001), the 2 cell lines were used for subsequent experiments.
FHL1 regulated viability, migration, invasion, and tube length of BT549 and MDA-MB-231 cells
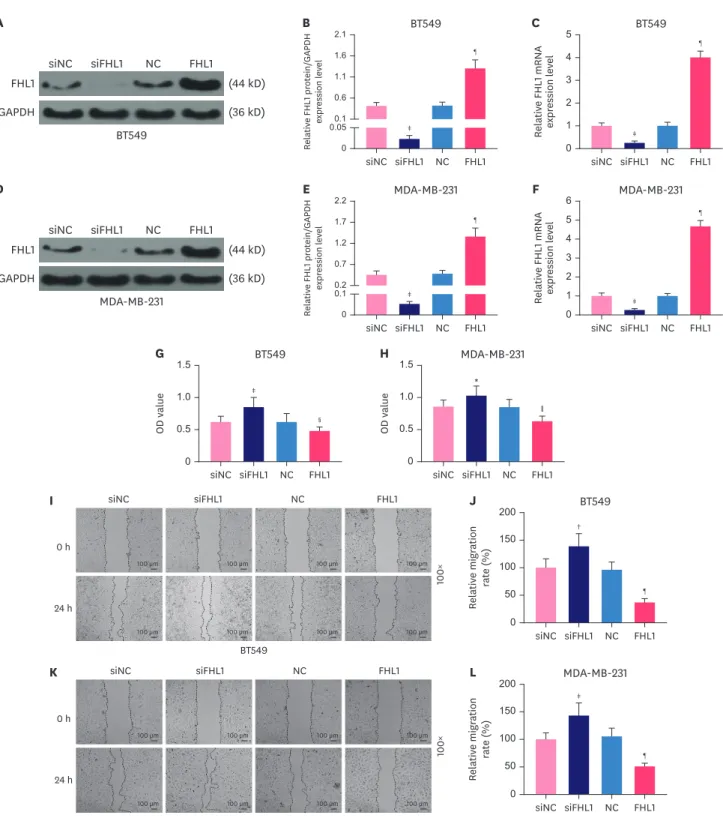
To explore the role of FHL1 in BC, siFHL1 and FHL1 were respectively transfected into BT549 and MDA-MB-231 cells to downregulate and upregulate the expression of FHL1, respectively.
The results showed that siFHL1 significantly suppressed FHL1 expression in BT549 (Figure 2A-C, p < 0.001) and MDA-MB-231 cells (Figure 2D-F, p < 0.001), whereas transfection of FHL1 produced the opposite effects (Figure 2A-F, p < 0.001). FHL1 silencing significantly increased viability (Figure 2G and H, p < 0.05 or p < 0.001), migration (Figure 2I-L, p < 0.01 or p < 0.001), invasion (Figure 3A-D, p < 0.001), and tube length (Figure 3E-F, p < 0.01 or p < 0.001) of BT549 and MDA-MB-231 cells, whereas FHL1 overexpression produced the opposite effects (Figure 2G-L and 3A-F, p < 0.05 or p < 0.01 or p < 0.001).
MiR-183-5p was negatively correlated with FHL1 in BC tissues and directly targeted FHL1 to downregulate its expression
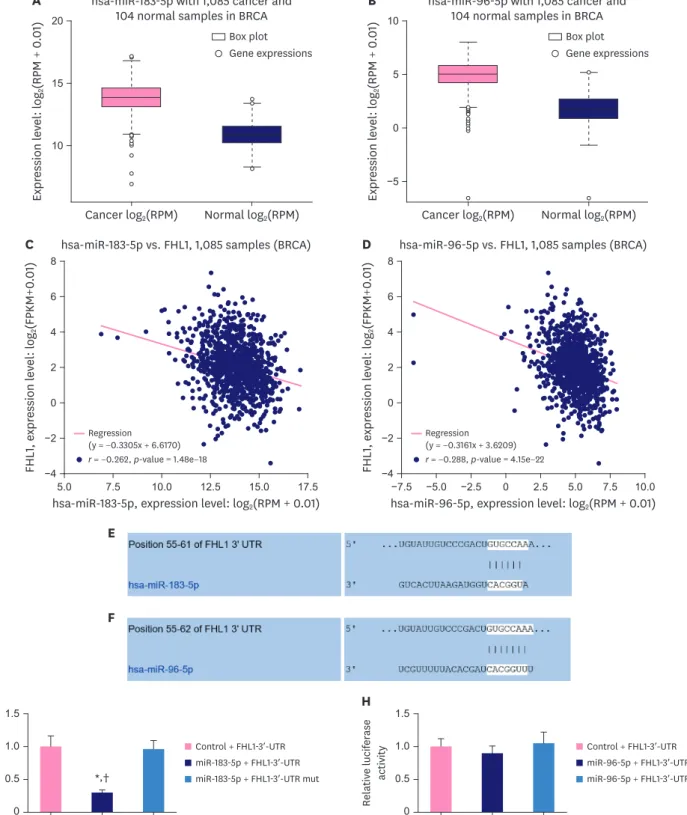
As described in Figure 4A and B, StarBase revealed that miR-183-5p and miR-96-5p were upregulated in BC tissues compared to adjacent normal tissues. Moreover, miR-183-5p expression was negatively correlated with the expression of FHL1 in BC tissues (Figure 4C, p <
0.001), and miR-96-5p expression was also negatively correlated with the expression of FHL1 in BC tissues (Figure 4D, p < 0.001). We predicted a relationship between FHL1 and miR-183-5p/
miR-96-5p using TargetScan, and found that miR-183-5p (Figure 4E) and miR-96-5p (Figure 4F) could bind to the FHL1-3ʹ-UTR. Dual-luciferase reporter assays revealed that miR-183-5p mimics decreased the luciferase activity associated with the FHL1-3ʹ-UTR compared to the Control + FHL1-3ʹ-UTR group (Figure 4G, p < 0.001), but did not change the luciferase activity of the FHL1-3ʹ-UTR mut (Figure 4G). However, miR-96-5p did not affect the luciferase activities of FHL1-3ʹ-UTR and FHL1-3ʹ-UTR mut (Figure 4H).
miR-183-5p overexpression stimulated proliferation, migration, invasion, and tube length of BT549 cells, effects which were partially reversed by FHL1 overexpression
To explore the interaction between FHL1 and miR-183-5p in BC, BT549 cells were transfected
with FHL1 and a miR-183-5p mimic to upregulate the expression of FHL1 and miR-183-5p. qRT-
PCR analyses showed that the miR-183-5p mimic significantly increased miR-183-5p expression
in BT549 cells (Figure 5A, p < 0.001). As shown in Figure 5B, FHL1 transfection did not alter
miR-183-5p expression or reverse the effect of the miR-183-5p mimic on miR-183-5p expression.
0 Expr ession: l og
2(TPM + 1)
8
A 14
6 4 2 12 10
Basal like
(num(T) = 135; num(N) = 291)
Luminal B
(num(T) = 194; num(N) = 291)
Luminal A
(num(T) = 415; num(N) = 291)
HER2
(num(T) = 66; num(N) = 291)
* * * *
Time (mo) 0
Pr obability
0.8 1.0
250 150
B
0.6 0.4 0.2
50 100 200
High Low No. at risk
1,956 1,995
1,282 1,237
552 523
128 113
14 13
2 1 High Low
Expression
HR = 0.76 (0.69–0.85) Logrank p = 1.4e−06 FHL1 (201539_s_at)
0
Relativ e FHL 1 mRNA e xpr ession l ev el
4 5
Cancer tissue C
3
2
1
Adjacent tissue
†
MCF -10 A BT 20
SK -BR -3
BT 549 MCF 7 MD A-MB-
231 MD A-MB-
453 Relativ e FHL 1 mRNA expr ession l ev el
0 1.0 1.5
0.5
‡
D
§
∥
∥
∥
Figure 1. FHL1 expression was downregulated in several BC tissues and BC cell lines. (A) FHL1 expression in various BC tissues was analyzed via StarBase. (B) A Kaplan-Meier plotter was used to analyze the correlation between FHL1 expression and survival rate of patients with BC. (C) FHL1 expression in TNBC tissues and adjacent breast tissues was determined using qRT-PCR. (D) FHL1 expression in the normal human breast epithelial cell line MCF-10A and human BC cell lines (SK-BR-3, BT549, MCF7, MDA-MB-231, and MDA-MB-453) was determined using qRT-PCR. GAPDH was used as an internal control. The data are shown as mean ± standard deviation.
BC = breast cancer; FHL1 = four and a half LIM protein 1; TNBC = triple-negative breast cancer; qRT-PCR = quantitative real-time reverse transcription polymerase chain reaction; GAPDH = glyceraldehyde 3-phosphate dehydrogenase.
* p < 0.5 or
†p < 0.001 vs. cancer tissue.
‡p < 0.5 or
§p < 0.01 or
∥p < 0.001 vs. MCF-10A.
siNC siFHL1 NC FHL1 BT549
Relativ e FHL 1 mRNA expr ession l ev el 0 2 4 5
1 3
‡
¶
C A
siNC siFHL1 NC FHL1
FHL1 GAPDH
(44 kD) (36 kD) BT549
siNC siFHL1 NC FHL1 BT549
Relativ e FHL 1 pr ot ein/ GAPDH expr ession l ev el
0 0.6 0.1 1.6 2.1
0.05 1.1
¶
B
‡
siNC siFHL1 NC FHL1 MDA-MB-231
Relativ e FHL 1 mRNA expr ession l ev el 0 2 4 6 5
1 3
‡
¶
F D
siNC siFHL1 NC FHL1
FHL1 GAPDH
(44 kD) (36 kD)
siNC siFHL1 NC FHL1 MDA-MB-231
MDA-MB-231
Relativ e FHL 1 pr ot ein/ GAPDH expr ession l ev el
0 0.7 0.2 1.7 2.2
0.1 1.2
¶
E
‡
siNC siFHL1 NC FHL1 MDA-MB-231
OD val ue
0 0.5 1.5
1.0 *
∥
H
siNC siFHL1 NC FHL1 BT549
OD val ue
0 1.0 1.5
0.5
§G
‡
siNC siFHL1 NC FHL1 BT549
Relativ e migr ation rat e (%) 0 100 200 150
50
†
¶
J
I siNC siFHL1 NC FHL1
0 h
24 h
100 µm
100 µm
100 µm
100 µm
100 µm
100 µm
100 µm
100 µm
BT549
100×
siNC siFHL1 NC FHL1 MDA-MB-231
Relativ e migr ation rat e (%) 0 100 200 150
50
‡
¶
L K
100 µm
100 µm
100 µm
100 µm
100 µm
100 µm
100 µm
100 µm
siNC siFHL1 NC FHL1
0 h
24 h
MDA-MB-231
100×
Figure 2. The transfection of FHL1 or siFHL1 regulated FHL1 expression, viability, and migration of BT549 and MDA-MB-231 cells. (A and B) FHL1 protein expression in BT549 cells transfected with siFHL1 or FHL1 was determined via western blotting. (C) FHL1 mRNA expression in BT549 cells transfected with siFHL1 or FHL1 was determined using qRT-PCR. (D and E) FHL1 protein expression in MDA-MB-231 cells transfected with siFHL1 or FHL1 was determined using western blotting.
(F) FHL1 mRNA expression in MDA-MB-231 cells transfected with siFHL1 or FHL1 was determined using qRT-PCR. (G) The viability of BT549 cells transfected with siFHL1 or FHL1 was determined using a CCK-8 assay. (H) The viability of MDA-MB-231 cells transfected with siFHL1 or FHL1 was determined using a CCK-8 assay. (I) Migration of BT549 cells transfected with siFHL1 or FHL1 was determined using a scratch assay. (K) Migration of MDA-MB-231 cells transfected with siFHL1 or FHL1 was determined using a scratch assay. GAPDH was used as an internal control. The data are shown as mean ± standard deviation.
FHL1 = four and a half LIM protein 1; siFHL1 = siRNAs specifically targeting FHL1; qRT-PCR = quantitative real-time reverse transcription polymerase chain reaction;
mRNA = messenger RNA; CCK = Cell Counting Kit; GAPDH = glyceraldehyde 3-phosphate dehydrogenase; NC = negative control; siNC = siRNA negative control.
* p < 0.5 or
†p < 0.01 or
‡p < 0.001 vs. siNC.
§p < 0.05 or
∥p < 0.001 or
¶p < 0.001 vs. NC.
In addition, miR-183-5p overexpression significantly increased the viability (Figure 5C, p <
0.001), colony number (Figure 5D and E, p < 0.001), migration (Figure 5F and G, p < 0.001), invasion (Figure 5H and I, p < 0.01), and tube length (Figure 5J and K, p < 0.001) of BC cells, phenotypes which were reversed by FHL1 overexpression (Figure 5C-K, p < 0.05 or p < 0.001).
The miR-183-5p mimic significantly decreased the protein expression of FHL1 (Figure 6A and B, p < 0.001), while FHL1 overexpression strongly increased the protein expression of FHL1 (Figure 6A and B, p < 0.001). This effect was partially reversed by miR-183-5p
siNC siFHL1 NC FHL1
siNC siFHL1 NC FHL1 BT549
Relativ e in vasion r at e (%)
0 100 200 250
50 150
†
‡
24 h
BT549
100×
A B
200 µm 200 µm 200 µm 200 µm
siNC siFHL1 NC FHL1
siNC siFHL1 NC FHL1 MDA-MB-231
Relativ e in vasion r at e (%)
0 100 200 250
50 150
†
‡
24 h
MDA-MB-231
100×
C D
200 µm 200 µm 200 µm 200 µm
*
siNC siFHL1 NC FHL1
siNC siFHL1 NC FHL1 BT549
Relativ e tube l ength
0 100 200
50 150
‡
6 h
BT549
100×
E F
100 µm 100 µm 100 µm 100 µm
siNC siFHL1 NC FHL1
siNC siFHL1 NC FHL1 MDA-MB-231
Relativ e tube l ength
0 100 200
50
150
†‡
6 h
MDA-MB-231
100×
G H
100 µm 100 µm 100 µm 100 µm
Figure 3. The transfection of FHL1 or siFHL1 regulated invasion and tube length of BT549 and MDA-MB-231 cells. (A and B) Invasion of BT549 cells transfected with siFHL1 or FHL1 was determined using a Transwell invasion assay. (C and D) The invasion rate in MDA-MB-231 cells transfected with siFHL1 or FHL1 was determined using a Transwell invasion assay. (E and F) The tube length of BT549 cells transfected with siFHL1 or FHL1 was determined using a tube formation assay. (G and H) The tube length of MDA-MB-231 cells transfected with siFHL1 or FHL1 was determined using a tube formation assay. The data are shown as mean ± standard deviation.
FHL1 = four and a half LIM protein 1; siFHL1 = siRNAs specifically targeting FHL1; NC = negative control; siNC = siRNA negative control.
* p < 0.01 or
†p < 0.001 vs. siNC.
‡p < 0.001 vs. NC.
E
F
hsa-miR-183-5p vs. FHL1, 1,085 samples (BRCA)
7.5 5.0
FHL 1, e xpr ession l ev el: l og
2(FPKM +0.0 1)
10.0
hsa-miR-183-5p, expression level: log
2(RPM + 0.01)
−4 2 8
0
−2 4 6
15.0
12.5 17.5
C
Regression (y = −0.3305x + 6.6170) r = −0.262, p-value = 1.48e−18
hsa-miR-96-5p vs. FHL1, 1,085 samples (BRCA)
−5.0
−7.5
FHL 1, e xpr ession l ev el: l og
2(FPKM +0.0 1)
−2.5
hsa-miR-96-5p, expression level: log
2(RPM + 0.01)
−4 2 8
0
−2 4 6
5.0 7.5 2.5
0 10.0
D
Regression (y = −0.3161x + 3.6209) r = −0.288, p-value = 4.15e−22
hsa-miR-183-5p with 1,085 cancer and 104 normal samples in BRCA
Normal log
2(RPM) Cancer log
2(RPM)
Expr ession l ev el: l og
2(RPM + 0 .01 ) 20
15
10
A hsa-miR-96-5p with 1,085 cancer and
104 normal samples in BRCA
Normal log
2(RPM) Cancer log
2(RPM)
Expr ession l ev el: l og
2(RPM + 0 .01 ) 10
5
0
−5
B
Box plot Gene expressions
Box plot Gene expressions
Relativ e l ucifer ase activity 0 1.0 1.5
0.5
G
Relativ e l ucifer ase activity 0 1.0 1.5
0.5
H
* ,†
Control + FHL1-3′-UTR miR-183-5p + FHL1-3′-UTR miR-183-5p + FHL1-3′-UTR mut
Control + FHL1-3′-UTR miR-96-5p + FHL1-3′-UTR miR-96-5p + FHL1-3′-UTR mut
Figure 4. MiR-183-5p and miR-96-5p expression were upregulated and negatively correlated with FHL1 expression in BC tissues, and miR-183-5p directly targeted FHL1 to downregulate its expression. (A and B) MiR-183-5p and miR-96-5p expression in BC tissues were determined using StarBase. (C and D) The relationship between FHL1 and miR-183-5p/miR-96-5p was analyzed via Pearson's rank correlation. (E and F) The target relationship between FHL1 and miR-183-5p/miR-96-5p was predicted via TargetScan. (G) Luciferase activity in Control + FHL1-3ʹ-UTR, miR-183-5p + FHL1-3ʹ-UTR, and miR-183-5p + FHL1-3ʹ-UTR mut groups in HEK293T cells was determined using a dual-luciferase assay. (H) Luciferase activity in Control + FHL1-3ʹ-UTR, miR-96-5p + FHL1-3ʹ-UTR, and miR-96-5p + FHL1-3ʹ-UTR mut groups in HEK293T cells was determined using a dual-luciferase assay. The data are shown as mean ± standard deviation.
FHL1 = four and a half LIM protein 1; BC = breast cancer; 3ʹ-UTR = 3ʹ-untranslated region; mut = mutated.
* p < 0.001 vs. Control + FHL1-3ʹ-UTR.
†p < 0.001 vs. miR-183-5p + FHL1-3ʹ-UTR mut.
Scr ambl e + NC mimics + NC
Scr ambl e + FHL 1 mimics + FHL
1 BT549
Relativ e miR -183 -5 p expr ession l ev el 0 2 3
1
¶
B
‡
Scr ambl e + NC mimics + NC
Scr ambl e + FHL 1 mimics + FHL
1 BT549
OD val ue
0 0.8 1.0
0.4 0.6 0.2
§,∥
C
‡
‡
Contr ol
Scr ambl e
mimics BT549
Relativ e miR -183 -5 p expr ession l ev el 0 2 3
1
*
A
BT549
Relativ e col on y number
0 100 250 200 150
50
‡
‡
§,¶
E D
Scramble + NC mimics + NC Scramble + FHL1 mimics + FHL1
BT549 14 day
Scramble + NC mimics + NC Scramble + FHL1 mimics + FHL1
BT549
Scramble + NC mimics + NC Scramble + FHL1 mimics + FHL1
0 h
24 h
F
100×
BT549
Relativ e migr ation r at e (%)
0 100 200 150
50
‡
‡
§,¶
G
100 µm
100 µm
100 µm
100 µm
100 µm
100 µm
100 µm
100 µm
Scramble + NC mimics + NC Scramble + FHL1 mimics + FHL1
H BT549
Relativ e in vasion r at e (%)
0 100 150
50
†
‡
§,¶
I
Scramble + NC mimics + NC Scramble + FHL1 mimics + FHL1 24 h
BT549
100×
200 µm 200 µm 200 µm 200 µm
Scramble + NC mimics + NC Scramble + FHL1 mimics + FHL1
J BT549
Relativ e tube l ength
0 100 200 150
50
‡
‡
§,¶
K
Scramble + NC mimics + NC Scramble + FHL1 mimics + FHL1 6 h
BT549
100×
100 µm 100 µm 100 µm 100 µm
Scramble + NC mimics + NC Scramble + FHL1 mimics + FHL1
Figure 5. miR-183-5p overexpression stimulated the proliferation, migration, invasion, and tube length of BT549 cells, which were partially reversed by FHL1 overexpression. (A) miR-183-5p expression in BT549 cells transfected with miR-183-5p mimics was quantified using qRT-PCR. (B) miR-183-5p expression in BT549 cells transfected with miR-183-5p mimics or FHL1 or co-transfected with miR-183-5p mimics and FHL1 was quantified using qRT-PCR. Viability (C), colony number (D and E), migration (F and G), invasion (H and I), and tube length (J and K) of BT549 cells transfected with miR-183-5p mimics or FHL1 or co-transfected with miR-183-5p mimics and FHL1 were measured using CCK-8, colony formation, scratch wound-healing, Transwell invasion, and tube formation assays, respectively.
U6 was used as an internal control. The scramble NC is a disrupted sequence of miR-183-5p mimics. The data are shown as mean ± standard deviation.
FHL1 = four and a half LIM protein 1; qRT-PCR = quantitative real-time reverse transcription polymerase chain reaction; CCK = Cell Counting Kit; NC = negative control; OD = optical density.
* p < 0.001 vs. Scramble.
†p < 0.01 or
‡p < 0.001 vs. Scramble + NC.
§p < 0.001 vs. mimics + NC.
∥p < 0.05 or
¶p < 0.001 vs. Scramble + FHL1.
overexpression in BT549 cells (Figure 6A and B, p < 0.001). To further investigate the effects of the interaction between FHL1 and miR-183-5p on the migration, invasion, and tube length of BT549 cells, we quantified the expression of vascular endothelial growth factor (VEGF), p53, E-cadherin, N-cadherin, and vimentin in BT549 cells. FHL1 overexpression significantly decreased the protein expression of VEGF (Figure 6A and C, p < 0.001), but increased the expression of p53 (Figure 6A and D, p < 0.001) and E-Cadherin (Figure 6A and E, p < 0.001).
BT549 A
FHL1 VEGF p53 E-cadherin N-cadherin Vimentin GAPDH
(44 kD) (21 kD) (53 kD) (97 kD) (130 kD) (54 kD) (36 kD) Scr ambl e + NC
mimics + NC Scr ambl e + FHL 1 mimics + FHL
1
BT549
Relativ e FHL 1 pr ot ein/ GAPDH expr ession l ev el
0 1.5 2.0
0.5 1.0
B BT549
Relativ e VEGF pr ot ein/ GAPDH expr ession l ev el
0 1.5 2.0
0.5 1.0
C BT549
Relativ e p 53 pr ot ein/ GAPDH expr ession l ev el
0 1.5 2.0
0.5 1.0
D
‡
‡ ‡
‡ ‡
‡
§,¶
§,
**
§
BT549
Relativ e E-cadherin pr ot ein/ GAPDH e xpr ession l ev el
0 1.5
0.5 1.0
E BT549
Relativ e N-cadherin pr ot ein/ GAPDH e xpr ession l ev el
0 1.5
0.5 1.0
F BT549
Relativ e vimentin pr ot ein/ GAPDH e xpr ession l ev el
0 1.5
0.5 1.0
G
‡
‡
§,∥
‡
‡
§,
**
‡
‡
§,
**
BT549
Relativ e FHL 1 mRNA expr ession l ev el
0 5
2 4
1 3
H
‡
‡
§,
**
BT549
Relativ e VEGF mRNA expr ession l ev el
0 2.5 2.0 1.5
0.5 1.0
I
‡
‡ §,¶
BT549
Relativ e p 53 mRNA expr ession l ev el
0 2.5 2.0 1.5
0.5 1.0
J
‡
‡
§,¶
BT549
Relativ e E-cadherin mRNA expr ession l ev el
0 2.5 2.0 1.5
0.5 1.0
K
‡
‡
§,
**
BT549
Relativ
e N-cadherin mRNA expr ession l ev el
0 2.0 1.5
0.5 1.0
L
‡
‡ §,¶
BT549
Relativ e vimentin mRNA expr ession l ev el
0 2.0 1.5
0.5 1.0
M
‡
‡
§,¶
Scramble + NC mimics + NC Scramble + FHL1 mimics + FHL1
Figure 6. FHL1 overexpression partially reversed the effect of miR-183-5p overexpression on mRNA and protein levels of FHL1, VEGF, p53, E-cadherin, N-cadherin, and vimentin in BT549 cells. (A-G) The expression of FHL1, VEGF, p53, E-cadherin, N-cadherin, and vimentin proteins in BT549 cells transfected with miR-183-5p mimics or FHL1 or co-transfected with miR-183-5p mimics and FHL1 was quantified via western blotting. (H-M) The expression of FHL1, VEGF, p53, E-cadherin, N-cadherin, and vimentin mRNAs in BT549 cells transfected with miR-183-5p mimics or FHL1 or co-transfected with miR-183-5p mimics and FHL1 was quantified using qRT-PCR.
GAPDH was used as an internal control. The scramble NC is a disrupted sequence of miR-183-5p mimics. The data are shown as mean ± standard deviation.
FHL1 = four and a half LIM protein 1; mRNA = messenger RNA; VEGF = vascular endothelial growth factor; qRT-PCR = quantitative real-time reverse transcription polymerase chain reaction; GAPDH = glyceraldehyde 3-phosphate dehydrogenase; NC = negative control.
* p < 0.05 or
†p < 0.01 or
‡p < 0.001 vs. Scramble + NC.
§p < 0.001 vs. mimics + NC.
∥p < 0.05 or
¶p < 0.01 or ** p < 0.001 vs. Scramble + FHL1.
The protein expression of N-Cadherin (Figure 6A and F, p < 0.001) and vimentin (Figure 6A and G, p < 0.001) was decreased by FHL1 overexpression. miR-183-5p overexpression produced the opposite effects (Figure 6A-G, p < 0.05 or p < 0.01 or p < 0.001). The effect of FHL1 overexpression on mRNA expression of FHL1, VEGF, P53, E-cadherin, N-cadherin, and Vimentin was similar to that of its protein expression (Figure 6H-M, p < 0.001), while miR- 183-5p overexpression produced the opposite effects.
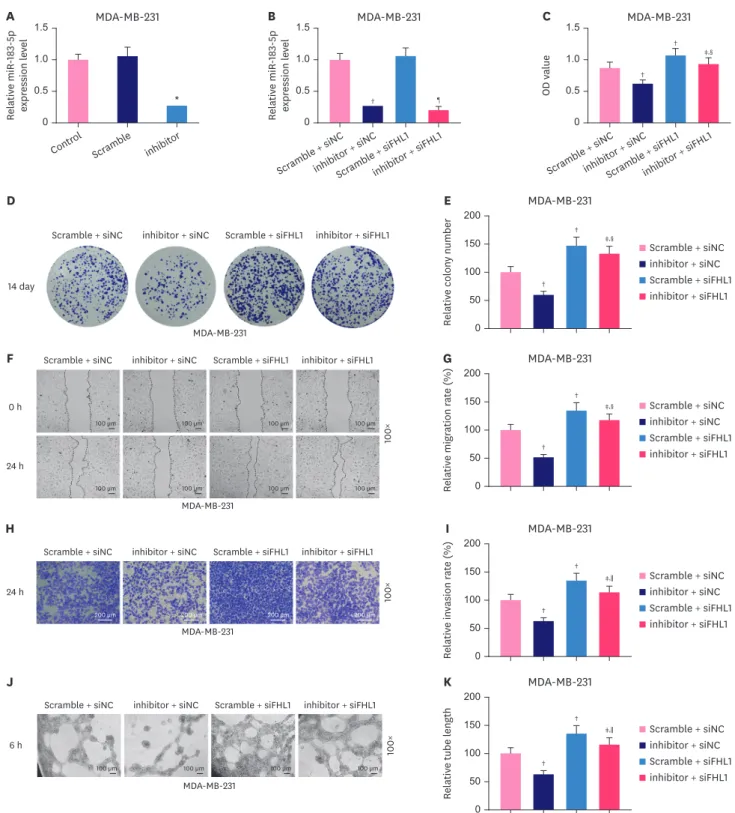
FHL1 silencing partially reversed the inhibitory effect of the miR-183-5p inhibitor on the proliferation, migration, invasion, and tube length of MDA- MB-231 cells
The miR-183-5p inhibitor significantly decreased miR-183-5p expression in MDA-MB-231 cells (Figure 7A, p < 0.001). Transfection with siFHL1 did not alter miR-183-5p expression or reverse the effect of the miR-183-5p inhibitor on miR-183-5p expression (Figure 7B). We also observed that the viability (Figure 7C, p < 0.001), colony number (Figure 7D and E, p <
0.001), migration (Figure 7F and G, p < 0.001), invasion (Figure 7H and I, p < 0.001), and tube length (Figure 7J and K, p < 0.001) of MDA-MB-231 cells were significantly decreased by low expression of miR-183-5p, and these phenotypes were completely reversed by FHL1 downregulation (Figure 7C-K, p < 0.001).
In MDA-MB-231 cells, reducing miR-183-5p expression significantly increased the proteinexpression of FHL1 (Figure 8A and B, p < 0.001), while reducing FHL1 noticeably decreased the expression of FHL1 (Figure 8A and B, p < 0.001), which was partially reversed by the low expression of miR-183-5p (Figure 8A and B, p < 0.001). The results of western blotting revealed that in MDA-MB-231 cells, low expression of FHL1 significantly elevated the expression of VEGF (Figure 8A and C, p < 0.001), but decreased p53 (Figure 8A and D, p < 0.001) and E-Cadherin (Figure 8A and E, p < 0.001), and also increased the protein expression of N-Cadherin (Figure 8A and F, p < 0.001) and vimentin (Figure 8A and G, p < 0.001), while low expression of miR-183-5p produced the opposite effects, and low expression of FHL1 can reverse the effects of the low expression of miR-183-5p (8A-G, p < 0.001). In addition, The effect of low expression of FHL1 on mRNA expression of FHL1, VEGF, P53, E-cadherin, N-cadherin, and Vimentin was similar to that of its protein expression (Figure 8H-M, p < 0.001), while the low expression of miR-183-5p produced the opposite effects.
DISCUSSION
FHL1 is regarded as a tumor suppressor gene and its expression is commonly downregulated in multiple malignant tumors [17]. In this study, FHL1 was found to be lowly expressed in several BC tissues, which was in accordance with the result of a previous study [9].
Additionally, our novel data further revealed that FHL1 was lowly expressed in several BC cells, which was consistent with previous findings and support that FHL1 might be a tumor suppressor gene in BC.
To confirm that FHL1 functioned as a tumor suppressor gene in BC, we primarily explored
the role of FHL1 in the metastasis and angiogenesis of BC cells transfected with siFHL1 or
FHL1. BC metastasis begins from local invasion, spreads into the blood or lymphatic vessels,
and arrives at distal organs [2]. Cancer cell migration and invasion marks the initiation of
cancer metastasis into surrounding tissue and vasculature [18]. Additionally, the sprouting
of endothelial cells is the first step in tumor angiogenesis [2]. In this study, we found that
Scr ambl e + siNC inhibit
or + siNC Scr ambl e + siFHL
1 inhibit
or + siFHL 1 MDA-MB-231
Relativ e miR -183 -5 p expr ession l ev el 0 1.0 1.5
0.5
¶B
†
Scr ambl e + siNC inhibit
or + siNC Scr ambl e + siFHL
1 inhibit
or + siFHL 1 MDA-MB-231
OD val ue
0 1.0 1.5
0.5
‡,§
C
†
†
Contr ol Scr ambl e
inhibit or MDA-MB-231
Relativ e miR -183 -5 p expr ession l ev el 0 1.0 1.5
0.5 *
A
MDA-MB-231
Relativ e col on y number
0 100 200 150
50
†
†
‡,§
E D
Scramble + siNC inhibitor + siNC Scramble + siFHL1 inhibitor + siFHL1
14 day
Scramble + siNC inhibitor + siNC Scramble + siFHL1 inhibitor + siFHL1 MDA-MB-231
MDA-MB-231
Scramble + siNC inhibitor + siNC Scramble + siFHL1 inhibitor + siFHL1
0 h
24 h
F
100×
MDA-MB-231
Relativ e migr ation r at e (%)
0 100 200 150
50
††
‡,§
G
100 µm
100 µm
100 µm
100 µm
100 µm
100 µm
100 µm
100 µm
Scramble + siNC inhibitor + siNC Scramble + siFHL1 inhibitor + siFHL1
H MDA-MB-231
Relativ e in vasion r at e (%)
0 100 200 150
50
†
†
‡,∥
I
Scramble + siNC inhibitor + siNC Scramble + siFHL1 inhibitor + siFHL1
24 h
MDA-MB-231
100×
200 µm 200 µm 200 µm 200 µm
Scramble + siNC inhibitor + siNC Scramble + siFHL1 inhibitor + siFHL1
J MDA-MB-231
Relativ e tube l ength
0 100 200 150
50
†
†
‡,∥
K
Scramble + siNC inhibitor + siNC Scramble + siFHL1 inhibitor + siFHL1
6 h
MDA-MB-231
100×
100 µm 100 µm 100 µm 100 µm
Scramble + siNC inhibitor + siNC Scramble + siFHL1 inhibitor + siFHL1
Figure 7. Low expression of FHL1 partially reversed the inhibitory effect of the low expression of miR-183-5p on the proliferation, migration, invasion, and tube length of MDA-MB-231 cells. (A) MiR-183-5p expression in MDA-MB-231 cells transfected with a miR-183-5p inhibitor was quantified using qRT-PCR. (B) miR-183- 5p expression in MDA-MB-231 cells transfected with a miR-183-5p inhibitor or siFHL1 or co-transfected with miR-183-5p inhibitor and siFHL1 was quantified using qRT-PCR. Viability (C), colony number (D and E), migration rate (F and G), invasion rate (H and I), and tube length (J and K) of MDA-MB-231 cells transfected with a miR-183-5p inhibitor or siFHL1 or co-transfected with a miR-183-5p inhibitor and siFHL1 was measured using CCK-8, colony formation, scratch wounding- healing, Transwell invasion, and tube formation assays, respectively. U6 was used as an internal control. The scramble NC is a disrupted sequence of the miR- 183-5p inhibitor. The data are shown as mean ± standard deviation.
FHL1 = four and a half LIM protein 1; qRT-PCR = quantitative real-time reverse transcription polymerase chain reaction; siFHL1 = siRNAs specifically targeting FHL1; CCK = Cell Counting Kit; NC = negative control.
* p < 0.001 vs. Scramble.
†p < 0.001 vs. Scramble + siNC.
‡p < 0.001 vs. inhibitor + siNC.
§p < 0.05 or
∥p < 0.01 or
¶p < 0.001 vs. Scramble + siFHL1.
FHL1 overexpression suppressed the viability, migration, invasion, and tube formation of BC cells, whereas FHL1 silencing produced the opposite effects. These data suggest that FHL1 functions as a tumor suppressor in the development of BC.
Differentially expressed miRNAs can regulate the same mRNA [19]. Wang et al. [20]
demonstrated that miR-410 is highly expressed in liver and colorectal tumors, and promotes MDA-MB-231
Relativ e FHL 1 pr ot ein/ GAPDH expr ession l ev el
0 1.5 2.0
0.5 1.0
B MDA-MB-231
Relativ e VEGF pr ot ein/ GAPDH expr ession l ev el
0 1.5 2.0
0.5 1.0
C MDA-MB-231
Relativ e p 53 pr ot ein/ GAPDH expr ession l ev el
0 1.5 2.0
0.5 1.0
D
MDA-MB-231 A
FHL1 VEGF p53 E-cadherin N-cadherin Vimentin GAPDH
(44 kD) (21 kD) (53 kD) (97 kD) (130 kD) (54 kD) (36 kD) Scr ambl e + siNC
inhibit or + siNC Scr ambl e + siFHL
1 inhibit or + siFHL
1
†
†
†
†
‡,¶
‡,§
†
† ‡,§
MDA-MB-231
Relativ e E-cadherin pr ot ein/ GAPDH e xpr ession l ev el
0 1.2
0.4 0.8 1.0
0.2 0.6
E MDA-MB-231
Relativ e N-cadherin pr ot ein/ GAPDH e xpr ession l ev el
0 1.5
0.5 1.0
F MDA-MB-231
Relativ e vimentin pr ot ein/ GAPDH e xpr ession l ev el
0 1.5
0.5 1.0
G
†
†
† ‡
‡,¶
†
† ‡,§
*
MDA-MB-231
Relativ e FHL 1 mRNA expr ession l ev el
0 4 5
2 1 3
H MDA-MB-231
Relativ e VEGF mRNA expr ession l ev el
0 1.5 2.0
0.5 1.0
I MDA-MB-231
Relativ e p 53 mRNA expr ession l ev el
0 2 3
1
J
‡,∥
†
†
†
†
‡,§
‡,§
†
†
MDA-MB-231
Relativ e E-cadherin mRNA expr ession l ev el
0 3
1 2
K MDA-MB-231
Relativ
e N-cadherin mRNA expr ession l ev el
0 1.5 2.0
0.5 1.0
L MDA-MB-231
Relativ e miR -183 -5 p expr ession l ev el
0 1.5 2.0
0.5 1.0
M
‡,¶
‡,∥
‡,∥
†
†
†
† †
†