ISSN 0378-6471 (Print)⋅ISSN 2092-9374 (Online)
https://doi.org/10.3341/jkos.2017.58.4.420
Original Article
특발망막전막에서 유리체절제술 전후 망막층별 두께변화와 시력예후와의 관계
The Thickness of Each Retinal Layer and Visual Acuity after Vitrectomy in Idiopathic Epiretinal Membrane
김민환1⋅전찬양2⋅백승국3⋅장영석1⋅이영훈1
Min Hwan Kim, MD1, Chan Yang Jeon, MD2, Seung Kook Baek, MD3, Young Suk Chang, MD1, Young Hoon Lee, MD1
건양대학교 의과대학 안과학교실1, 눈사랑안과의원2, 화순군보건소3 Department of Ophthalmology, Konyang University College of Medicine1, Daejeon, Korea
Eyelove Clinic2, Daejeon, Korea
Hwasun Country Public Health Center3, Hwasun, Korea
Purpose: In this study, we evaluated the thickness of each retinal layer using spectral-domain optical coherence tomography (OCT) and investigated the correlation between the thickness of each retinal layer and postoperative visual acuity in eyes with idiopathic epiretinal membrane (ERM).
Methods: his retrospective study included 46 eyes from 46 patients with idiopathic ERM who underwent pars plana vitrectomy.
Each retinal layer thickness was measured by spectral-domain OCT before operation and at 1, 3, and 6 months after operation.
The thickness of each retinal layer was evaluated in the control group before the operation. We performed an analysis of the changes in thickness of each retinal layer at 6 months after operation and then investigated the correlation between the retinal layer thickness and visual improvement.
Results: Preoperatively, the thickness of the retinal nerve fiber layer (RNFL) in the ERM group showed more increased com- pared with that in the control group, and the thickness of photoreceptors and retinal pigment epithelium were decreased com- pared to those in the control group. At 6 months after the operation, thickness changes were reduced at the RNFL, ganglion cell layer (GCL), inner plexiform layer (IPL), GCL-IPL complex, and outer plexiform layer, while the photoreceptor layer increased compared with the values preoperatively. Differences in the preoperative thickness of GCL between the two groups had a sig- nificant correlation with postoperative visual acuity (r = 0.477, p = 0.008).
Conclusions: Differences in preoperative thickness of the GCL between the two groups had a significant correlation with post- operative visual acuity. The greater was the thickness of the GCL, the worse was the visual outcome.
J Korean Ophthalmol Soc 2017;58(4):420-429
Keywords: Idiopathic epiretinal membrane, Pars plana vitrectomy, Retinal layer thickness, Visual acuity
■Received: 2016. 10. 20. ■ Revised: 2017. 2. 1.
■Accepted: 2017. 3. 18.
■Address reprint requests to Young Hoon Lee, MD
Department of Ophthalmology, Konyang University Hospital,
#158 Gwanjeodong-ro, Seo-gu, Daejeon 35365, Korea Tel: 82-42-600-9258, Fax: 82-42-600-9251
E-mail: [email protected]
ⓒ2017 The Korean Ophthalmological Society
This is an Open Access article distributed under the terms of the Creative Commons Attribution Non-Commercial License (http://creativecommons.org/licenses/by-nc/3.0/) which permits unrestricted non-commercial use, distribution, and reproduction in any medium, provided the original work is properly cited.
망막전막은 황반부의 내경계막 표면에 여러 종류의 세포 들이 증식한 것으로 망막의 주름 및 견인, 황반부종 등을 일으켜 시력저하 및 변형시 등의 증상을 유발하는 질환이 다.1-4 망막전막의 치료는 1978년 Machemer5가 처음으로 유리체절제술을 통한 망막전막의 제거를 보고한 이후 성공 적인 유리체절제술의 결과들이 발표되었고, 시력저하 및 변형시 등의 증상이 동반된 경우에는 수술적 제거가 치료
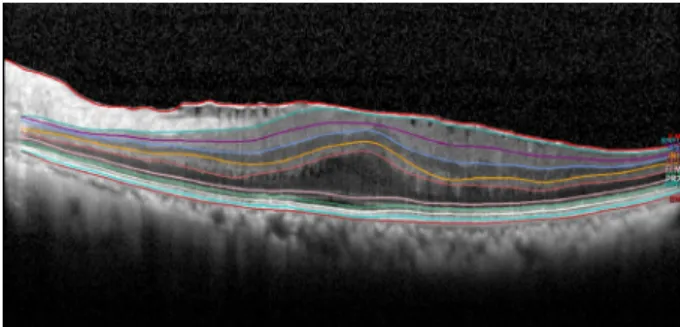
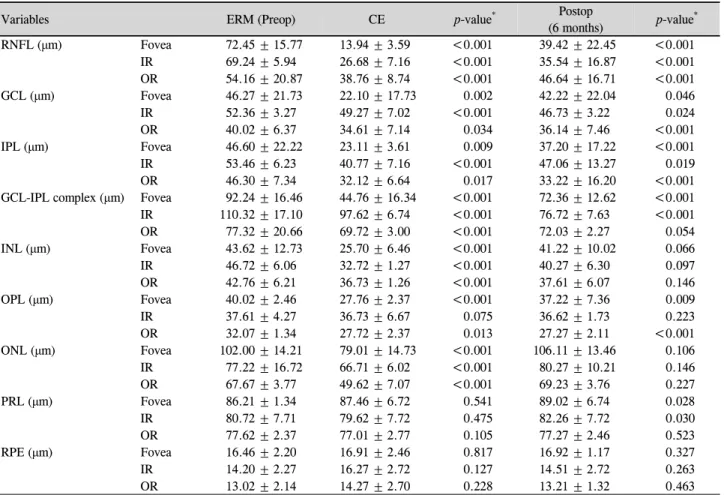
Figure 1. Representative image of retinal layer division de-
termined by the new segmentation application of the spectralis optical coherence tomography in epiretinal membrane (Segmentation Technology; Heidelberg Engineering, Inc., Heidelberg, Germany). 10 layers: 1 = inner limiting mem- brane, 2 = retinal nerve fiber layer, 3 = ganglion cell layer, 4 = inner plexiform layer, 5 = inner nuclear layer, 6 = outer plexiform layer, 7 = external limiting membrane, 8 = photo- receptor, 9 = retinal pigment epithelium, 10 = Bruch’s membrane.로 선호되고 있다.6-8
빛간섭단층촬영은 비침습적인 방법으로 망막의 구조적 인 변화를 확인하고 망막의 두께 및 부피를 정량적으로 측 정할 수 있는 고해상도 단층검사로 1991년 처음 소개된 이 래로 여러 망막질환의 진단 및 연구에 널리 사용되고 있다.
최근에는 스펙트럼영역 빛간섭단층촬영기(spectral domain coherence tomography, SD-OCT)의 도입으로 특정 망막층 의 두께측정이 가능해지면서 특정 망막층과 예후와의 관계 에 대한 연구들이 보고되었다.9-16
망막전막에서도 유리체절제술 후 신경절세포-내망상층 의 두께감소와 시력예후에 대한 연구들이 최근 발표되었 고,12 내핵층의 두께와 변형시와의 연관성에 대한 연구도 보고되었다.13 그러나 현재까지의 이러한 빛간섭단층촬영 기를 통한 망막전막의 연구들은 망막의 특정층에 국한된 두께변화와 예후에 대한 분석이 주를 이루어 왔다.
이에 본 연구에서는 단안 특발망막전막에서 내경계막 및 외경계막을 제외한 스펙트럼영역 빛간섭단층촬영기로 측 정이 가능한 모든 망막층들의 두께를 측정하여 수술 전 대 상군의 정상안과 비교하고, 유리체절제술 후 6개월째 두께 변화를 분석하여 수술 후 시력예후와의 관계에 대해 알아 보고자 하였다.
대상과 방법
2013년 1월부터 2015년 12월까지 건양대학교병원에서 단안 특발망막전막으로 진단받고 유리체절제술을 시행한 환자 중 6개월 이상 경과관찰이 가능하였던 환자를 대상으 로 의무기록을 후향적으로 분석하였다. 포도막염, 외상, 망 막혈관질환, 망막박리수술 등에 의한 이차성 망막전막과 양안 특발망막전막은 대상군에서 제외하였다. 당뇨망막병 증, 나이관련 황반변성, 녹내장, 고도근시(6디옵터 이상의 굴절이상) 등 시력에 영향을 미칠 수 있는 안과적 질환이 있는 환자도 제외하였고, 중심부각막혼탁, Lens opacities classification system (LOCS) III 분류에 따른 NO3 이상의 백내장 등 빛간섭단층촬영 신호강도에 영향을 미칠 수 있 는 환자, 수술 중 발견된 망막열공 및 주변부망막변성 등으 로 가스주입술을 시행한 환자 또한 대상군에서 제외하였다.
또한 수술 전 빛간섭단층촬영상 유리체황반견인증후군이 동반된 경우나 표층황반원공, 가성층판원공이 있는 경우도 제외하였으며, 시세포 내절/외절 접합부에서 고음영 반사띠 가 연속적으로 관찰되지 않는 결손이 있는 경우도 망막두 께와 수술 후 시력 간의 상관관계 분석을 위해 대상에서 제 외하였다. 백내장수술로 인한 시력 및 망막층별 두께측정 의 영향을 배제하기 위해 인공수정체안의 결과를 별도로
분석하였다. 본 연구는 헬싱키 선언을 준수하였고 본원 윤 리 위원회의 승인을 받아(2016-11-011) 진행하였다. 통계분 석은 SPSS for Windows software version 18.0 (SPSS Inc., Chicago, IL, USA)을 이용하여 단변량 분석은 Wilcoxon signed rank test, Friedman test로 검정하였고, 인자들 사이 의 상관관계 분석은 Spearman correlation test를 시행하였 으며, p-value가 0.05 미만인 경우를 통계적으로 유의한 것 으로 판정하였다.
안과검사
모든 환자들은 수술 전, 수술 후 1, 3, 6개월째 안과검사 를 시행하였다. 최대교정시력, 현성굴절검사, 안압검사, 세 극등현미경검사, 안저검사 및 빛간섭단층촬영을 시행하였 고, 반대쪽 정상안은 수술 전 빛간섭단층촬영을 시행하였 다. 최대교정시력은 스넬렌 시력표로 측정 후 Logarithm of the minimum angle of resolution (logMAR)로 변환하였다.
빛간섭단층촬영은 대상자 모두 Heidelberg Spectralis® (Spectralis; Heidelberg Engineering, Heidelberg, Germany) 로 측정하였으며, Eye tracking을 하는 automatic real time 기능을 사용하여 눈 움직임에 의한 오류를 보정하였다. 자동 적으로 망막의 10개층을 구분지어 주는 Heidelberg eye soft- ware (version 1.9.10.0; Heidelberg Enginering, Heidelberg, Germany)에서 제공하는 영상분할과 황반두께지도 기능을 이용하여 각 층의 두께를 측정하였다(Fig. 1). Early treat- ment of diabetic retinopathy study subfield (ETDRS) sub- field 위치에 심한 차이를 보일 경우 숙련된 검사자가 혈관 의 형태를 포함한 주변 구조물을 참고하여 위치를 보정하 였으며, 망막 10개층의 자동으로 설정된 경계선 또한 검토
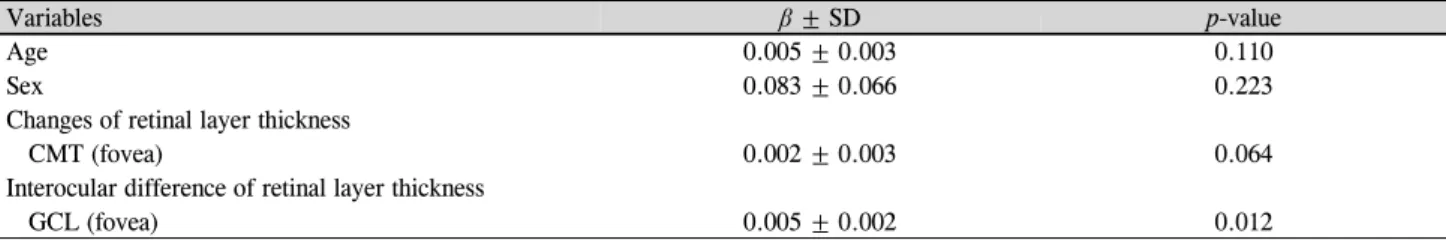
Figure 2. Early Treatment of Diabetic Retinopathy Study
(ETDRS) subfield. Central circle: fovea (F). Inner ring: supe- rior inner (SI) + nasal inner (NI) + inferior inner (II) + tem- poral inner (TI). Outer ring: superior outer (SO) + nasal outer (NO) + inferior outer (IO) + temporal outer (TO). ETDRS subfields within standard 1-, 3-, and 6-mm-diameter concen- tric circles at the right used for reporting retinal thickness.Table 1. Demographic characteristics and clinical features of the patients
Characteristics Value
Patients 46
Gender (male:female) 24:22
Age (years) 68.30 ± 11.13
Preoperative lens state (phakic:pseudophakic) 16:30
Phacovitrectomy:Vitrectomy 16:30
BCVA (logMAR) (preoperative:postoperative) 0.49 ± 0.36:0.26 ± 0.22*
Complications and recurrence 0
Values are presented as mean ± SD unless otherwise indicated.
SD = standard deviation; BCVA = best corrected visual acuity.
*p-value < 0.05, Wilcoxon signed rank test.
하여 오류가 있는 경우에 한해서 수동으로 보정하였다. 황 반두께지도는 중심와를 중심으로 6 mm 직경 이내의 황반 부 각 층의 두께를 ETDRS 9개 구역으로 나누어 계산하였 고, 이를 기반으로 내장된 공식에 의해 자동으로 각층의 두 께를 측정하였다. ETDRS subfield는 중심오목을 기준으로 하는 1 mm, 3 mm, 6 mm 직경의 3개의 동심원을 만들고 중심 원(central circle), 안쪽 원(inner ring), 바깥쪽 원(outer ring)으로 구분한 후 안쪽 원과 바깥쪽 원 구역은 각각 상 측, 비측, 하측, 이측의 4분역으로 다시 나누어져 총 9개의 영역으로 구성되어 있다(Fig. 2).
수술
수술은 숙련된 두 명의 술자에 의해 Constellation® vision system (Alcon, Fort Worth, TX, USA)을 이용하여 25게이
지 경결막 무봉합 유리체절제술을 시행하였다. 3개의 모양 체 평면부 공막창을 통한 표준 3 port 평면부 유리체절제술 을 시행하였고, 눈 속 집게를 이용하여 망막전막을 제거하 였다. 필요에 따라 Triamcinolone acetonide를 도포 후 망막 전막을 잘 보이도록 한 이후에 제거하였으며, 망막전막 제 거술 시행 후 인도시아닌그린용액을 사용하여 내경계막 제 거 여부를 확인하였다. 수술 전 LOCS III 분류에 따른 중등 도의 핵백내장(NO1, NO2)이 있는 경우, 백내장수술을 동 시에 시행하였으며 내경계막제거술은 46안 모두에서 시행 하지 않았다.
결 과
전체 연구대상은 총 46명 46안이었고 남자는 24명(52%), 여자는 22명(48%)이었다. 연령은 34세에서 83세 사이로 평 균 68.30 ± 11.13세였다. 46안 중 망막전막안과 정상안이 모두 수정체안인 16안에서는 백내장수술을 동시에 시행하 였다. 술 후 경과관찰 기간 동안 합병증이나 망막전막의 재 발은 발견되지 않았다(Table 1). 술 전 평균 최대교정시력 은 0.49 ± 0.36 logMAR였고, 수술 후 6개월째 평균 최대교 정시력은 0.26 ± 0.22 logMAR로 유의한 시력변화가 관찰 되었다(p<0.001).
수술 전 정상안과의 비교
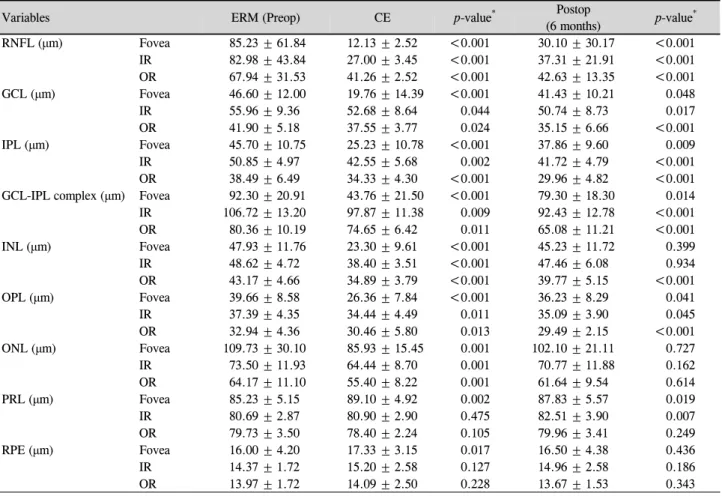
수술 전 망막전막안의 중심망막두께는 평균 485.83 ± 86.30 μm였고, 정상안의 평균두께는 274.03 ± 39.75 μm로 망막전막안에서 유의하게 두꺼웠으며, 안쪽 원, 바깥쪽 원 영역도 망막전막안에서 유의하게 두꺼웠다(p<0.001, Table 2). 정상안과 비교하여 망막신경섬유층이 가장 많이 두꺼웠 고, 시세포층과 망막색소상피층은 정상안에 비해 얇았으며, 8개 모든 층에서 정상안과 통계적으로 유의한 차이를 보였 다(Table 3)
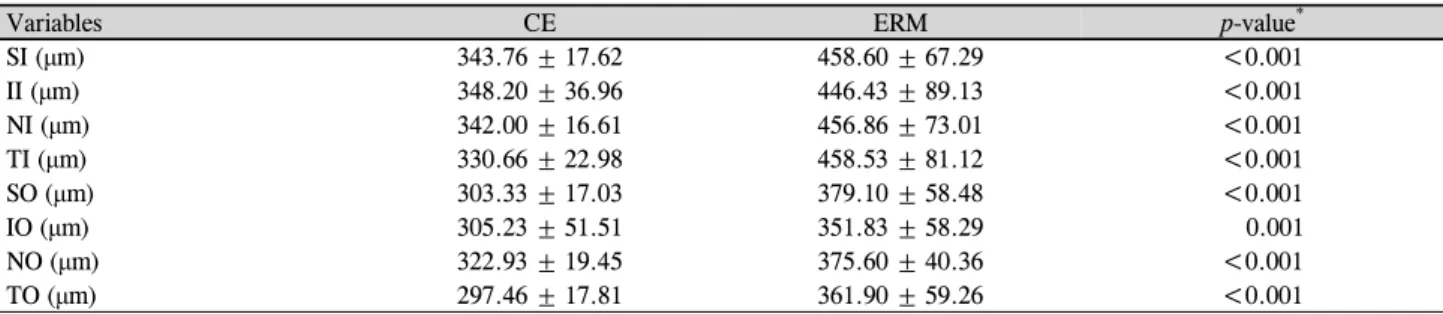
ETDRS subfield에 따른 망막두께 비교에서 망막전막안 은 정상안에 비해 안쪽 원과 바깥쪽 원의 모든 영역에 통계
Table 2. Comparisons of the average retinal layer thickness in the preoperative epiretinal membrane (ERM) eye to the unaffected
contralateral eye and average retinal thickness in the ERM eye before and after surgeryVariables Preop CE p-value* Postop
(6 months) p-value*
Fovea (μm) 485.83 ± 86.30 274.03 ± 39.75 <0.001 389.90 ± 54.15 <0.001
Inner ring (μm) 431.48 ± 59.72 330.44 ± 21.57 <0.001 363.74 ± 33.07 <0.001
Outer ring (μm) 367.13 ± 42.45 307.27 ± 21.02 <0.001 318.78 ± 24.62 <0.001
Values are presented as mean ± SD unless otherwise indicated.
SD = Standard deviation; Preop = preoperative; CE = Contralateral eye; Postop = postoperative.
*Wilcoxon signed rank test.
Table 3. Comparison between the average thickness of the each retinal layer in the preoperative epiretinal membrane (ERM) eye and
the unaffected contralateral eye and changes of the each retinal layer thickness in the ERM eye at 6 months after surgeryVariables ERM (Preop) CE p-value* Postop
(6 months) p-value*
RNFL (μm) Fovea 85.23 ± 61.84 12.13 ± 2.52 <0.001 30.10 ± 30.17 <0.001
IR 82.98 ± 43.84 27.00 ± 3.45 <0.001 37.31 ± 21.91 <0.001
OR 67.94 ± 31.53 41.26 ± 2.52 <0.001 42.63 ± 13.35 <0.001
GCL (μm) Fovea 46.60 ± 12.00 19.76 ± 14.39 <0.001 41.43 ± 10.21 0.048
IR 55.96 ± 9.36 52.68 ± 8.64 0.044 50.74 ± 8.73 0.017
OR 41.90 ± 5.18 37.55 ± 3.77 0.024 35.15 ± 6.66 <0.001
IPL (μm) Fovea 45.70 ± 10.75 25.23 ± 10.78 <0.001 37.86 ± 9.60 0.009
IR 50.85 ± 4.97 42.55 ± 5.68 0.002 41.72 ± 4.79 <0.001
OR 38.49 ± 6.49 34.33 ± 4.30 <0.001 29.96 ± 4.82 <0.001
GCL-IPL complex (μm) Fovea 92.30 ± 20.91 43.76 ± 21.50 <0.001 79.30 ± 18.30 0.014
IR 106.72 ± 13.20 97.87 ± 11.38 0.009 92.43 ± 12.78 <0.001
OR 80.36 ± 10.19 74.65 ± 6.42 0.011 65.08 ± 11.21 <0.001
INL (μm) Fovea 47.93 ± 11.76 23.30 ± 9.61 <0.001 45.23 ± 11.72 0.399
IR 48.62 ± 4.72 38.40 ± 3.51 <0.001 47.46 ± 6.08 0.934
OR 43.17 ± 4.66 34.89 ± 3.79 <0.001 39.77 ± 5.15 <0.001
OPL (μm) Fovea 39.66 ± 8.58 26.36 ± 7.84 <0.001 36.23 ± 8.29 0.041
IR 37.39 ± 4.35 34.44 ± 4.49 0.011 35.09 ± 3.90 0.045
OR 32.94 ± 4.36 30.46 ± 5.80 0.013 29.49 ± 2.15 <0.001
ONL (μm) Fovea 109.73 ± 30.10 85.93 ± 15.45 0.001 102.10 ± 21.11 0.727
IR 73.50 ± 11.93 64.44 ± 8.70 0.001 70.77 ± 11.88 0.162
OR 64.17 ± 11.10 55.40 ± 8.22 0.001 61.64 ± 9.54 0.614
PRL (μm) Fovea 85.23 ± 5.15 89.10 ± 4.92 0.002 87.83 ± 5.57 0.019
IR 80.69 ± 2.87 80.90 ± 2.90 0.475 82.51 ± 3.90 0.007
OR 79.73 ± 3.50 78.40 ± 2.24 0.105 79.96 ± 3.41 0.249
RPE (μm) Fovea 16.00 ± 4.20 17.33 ± 3.15 0.017 16.50 ± 4.38 0.436
IR 14.37 ± 1.72 15.20 ± 2.58 0.127 14.96 ± 2.58 0.186
OR 13.97 ± 1.72 14.09 ± 2.50 0.228 13.67 ± 1.53 0.343
Values are presented as mean ± SD unless otherwise indicated.
SD = Standard deviation; Preop = preoperative; CE = contralateral eye; Postop = postoperative; RNFL =retinal nerve fiber layer; IR = in- ner ring; OR = outer ring; GCL = ganglion cell layer; IPL = inner plexiform layer; INL = inner nuclear layer; OPL =outer plexiform layer;
ONL =outer nuclear layer; PRL =photoreceptor layer; RPE = retinal pigment epithelium.
*Wilcoxon signed rank test.
적으로 유의하게 두꺼웠으며, 안쪽 원의 망막두께가 바깥 쪽 원보다 더 두꺼웠다(Table 4).
수술 후 6개월째 망막두께 변화
수술 후 6개월째 중심망막두께는 평균 389.90 ± 54.15 μm 로 수술 전과 비교해 유의한 감소를 보였으며, 안쪽 원, 바깥 쪽 원 모두 수술 후 유의하게 감소하였다(p<0.001, Table 2).
수술 후 1개월째 평균두께는 435.83 ± 64.06 μm, 3개월째 평균 두께는 403.20 ± 45.76 μm로 수술 후 6개월 동안 지속 적인 중심망막두께의 감소가 관찰되었으며, 가장 많은 감소 는 수술 후 1개월째에 관찰되었다(Table 5). 수술 후 6개월 째 망막층별 두께는 망막신경섬유층, 신경절세포층, 내망상 층, 신경절세포-내망상층, 외망상층의 두께가 수술 전과 비 교하여 유의하게 감소하였으며, 망막신경섬유층이 가장 많
Table 4. Interocular differences between the retinal thickness in the preoperative epiretinal membrane (ERM) eye and the unaffected
contralateral eye according to the Early Treatment of Diabetic Retinopathy Study (ETDRS) subfieldVariables CE ERM p-value*
SI (μm) 343.76 ± 17.62 458.60 ± 67.29 <0.001
II (μm) 348.20 ± 36.96 446.43 ± 89.13 <0.001
NI (μm) 342.00 ± 16.61 456.86 ± 73.01 <0.001
TI (μm) 330.66 ± 22.98 458.53 ± 81.12 <0.001
SO (μm) 303.33 ± 17.03 379.10 ± 58.48 <0.001
IO (μm) 305.23 ± 51.51 351.83 ± 58.29 0.001
NO (μm) 322.93 ± 19.45 375.60 ± 40.36 <0.001
TO (μm) 297.46 ± 17.81 361.90 ± 59.26 <0.001
Values are presented as mean ± SD unless otherwise indicated.
SD = standard deviation; CE = contralateral eye; SI = superior inner; II = inferior inner; NI = nasal inner; TI = temporal inner; SO = supe- rior outer; IO = inferior outer; NO = nasal outer; TO = temporal outer.
*Wilcoxon signed rank test.
Table 5. Changes of the average foveal thickness of each retinal layer before and after epiretinal membrane (ERM) surgery
Variables Preop 1 month 3 months 6 months p-value*
CMT 485.83 ± 86.30 435.83 ± 64.06 403.20 ± 47.76 389.90 ± 54.15 <0.001
RNFL 85.23 ± 61.84 50.60 ± 48.84 37.60 ± 35.36 30.10 ± 30.17 <0.001
GCL 46.60 ± 12.00 45.23 ± 14.87 43.30 ± 11.29 41.43 ± 10.21 <0.001
IPL 45.70 ± 10.75 47.16 ± 13.01 39.73 ± 8.42 37.86 ± 9.60 <0.001
GCL-IPL complex 92.30 ± 20.91 95.06 ± 25.94 82.13 ± 18.13 79.30 ± 18.30 0.002
INL 47.93 ± 11.76 52.73 ± 10.69 49.90 ± 9.74 45.23 ± 11.72 0.072
OPL 39.66 ± 8.58 41.36 ± 10.45 37.03 ± 8.92 36.23 ± 8.29 0.043
ONL 109.73 ± 30.10 104.83 ± 21.74 109.10 ± 23.59 102.10 ± 21.11 0.212
PRL 85.23 ± 5.15 85.73 ± 5.00 87.80 ± 6.76 87.83 ± 5.57 0.009
RPE 16.00 ± 4.20 15.06 ± 2.34 16.50 ± 4.27 16.50 ± 4.38 0.520
Values are presented as mean ± SD unless otherwise indicated.
SD = standard deviation; Preop = preoperative; CMT = central macular thickness; RNFL = retinal nerve fiber layer; GCL = ganglion cell layer; IPL = inner plexiform layer; INL = inner nuclear layer; OPL = outer plexiform layer; ONL = outer nuclear layer; PRL = photo- receptor layer; RPE = retinal pigment epithelium.
*Friedman test.
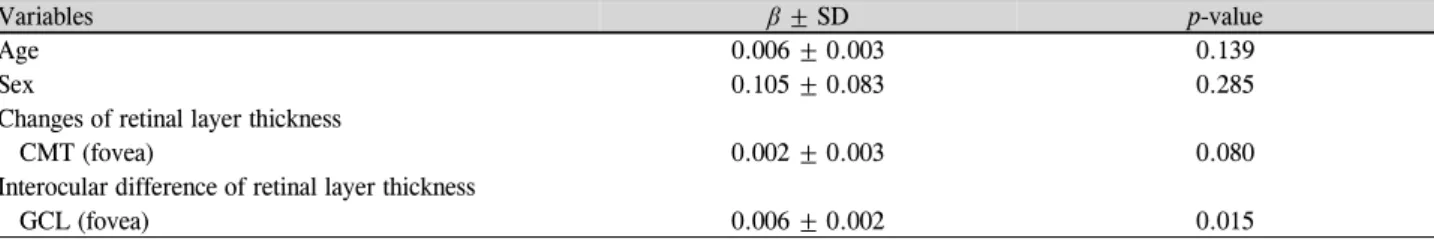
Figure 3. Longitudinal changes of the average foveal thick-
ness of each retinal layer before and after epiretinal membrane surgery. RNFL =retinal nerve fiber layer; GCL =ganglion cell layer; IPL =inner plexiform layer; INL =inner nuclear layer; OPL =outer plexiform layer; ONL =outer nuclear lay- er; PRL = photoreceptor; RPE = retinal pigment epithelium.이 감소하였고, 시세포층은 유의하게 증가하였다(Table 3, Fig. 3). 인공수정체안인 30안의 두께변화 역시 전체 환자
의 결과와 유사하게 망막신경섬유층, 신경절세포층, 내망상 층, 신경절세포-내망상층, 외망상층은 수술 전과 비교해 유 의하게 감소하였으며, 시세포층은 유의하게 증가하였다 (Table 6).
시력예후와 상관관계
시력예후와 ETDRS subfield에 따른 망막두께와의 상관 관계를 알아보기 위해 수술 전후 망막두께 차이, 수술 전 망막전막안과 정상안의 망막두께 차이와 수술 후 6개월째 최대교정시력 간에 상관관계를 분석하였다. Spearman 상관 분석을 통해 분석한 결과, 수술 전후 망막전막안에서 중심 오목영역의 황반중심 두께차이, 수술 전 망막전막안과 정 상안 간의 중심오목영역의 신경절세포층의 두께차이가 수 술 후 최대교정시력과 유의한 상관관계를 보였으며, 두께 차이가 클수록 수술 후 시력예후가 불량했다(Table 7). 나 이, 성별과 위의 두 가지 인자들을 대상으로 다변량 선형회 귀분석을 시행한 결과 수술 후 시력은 중심오목영역의 신
Table 6. Comparison between the average thickness of the each retinal layer in the preoperative epiretinal membrane (ERM) eye and
the unaffected contralateral eye and changes of the each retinal layer thickness in the ERM eye at 6 months after surgery on pseudo- phakic eyesVariables ERM (Preop) CE p-value* Postop
(6 months) p-value*
RNFL (μm) Fovea 72.45 ± 15.77 13.94 ± 3.59 <0.001 39.42 ± 22.45 <0.001
IR 69.24 ± 5.94 26.68 ± 7.16 <0.001 35.54 ± 16.87 <0.001
OR 54.16 ± 20.87 38.76 ± 8.74 <0.001 46.64 ± 16.71 <0.001
GCL (μm) Fovea 46.27 ± 21.73 22.10 ± 17.73 0.002 42.22 ± 22.04 0.046
IR 52.36 ± 3.27 49.27 ± 7.02 <0.001 46.73 ± 3.22 0.024
OR 40.02 ± 6.37 34.61 ± 7.14 0.034 36.14 ± 7.46 <0.001
IPL (μm) Fovea 46.60 ± 22.22 23.11 ± 3.61 0.009 37.20 ± 17.22 <0.001
IR 53.46 ± 6.23 40.77 ± 7.16 <0.001 47.06 ± 13.27 0.019
OR 46.30 ± 7.34 32.12 ± 6.64 0.017 33.22 ± 16.20 <0.001
GCL-IPL complex (μm) Fovea 92.24 ± 16.46 44.76 ± 16.34 <0.001 72.36 ± 12.62 <0.001
IR 110.32 ± 17.10 97.62 ± 6.74 <0.001 76.72 ± 7.63 <0.001
OR 77.32 ± 20.66 69.72 ± 3.00 <0.001 72.03 ± 2.27 0.054
INL (μm) Fovea 43.62 ± 12.73 25.70 ± 6.46 <0.001 41.22 ± 10.02 0.066
IR 46.72 ± 6.06 32.72 ± 1.27 <0.001 40.27 ± 6.30 0.097
OR 42.76 ± 6.21 36.73 ± 1.26 <0.001 37.61 ± 6.07 0.146
OPL (μm) Fovea 40.02 ± 2.46 27.76 ± 2.37 <0.001 37.22 ± 7.36 0.009
IR 37.61 ± 4.27 36.73 ± 6.67 0.075 36.62 ± 1.73 0.223
OR 32.07 ± 1.34 27.72 ± 2.37 0.013 27.27 ± 2.11 <0.001
ONL (μm) Fovea 102.00 ± 14.21 79.01 ± 14.73 <0.001 106.11 ± 13.46 0.106
IR 77.22 ± 16.72 66.71 ± 6.02 <0.001 80.27 ± 10.21 0.146
OR 67.67 ± 3.77 49.62 ± 7.07 <0.001 69.23 ± 3.76 0.227
PRL (μm) Fovea 86.21 ± 1.34 87.46 ± 6.72 0.541 89.02 ± 6.74 0.028
IR 80.72 ± 7.71 79.62 ± 7.72 0.475 82.26 ± 7.72 0.030
OR 77.62 ± 2.37 77.01 ± 2.77 0.105 77.27 ± 2.46 0.523
RPE (μm) Fovea 16.46 ± 2.20 16.91 ± 2.46 0.817 16.92 ± 1.17 0.327
IR 14.20 ± 2.27 16.27 ± 2.72 0.127 14.51 ± 2.72 0.263
OR 13.02 ± 2.14 14.27 ± 2.70 0.228 13.21 ± 1.32 0.463
Values are presented as mean ± SD unless otherwise indicated.
SD = Standard deviation; Preop = preoperative; CE = contralateral eye; Postop = postoperative; RNFL = retinal nerve fiber layer; IR = inner ring; OR = outer ring; GCL = ganglion cell layer; IPL = inner plexiform layer; INL = inner nuclear layer; OPL = outer plexiform layer; ONL = outer nuclear layer; PRL = photoreceptor layer; RPE = retinal pigment epithelium.
*Wilcoxon signed rank test.
경절세포층 두께차이에만 영향을 받는 것으로 나타났다 (p=0.012, Table 8). 인공수정체안인 30안의 시력예후와 상 관관계 역시 수술 후 시력은 중심오목구역의 신경절세포층 두께차이에만 영향을 받는 것으로 나타났다(p=0.015, Table 9, 10).
고 찰
망막전막 수술 후 시력에 영향을 주는 인자로 수술 전 시 력, 이환 기간, 술 전 망막두께 등 지금까지 많은 예후 인자 들이 보고되었다.17-21 최근에는 스펙트럼영역 빛간섭단층촬 영기의 발달로 높은 해상도와 빠른 영상 처리 기술로 망막 내 미세구조를 기존의 빛간섭단층촬영기보다 더 자세히 관 찰할 수 있게 되어 황반질환의 시력예후 평가에 유용해지 면서 시세포내절/외절 접합부(inner segment/outer segment
junction)와 Cone outer segment tip line의 결손 등 망막외 층의 구조적 변화와 시력예후와의 관계에 대한 연구들이 보고되었다.9-11 또한 신경절세포-내망상층과 내핵층의 두께 와 예후와의 관계에 대한 연구 등도 발표되었다.12,13,16 그러 나 현재까지의 이러한 빛간섭단층촬영을 통한 망막전막의 연구들은 망막의 특정층의 구조적 변화 또는 두께에 대한 분석이 주를 이루고 있다.
본 저자들은 Heidelberg eye software를 이용하여 특발망 막전막에서 내경계막 및 외경계막을 제외한 스펙트럼영역 빛간섭단층촬영기로 측정이 가능한 모든 층들의 두께를 측 정하여 수술 후 시력예후와의 관계에 대해 알아본 국내 첫 보고의 의미가 있을 것으로 생각된다.
본 연구에서 망막전막안과 정상안과의 망막층별 두께차 이는 망막신경섬유층에서 가장 크고 바깥층으로 갈수록 줄 어드는 경향을 보이다가 시세포층과 망막색소상피층에서
Table 7. Correlation between the visual prognosis and changes of retinal layer thickness in epiretinal membrane (ERM) eye and inter-
ocular difference of retinal layer thicknessVariables Changes of retinal layer thickness Interocular difference of retinal layer thickness
r p-value* r p-value*
CMT Fovea 0.520 0.003 0.019 0.921
IR 0.344 0.063 0.028 0.882
OR 0.321 0.084 0.088 0.644
RNFL Fovea 0.019 0.922 0.022 0.907
IR 0.116 0.543 0.026 0.891
OR 0.001 0.996 0.086 0.652
GCL Fovea 0.157 0.408 0.477 0.008
IR 0.120 0.528 0.014 0.940
OR 0.095 0.619 0.341 0.065
IPL Fovea 0.067 0.726 0.050 0.794
IR 0.162 0.393 0.024 0.898
OR 0.052 0.785 0.101 0.594
GCL-IPL complex Fovea 0.102 0.592 0.132 0.487
IR 0.054 0.779 0.083 0.662
OR 0.084 0.660 0.021 0.910
INL Fovea 0.026 0.892 0.087 0.649
IR 0.026 0.891 0.260 0.116
OR 0.018 0.926 0.247 0.188
OPL Fovea 0.104 0.584 0.001 0.997
IR 0.240 0.202 0.040 0.833
OR 0.290 0.120 0.189 0.317
ONL Fovea 0.005 0.980 0.030 0.874
IR 0.311 0.094 0.034 0.859
OR 0.347 0.060 0.168 0.374
PRL Fovea -0.054 0.776 -0.178 0.347
IR -0.221 0.240 -0.184 0.330
OR -0.185 0.327 0.161 0.394
RPE Fovea -0.005 0.971 -0.265 0.157
IR -0.265 0.157 -0.057 0.766
OR 0.075 0.585 -0.166 0.381
CMT = central macular thickness; IR = inner ring; OR = outer ring; RNFL = retinal nerve fiber layer; GCL = ganglion cell layer; IPL = inner plexiform layer; INL = inner nuclear layer; OPL = outer plexiform layer; ONL = outer nuclear layer; PRL = photoreceptor layer; RPE
= retinal pigment epithelium.
*Spearman correlation test.
Table 8. Multivariate linear regression analysis of variables associated with visual prognosis
Variables β ± SD p-value
Age 0.005 ± 0.003 0.110
Sex 0.083 ± 0.066 0.223
Changes of retinal layer thickness
CMT (fovea) 0.002 ± 0.003 0.064
Interocular difference of retinal layer thickness
GCL (fovea) 0.005 ± 0.002 0.012
Values are presented as mean ± SD unless otherwise indicated. Overall R2 = 0.707.
SD = standard deviation; CMT = central macular thickness; GCL =ganglion cell layer.
는 정상안에 비해 감소하였다(Table 3). Arichika et al15은 유리체망막 경계면에서 내망상층까지를 망막내층으로 내 핵층에서 망막색소상피층까지를 망막외층으로 분류하여 망막전막 환자 30안과 정상 25안을 비교하였는데, 망막내 층, 망막외층 모두 정상안에 비해 유의하게 두께가 증가하
였고 특히 망막내층의 두께증가가 망막외층보다 현저하게 크다고 보고하였다. 또한 Koo et al16은 22명의 환자에서 본 원의 연구와 같이 수술 전 망막전막안과 다른 쪽 정상안과 의 두께차이를 비율로 분석하였는데, 망막내층에 해당하는 망막신경섬유층, 신경절세포층, 내망상층, 내핵층이 망막외
Table 9. Correlation between the visual prognosis and changes of retinal layer thickness in epiretinal membrane (ERM) eye and in-
terocular difference of retinal layer thickness on pseudophakic eyesVariables Changes of retinal layer thickness Interocular difference of retinal layer thickness
r p-value* r p-value*
CMT Fovea 0.413 0.002 0.015 0.733
IR 0.273 0.058 0.022 0.702
OR 0.255 0.066 0.070 0.512
RNFL Fovea 0.016 0.822 0.019 0.809
IR 0.103 0.484 0.023 0.794
OR 0.001 0.888 0.076 0.581
GCL Fovea 0.175 0.455 0.532 0.009
IR 0.134 0.589 0.015 0.989
OR 0.106 0.691 0.380 0.072
IPL Fovea 0.059 0.647 0.044 0.708
IR 0.144 0.350 0.026 0.993
OR 0.046 0.700 0.112 0.663
GCL-IPL complex Fovea 0.090 0.528 0.117 0.543
IR 0.048 0.870 0.074 0.739
OR 0.093 0.588 0.274 0.855
INL Fovea 0.032 0.709 0.008 0.067
IR 0.028 0.886 0.323 0.114
OR 0.001 0.921 0.220 0.209
OPL Fovea 0.092 0.652 0.002 0.889
IR 0.214 0.225 0.044 0.743
OR 0.258 0.134 0.168 0.354
ONL Fovea 0.006 0.875 0.026 0.976
IR 0.347 0.083 0.030 0.959
OR 0.309 0.067 0.187 0.333
PRL Fovea -0.048 0.866 -0.158 0.387
IR -0.197 0.268 -0.201 0.368
OR -0.206 0.365 0.143 0.391
RPE Fovea -0.006 0.866 -0.236 0.175
IR -0.236 0.175 -0.063 0.683
OR 0.066 0.653 -0.148 0.425
CMT = central macular thickness; IR = inner ring; OR = outer ring; RNFL = retinal nerve fiber layer; GCL = ganglion cell layer; IPL = inner plexiform layer; INL = inner nuclear layer; OPL = outer plexiform layer; ONL = outer nuclear layer; PRL = photoreceptor layer; RPE
= retinal pigment epithelium.
*Spearman correlation test.
Table 10. Multivariate linear regression analysis of variables associated with visual prognosis on pseudophakic eyes
Variables β ± SD p-value
Age 0.006 ± 0.003 0.139
Sex 0.105 ± 0.083 0.285
Changes of retinal layer thickness
CMT (fovea) 0.002 ± 0.003 0.080
Interocular difference of retinal layer thickness
GCL (fovea) 0.006 ± 0.002 0.015
Values are presented as mean ± SD unless otherwise indicated. Overall R2 = 0.775.
SD = standard deviation; CMT = central macular thickness; GCL = ganglion cell layer.
층에 해당하는 외망상층, 외핵층보다 유의하게 두꺼워졌다 고 보고하였다. 망막전막에서 내경계막 표면에 여러 종류 의 세포들이 증식하면서 견인력이 발생하는 것으로 미루어 볼 때 망막외층에 대한 변화보다는 망막내층의 변화에 큰 영향을 미쳤을 것으로 생각되며, 본 연구에서도 망막내층
의 변화가 망막외층의 변화보다 큰 것으로 나타났다. 그러 나 수술 전 망막전막안에서 시세포층의 두께가 정상안에서 시세포층의 두께보다 유의하게 감소한 것은 망막전막안의 부종으로 인해 시세포층과 망막색소상피층에 압박을 가하 였고, 이로 인해 정상안에 비해 두께가 감소한 것으로 생각
해 볼 수 있으며, 수술 후 6개월째 시세포층의 두께가 다시 증가한 것은 다른 망막층들의 두께가 감소하여 상대적으로 시세포층에 대한 압력이 감소하였기 때문으로 생각할 수 있다. 수술 후 6개월째 망막신경섬유층의 두께가 가장 많이 감소되었고 바깥층으로 갈수록 감소량이 줄어드는 경향을 보이나 시세포층, 망막색소상피층은 수술 전과 비교해 증 가하였다(Table 3). 또한 수술 후 6개월째 신경절세포층, 내 망상층, 신경절세포-내망상층, 외망상층은 정상안보다 두께 가 감소하였다(Table 3). Lee and Yu12는 신경절세포-내망 상층의 두께를 동시에 측정하였고, 수술 후 6개월 이상 경 과관찰 시 신경절세포-내망상층의 두께(71.77 ± 10.21 μm) 가 정상안의 신경절세포-내망상층의 두께(81.69 ± 5.33 μm) 보다 유의하게 감소(p<0.001)하였다고 발표하였고 그 원인 으로 견인력 작용으로 만성적인 염증이 망막신경절세포에 영향을 미쳤을 것이라고 하였다. 본 연구에서 사용된 ETDRS subfield 영역은 Lee and Yu12가 발표한 결과에서 의 사용된 영역 기준과 달라 정확한 비교는 어려우나 수술 후 6개월째 신경절세포-내망상층의 안쪽 원과 바깥쪽 원의 두께가 정상안의 신경절세포-내망상층의 안쪽 원과 바깥쪽 원의 두께보다 감소한 것을 관찰할 수 있었다(Table 3). 하 지만 위와 같은 결과들은 빛간섭단층촬영으로 확인한 것으 로 실제로 조직의 손실을 확인하려면 조직학적인 연구가 필요하며, 병태생리학적으로도 어떠한 의의를 가지고 있는 지도 추가적인 연구들이 필요할 것으로 사료된다.
상관관계 분석을 통해 알아본 망막전막 수술 후 시력예 후에 영향을 미치는 인자로는 수술 전후 중심오목영역의 중심황반 두께차이와 수술 전 망막전막안과 정상안 간 중 심오목영역의 신경절세포층의 두께차이였다(Table 7). 각 인자들의 두께차이가 클수록 시력예후는 더 불량했다. 그 러나 다변량 회귀분석을 시행한 결과 수술 전 망막전막안 과 정상안 간 신경절세포층의 두께차이만 통계학적으로 유 의하게 수술 후 시력에 영향을 주는 것으로 나타났다(Table 8). Lee and Yu12은 수술 6개월 후 정상안과 비교한 신경절 세포-내망상층의 두께감소가 불량한 시력예후를 가진다고 보고하였고(r=0.5209, p<0.0001), 신경절세포-내망상층이 시 력예후에 중요한 역할을 한다고 하였다. 본원의 연구는 수 술 전 망막전막안과 정상안과의 비교를 통해 시력예후를 측정하였고, 정상안과 비교해 수술 전 망막전막안의 신경 절세포층의 두께가 두꺼울수록 수술 후 시력예후가 불량했 다. 즉 시력에 영향을 미칠 수 있는 시세포 내절/외절 접합 부 결손을 보이는 망막외층의 구조적 손상없이 순수하게 망막층별 두께만을 측정한 본원의 연구에서 술 전 신경절 세포층의 두께증가로 견인력에 의한 직접적인 손상과 일시 적인 허헐성 변화를 일으켜 기능부전과 비가역적인 변화를
가져오고 술 후 시력저하를 초래했을 것으로 생각된다. 본 연구의 제한점은 첫 번째, 후향적 연구이며 대상 수가 적다 는 점이고 두 번째, Software에서 자동으로 측정된 망막층 두께와 부종이 심해 경계가 부정확한 경우 보정했을 때 측 정한 망막층 두께의 두 가지 측정 오류 가능성을 생각해 볼 수 있다. Wolf-Schnurrbusch et al22은 정상 20안을 대상으 로 6가지 OCT (Stratus OCT, SOCT Copernicus, Spectral OCT/SLO, RTVue-100, HRA+OCT, Cirrus HD-OCT)의 중심 망막두께와 검사의 반복성에 대해 보고하였는데, Heidelberg eye software를 이용하여 자동 측정했을 때가 intersession repeatability (CV) 값이 0.46%로 다른 OCT에 비해 현저히 낮아 반복성이 높다고 하였다. 한편 Ctori and Huntjens23는 정상 40안을 대상으로 8개의 망막층별 두께를 SD-OCT로 측정하여 검사의 재현성과 반복성에 대해 보고하였는데, 검사자가 수동으로 보정하였을 때 층별두께와 중심오목 폭 의 변화 정도가 작으나 SD-OCT에 내재된 프로그램인 Heidelberg eye software를 이용하여 자동 측정했을 때가 보다 검사의 재현성이 높다고 하였다. 본 연구에서는 검사 자가 자동으로 설정된 경계선을 검토하여 경계선 설정에 오류가 있는 경우에 한해서 수동으로 보정하였기에 신뢰도 에 문제점이 있을 수 있으나 다른 OCT를 이용한 연구들과 비교하여 측정오차가 적은 결과라고 생각해 볼 수 있다. 세 번째, 망막의 기능 평가에 있어서 시력이 가지는 한계점이 다. 따라서 앞으로의 연구는 대상 수를 늘려 통계적 유의성 을 충분히 높이고 망막전막 이외의 시력예후에 영향을 줄 수 있는 인자들을 고려해야 하고, Software의 정확성을 높 여 측정오류를 보정해야 한다. 또한 시력 이외에 망막의 기 능을 평가하는 망막전위도(electroretinogram), 미세시야계 (microperimetry) 등을 이용하여 빛간섭단층촬영에서 나타 난 구조적 이상과 연관된 추가 연구가 필요할 것으로 생각 된다.
결론적으로 수술 전 망막전막안과 정상안 간 중심오목영 역의 신경절세포층의 두께차이가 수술 후 최대교정시력과 유의한 상관관계를 보였고, 두께 차이가 클수록 시력예후 가 불량했다.
REFERENCES
1) Sidd RJ, Fine SL, Owens SL, Patz A. Idiopathic preretinal gliosis.
Am J Ophthalmol 1982;94:44-8.
2) Pearlstone AD. The incidence of idiopathic preretinal macular gliosis. Ann Ophthalmol 1985;17:378-80.
3) Mitchell P, Smith W, Chey T, et al. Prevalence and associations of epiretinal membranes. The Blue Mountains Eye Study, Australia.
Ophthalmology 1997;104:1033-40.
4) Klein R, Klein BE, Wang Q, Moss SE. The epidemiology of epi-
= 국문초록 =
특발망막전막에서 유리체절제술 전후 망막층별 두께변화와 시력예후와의 관계
목적: 특발망막전막에서 수술 전후 빛간섭단층촬영으로 망막층별 두께를 측정하고 수술 후 시력예후와의 관계에 대해 알아보고자 하였다.
대상과 방법: 단안 특발망막전막 환자 46명, 46안을 대상으로 수술 전, 수술 후 1, 3, 6개월째 스펙트럼영역 빛간섭단층촬영기로 측정 이 가능한 모든 망막층들의 두께를 측정하여 수술 전 대상군의 정상안과 비교하였고, 유리체절제술 후 6개월째 두께변화를 측정하여 각 인자들과 수술 후 시력예후와의 상관관계에 대해 알아보았다.
결과: 수술 전 정상안과 비교하여 망막신경섬유층의 두께가 가장 많이 증가하였으며, 시세포층과 망막색소상피층에서는 정상안에 비 해 감소하였다. 수술 후 6개월째 망막층별 두께변화는 망막신경섬유층, 신경절세포층, 내망상층, 신경절세포-내망상층, 외망상층에서 감소하였고, 시세포층은 수술 전과 비교해 증가하였다. 수술 전 망막전막안과 정상안 간 신경절세포층의 두께차이(r=0.477, p=0.008) 가 수술 후 최대교정시력과 유의한 상관관계를 보였다.
결론: 수술 전 망막전막안과 정상안 간 신경절세포층의 두께차이가 수술 후 최대교정시력과 유의한 상관관계를 보였고, 두께 차이가 클수록 수술 후 시력예후가 불량했다.
<대한안과학회지 2017;58(4):420-429>
retinal membranes. Trans Am Ophthalmol Soc 1994;92:403-25;
discussion 425-30.
5) Machemer R. The surgical removal of epiretinal macular membranes (macular puckers) (author's transl). Klin Monbl Augenheilkd 1978;173:36-42.
6) McDonald HR, Verre WP, Aaberg TM. Surgical management of idiopathic epiretinal membranes. Ophthalmology 1986;93:978-83.
7) de Bustros S, Thompson JT, Michels RG, et al. Nuclear sclerosis after vitrectomy for idiopathic epiretinal membranes. Am J Ophthalmol 1988;105:160-4.
8) Margherio RR, Cox MS Jr, Trese MT, et al. Removal of epimacular membranes. Ophthalmology 1985;92:1075-83.
9) Mitamura Y, Hirano K, Baba T, Yamamoto S. Correlation of visual recovery with presence of photoreceptor inner/outer segment junc- tion in optical coherence images after epiretinal membrane surgery.
Br J Ophthalmol 2009;93:171-5.
10) Inoue M, Morita S, Watanabe Y, et al. Preoperative inner seg- ment/outer segment junction in spectral-domain optical coherence tomography as a prognostic factor in epiretinal membrane surgery.
Retina 2011;31:1366-72.
11) Shimozono M, Oishi A, Hata M, et al. The significance of cone outer segment tips as a prognostic factor in epiretinal membrane surgery. Am J Ophthalmol 2012;153:698-704, 704.e1.
12) Lee EK, Yu HG. Ganglion cell-inner plexiform layer thickness af- ter epiretinal membrane surgery: a spectral-domain optical coher- ence tomography study. Ophthalmology 2014;121:1579-87.
13) Okamoto F, Sugiura Y, Okamoto F, et al. Inner nuclear layer thick- ness as a prognostic factor for metamorphopsia after epiretinal membrane surgery. Retina 2015;35:2107-14.
14) Lee JY, Kim HC. Ganglion cell layer thickness after anti-vascular endothelial growth factor treatment in retinal vein occlusion. J
Korean Ophthalmol Soc 2016;57:63-70.
15) Arichika S, Hangai M, Yoshimura N. Correlation between thicken- ing of the inner and outer retina and visual acuity in patients with epiretinal membrane. Retina 2010;30:503-8.
16) Koo HC, Rhim WI, Lee EK. Morphologic and functional associa- tion of retinal layers beneath the epiretinal membrane with spec- tral-domain optical coherence tomography in eyes without photo- receptor abnormality. Graefes Arch clin Exp Ophthalmol 2012;
250:491-8.
17) Rice TA, De Bustros S, Michels RG, et al. Prognostic factors in vi- trectomy for epiretinal membranes of the macula. Ophthalmology 1986;93:602-10.
18) de Bustros S, Rice TA, Michels RG, et al. Vitrectomy for macular pucker. Use after treatment of retinal tears or retinal detachment.
Arch Ophthalmol 1988;106:758-60.
19) Kwon SI, Ko SJ, Park IW. The clinical course of the idiopathic epi- retinal membrane after surgery. Korean J Ophthalmol 2009;23:
249-52.
20) Kim J, Rhee KM, Woo SJ, et al. Long-term temporal changes of macular thickness and visual outcome after vitrectomy for idio- pathic epiretinal membrane. Am J Ophthalmol 2010;150:701-9.e1.
21) Hwang DJ, Na KI, Kwon SI, Park IW. Long-term changes in visual acuity and foveal thickness after vitrectomy for idiopathic epi- retinal membrane. J Korean Ophthalmol Soc 2012;53:434-9.
22) Wolf-Schnurrbusch UE, Ceklic L, Brinkmann CK, et al. Macular thickness measurements in healthy eyes using six different optical coherence tomography instruments. Invest Ophthalmol Vis Sci 2009;50:3432-7.
23) Ctori I, Huntjens B. Repeatability of foveal measurements using spectralis optical coherence tomography segmentation software.
PLoS ONE 2015;10:e0129005.