Healthy Eating Index (HEI-2015) of Female College Students According to Obesity and Exercise
Participation
Gizem Helvacı1,*, Fatma Tayhan Kartal2, Nurcan Yabancı Ayhan1
1Department of Nutrition and Dietetics, Faculty of Health Sciences, Ankara University, Ankara; 2Department of Nutrition and Dietetics, Faculty of Health Sciences, Çankırı Karatekin University, Çankırı, Turkey
Background: Individuals participating in exercise are more likely to lead a healthy lifestyle to achieve their ex- ercise-related goals. This study aimed to examine the differences in dietary quality of female university students by exercise involvement and body mass index (BMI).
Methods: This study was conducted with 360 female university students in Turkey. Students were asked to complete a questionnaire containing general characteristics and food consumption records. The “Healthy Eating Index (HEI-2015)” score was calculated using the results of food consumption records.
Results: The findings showed that the ratio of individuals who exercised regularly was 34.2%. The ratio (44.2%) of regularly exercising participants with moderate/good diet quality was greater than that of regularly exercis- ing participants with poor diet quality (30.6%) (P=0.016). There was no significant difference between the scores of overall diet quality according to BMI classification (P>0.05). The score (45.3±13.4) for overall diet qual- ity of those participating in exercise in the group with normal body weight was higher than the score (41.5±
12.1) for overall diet quality of those not participating in exercise (P=0.026). Those participating in exercise in the group with normal body weight consumed more greens and beans, whole grains, dairy products, seafood/
vegetable proteins, and refined grains than those not participating in exercise (P<0.05).
Conclusion: The rate of overall participation in physical activity was low. However, students participating in physical activity and with a normal body weight had a better diet quality. Creating an ideal environment that encourages students to participate in physical activity at universities can be an effective method for improving their diet quality.
Key words: Exercise, Diet, Obesity
Received February 24, 2021 Reviewed April 26, 2021 Accepted June 7, 2021
* Corresponding author Gizem Helvacı
https://orcid.org/0000-0001-8654-9245 Department of Nutrition and Dietetics, Faculty of Health Sciences, Ankara University, Fatih St. No 197, A Keçiören, Ankara 06290, Turkey
Tel: +90-312-381-2350-6567 Fax: +90-312-381-2355
E-mail: [email protected]
INTRODUCTION
University students are at a life stage where they start to make their own decisions about their future. Although they possess the biological maturation of an adult individual, their psychosocial de- velopment is incomplete.
1They often live apart from their families during their education, which can affect adversely their diet quality and lifestyle. The unhealthy habits they can develop during these
periods generally persist in their later years.
2There are many rea- sons that students lead an unhealthy lifestyle, such as lack of leisure time, family problems, health status, climatic conditions, and eco- nomic situation.
3However, interaction between lifestyle behaviors can exist. For example, it is possible that individuals participating in exercise are more careful about having a healthy lifestyle, abstaining from alcohol and smoking, and following a healthier diet.
4Recent studies have investigated the relationships between lifestyle factors
Copyright © 2021 Korean Society for the Study of Obesity
This is an Open Access article distributed under the terms of the Creative Commons Attribution Non-Commercial License (https://creativecommons.org/licenses/by-nc/4.0/) which permits unrestricted non-commercial use, distribution, and reproduction in any medium, provided the original work is properly cited.
2017-03-16 https://crossmark-cdn.crossref.org/widget/v2.0/logos/CROSSMARK_Color_square.svg
Healthy Eating Index (HEI-2015) of Female College Students According to Obesity and Exercise
Participation
Gizem Helvacı1,*, Fatma Tayhan Kartal2, Nurcan Yabancı Ayhan1
1Department of Nutrition and Dietetics, Faculty of Health Sciences, Ankara University, Ankara; 2Department of Nutrition and Dietetics, Faculty of Health Sciences, Çankırı Karatekin University, Çankırı, Turkey
Background: Individuals participating in exercise are more likely to lead a healthy lifestyle to achieve their ex- ercise-related goals. This study aimed to examine the differences in dietary quality of female university students by exercise involvement and body mass index (BMI).
Methods: This study was conducted with 360 female university students in Turkey. Students were asked to complete a questionnaire containing general characteristics and food consumption records. The “Healthy Eating Index (HEI-2015)” score was calculated using the results of food consumption records.
Results: The findings showed that the ratio of individuals who exercised regularly was 34.2%. The ratio (44.2%) of regularly exercising participants with moderate/good diet quality was greater than that of regularly exercis- ing participants with poor diet quality (30.6%) (P=0.016). There was no significant difference between the scores of overall diet quality according to BMI classification (P>0.05). The score (45.3±13.4) for overall diet qual- ity of those participating in exercise in the group with normal body weight was higher than the score (41.5±
12.1) for overall diet quality of those not participating in exercise (P=0.026). Those participating in exercise in the group with normal body weight consumed more greens and beans, whole grains, dairy products, seafood/
vegetable proteins, and refined grains than those not participating in exercise (P<0.05).
Conclusion: The rate of overall participation in physical activity was low. However, students participating in physical activity and with a normal body weight had a better diet quality. Creating an ideal environment that encourages students to participate in physical activity at universities can be an effective method for improving their diet quality.
Key words: Exercise, Diet, Obesity
Received February 24, 2021 Reviewed April 26, 2021 Accepted June 7, 2021
* Corresponding author Gizem Helvacı
https://orcid.org/0000-0001-8654-9245 Department of Nutrition and Dietetics, Faculty of Health Sciences, Ankara University, Fatih St. No 197, A Keçiören, Ankara 06290, Turkey
Tel: +90-312-381-2350-6567 Fax: +90-312-381-2355
E-mail: [email protected]
in children and adults. Dietary quality has been associated with many factors, such as gender, socio-economic status, and residence.
5Re- cent studies have focused on the relationship between diet quality, regular physical activity, and body mass index (BMI).
6,7Regular exercise is defined as a set of planned, structured, and re- petitive physical activities carried out with sufficient frequency, du- ration, and intensity for protection, improvement, and develop- ment of health.
8It has been reported that regular physical activity improves perceived quality of life and general well-being.
9In addi- tion, it is an important tool that empowers an individual’s motiva- tion to keep his/her life under control and to achieve his/her life- related goals.
10Many reasons for involvement in exercise have been identified and include stress management, weight management, so- cialization, improvement of health, and development of strength and endurance.
11It is of utmost importance that healthy eating habits and lifestyle as well as regular physical activity are maintained to protect and promote health. The diet model followed, the number of meals, meal frequency, and beverage and food preferences play a role in individuals attaining their exercise-related goals.
12Therefore, we hypothesized that individuals participating in exercise would adopt a healthier diet to achieve their exercise-related goals. Healthy Eating Index (HEI) is one of the most utilized measures to assess whether or not a diet is healthy and were last updated in 2015 (HEI- 2015).
13The HEI has been shown to capture diet quality indepen- dently of energy intake.
14Therefore, it is useful to assess diet quality among populations with different BMI classes and energy intake.
This study aimed to examine the differences between female uni- versity students’ dietary qualities as related to exercise involvement and BMI.
METHODS Study design and participants
A cross-sectional study was conducted on 360 university stu- dents studying in Ankara and Çankırı, Turkey. Students were invit- ed to participate in this study using social media and e-mail, and they were informed about this study’s objectives and procedures.
The students who agreed to participate were invited to the involved institution and asked to complete a short questionnaire, including general characteristics and food consumption records by a face-to-
face interview method. Female students aged 19–25 years were in- cluded in this study, and those who did not complete the question- naire were excluded. Fig. 1 shows the flowchart diagram of partici- pant selection. The data were collected during the autumn of 2020.
Informed consent was obtained from each student who agreed to participate in this study. This study was conducted in accordance with the Declaration of Helsinki. Ethics committee approval was received from Çankırı Karatekin University (No. 17/07.10.2020).
Food consumption records and HEI-2015
Food consumption records were obtained from all students us- ing the retrospective 24-hour recall method. All foods and beverag- es consumed by the students in the past 24 hours were relayed to the researchers and recorded. A “photo catalogue of foods and nu- trients” was used to investigate measurements and amounts.
15“Standard Recipes” were used to investigate the amount of nutri- ents in the portions of the foods consumed by the participants.
16The average energy and nutritional values of consumed foods were analyzed using a “Nutrition Information Systems” program, which is a food software program in compliance with Turkish food. This software program was suitable for HEI-2015 analysis since it con- tained data based on the United States Department of Agriculture recommendations.
The HEI-2015 does not reflect diet quantity, but it supplies a score for diet quality. Since it provides for the comparison of scores between BMI groups, a qualitative instead of quantitative approach was selected. The “HEI-2015” score was calculated based on food consumption records. HEI-2015 includes 13 components, nine on dietary adequacy and four on limited consumption of saturated fats,
Figure 1. Flowchart of students participating in this study.516 Students coming to the institution and starting the questionnaire
441 Students finishing the questionnaire
360 Final study population
75 Students not finishing the questionnaire
81 Students not eligible for the study (< 19 and > 25 years old)
refined grains, added sugars, and sodium. A total score of HEI-2015 was obtained by summing the points for each component. The to- tal score was calculated out of 100, suggesting that, as the score in- creased, the diet quality improved: 50 points and below, 51–80 points, and above 80 points reflect poor-, moderate-, and good-diet quality, respectively.
17When grouping diet quality in this study, the few good diet quality participants (four) were incorporated into the moderate dietary quality group.
Body mass index
Body weight and height were recorded by measuring with a por- table digital weighing scale and a non-stretching tape measure, re- spectively. BMI (body weight [kg]/height
2[m
2]) was calculated from body weight and height measurements. Based on BMI, sub- jects were classified as underweight (BMI < 18.5 kg/m
2), normal- weight (BMI ≤ 18.5–24.9 kg/m
2), or overweight/obese (BMI
≥ 25 kg/m
2).
18Regular participation in exercise
The World Health Organization (WHO) recommends that adults between the ages of 18–64 complete 150 minutes of moderate aer- obic exercise or ≥ 75 minutes of vigorous aerobic exercise each week.
19Students who stated that they complied with the physical activity recommendations of WHO were considered to be com- pleting regular physical activity.
Statistical analysis
Research data were evaluated using the IBM SPSS ver. 21.0 (IBM Corp., Armonk, NY, USA). Descriptive statistics were used to ana- lyze the general characteristics of the participants. Normality was assessed using the Kolmogorov-Smirnov test. The continuous vari- ables were compared with the t-test or Mann-Whitney U-test ac- cording to normality, and the categorical variables were compared with the chi-square test. A chi-square test was used to compare smoking, alcohol use, and regular exercise between BMI groups, as well as BMI classification, smoking, alcohol use, and regular exercise between diet quality groups. To compare BMI means between diet quality groups, the Mann-Whitney U-test was used. Differences between more than two groups were compared with one-way anal- ysis of variance (ANOVA). When comparing energy, macronutri-
ents, and diet quality components according to exercise participa- tion between BMI groups, one-way ANOVA was used. Levene’s test for equality of variance was used and concluded homogenous variance of the BMI groups. According to these results, pairwise comparisons were performed for total diet quality between BMI groups using post hoc t-tests (Hochberg’s GT2). The energy, mac- ronutrients, and diet quality components according to exercise par- ticipation for each body weight group were compared using the t- test. The level of significance was set at P<0.05.
RESULTS
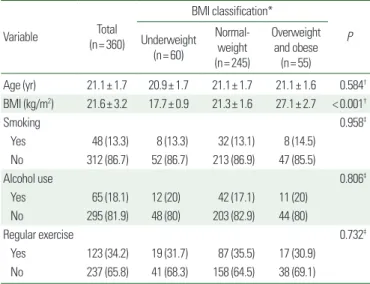
Table 1 shows the general characteristics of the participants ac- cording to BMI classification. The average age of participants was 21.1± 1.7 years, and the BMI average was 21.6± 3.2 kg/m
2. There was no statistically significant difference in average age according to BMI classification (P>0.05). The findings showed that 13.3% of participants smoked and 18.1% used alcohol. The rate of partici- pants who exercised regularly was 34.2%. According to BMI classi- fication, the rates of smoking and alcohol use and the rate of regu- larly participating in exercise did not exhibit a significant difference (P>0.05).
Table 2 presents the distribution of diet quality of participants
Table 1. General characteristics of the participants according to BMI classificationVariable Total
(n= 360)
BMI classification*
Underweight P (n= 60)
Normal- weight (n= 245)
Overweight and obese
(n= 55)
Age (yr) 21.1± 1.7 20.9± 1.7 21.1± 1.7 21.1± 1.6 0.584† BMI (kg/m2) 21.6± 3.2 17.7± 0.9 21.3± 1.6 27.1± 2.7 < 0.001†
Smoking 0.958‡
Yes 48 (13.3) 8 (13.3) 32 (13.1) 8 (14.5)
No 312 (86.7) 52 (86.7) 213 (86.9) 47 (85.5)
Alcohol use 0.806‡
Yes 65 (18.1) 12 (20) 42 (17.1) 11 (20)
No 295 (81.9) 48 (80) 203 (82.9) 44 (80)
Regular exercise 0.732‡
Yes 123 (34.2) 19 (31.7) 87 (35.5) 17 (30.9) No 237 (65.8) 41 (68.3) 158 (64.5) 38 (69.1) Values are presented as mean± standard deviation or number (%).
*BMI classification: underweight (< 18.5 kg/m2), normal-weight (18.5–24.9 kg/m2), overweight and obese (≥ 25.0 kg/m2); †Independent sample t-test; ‡Pearson chi-square test.
BMI, body mass index.
according to regular participation in exercise, BMI, and smoking and alcohol use. There was no significant difference in diet quality of participants according to BMI average, BMI classification, and smoking and alcohol use (P>0.05). The rate (44.2%) of regularly exercising participants with moderate/good diet quality (44.2%) was higher than that (30.6%) of regularly exercising participants with poor diet quality (P<0.05).
Table 3 presents the energy, macronutrients, and HEI results of participants according to BMI classification and participation in ex- ercise. The energy and macronutrients intake of underweight, nor- mal-weight, and overweight/obese participants did not show a sig- nificant difference based on exercise participation. There was no significant difference between the total diet quality scores accord- ing to BMI classification of participants (P>0.05). In pairwise comparisons using the post hoc t-test, the total diet quality scores of normal-weight participants were not different from those of un- derweight and overweight participants (P=0.83 and P=0.67, re-
Table 2. Distribution of participants’ diet quality according to regular participationin exercise, body mass index, and smoking and alcohol use
Variable Total
(n= 360)
Diet quality Poor P (n= 265)
Moderate/
good (n= 95)
BMI (kg/m2) 21.6± 3.2 21.4± 3.2 21.9± 3.1 0.153*
BMI classification 0.256†
Underweight (< 18.5 kg/m2) 60 (16.7) 49 (18.5) 11 (11.6) Normal-weight (18.5–24.9 kg/m2) 245 (68.1) 178 (67.2) 67 (70.5) Overweight and obese (≥ 25.0 kg/m2) 55 (15.2) 38 (14.3) 17 (17.9)
Regular exercise 0.016†
No 237 (65.8) 184 (69.4) 53 (55.8)
Yes 123 (34.2) 81 (30.6) 42 (44.2)
Smoking 0.907†
No 48 (13.3) 35 (13.2) 13 (13.7)
Yes 312 (86.7) 230 (86.8) 82 (86.3)
Alcohol Use 0.675†
No 65 (18.1) 46 (17.4) 19 (20.0)
Yes 295 (81.9) 219 (82.6) 76 (80.0)
Values are presented as mean± standard deviation or number (%).
*Mann-Whitney U-Test; †Pearson chi-square test.
BMI, body mass index.
Table 3. Healthy Eating Index results of participants according to body mass index classification and participation in exercise
Variable
Underweight (n= 60) Normal-weight (n= 245) Overweight and obese (n= 55)
P † Total Exercising
(n= 19)
Not exercising
(n= 41) P * Total Exercising (n= 87)
Not exercising
(n= 158) P * Total Exercising (n= 17)
Not exercising
(n= 38) P * Energy and nutrients
Energy (kcal) 1,465± 403 1,395± 454 1,492± 377 0.387 1,504± 379 1,522± 406 1,494± 365 0.590 1,808± 373 1,784± 297 1,820± 406 0.746 0.000 Carbohydrate (g) 166± 46 153± 53 172± 41 0.130 169± 59 169± 65 168± 57 0.903 206± 51 203± 54 208± 50 0.774 0.000 Protein (g) 56± 23 51± 19 58± 25 0.229 57± 20 58± 21 57± 19 0.664 72± 24 73± 19 72± 25 0.923 0.000 Fat (g) 61± 23 60± 22 62± 27 0.725 64± 20 64± 20 64± 20 0.923 75± 25 74± 20 75± 27 0.921 0.001 Healthy Eating Index-2015
Total fruits 1.3± 1.9 1.3± 2.1 1.3± 1.8 0.570 1.8± 1.9 1.8± 1.9 1.8± 1.9 0.830 1.6± 1.9 1.6± 1.9 1.7± 1.9 0.914 0.190 Whole fruits 1.6± 2.2 1.2± 2.1 1.7± 2.2 0.301 2.2± 2.2 2.2± 2.1 2.1± 2.3 0.760 2.3± 2.2 2.5± 2.1 2.2± 2.3 0.659 0.146 Total vegetables 2.7± 1.6 3.1± 1.6 2.6± 1.6 0.266 2.3± 1.7 2.5± 1.6 2.2± 1.7 0.280 2.8± 1.8 2.8± 1.9 2.8± 1.8 0.950 0.046 Greens and beans 1.6± 1.8 2.1± 2.1 1.4± 1.7 0.537 1.9± 1.9 2.5± 2.0 1.6± 1.7 0.001 1.8± 1.9 1.4± 1.9 1.9± 1.9 0.293 0.615 Whole grains 2.0± 3.4 2.8± 4.2 1.7± 3.0 0.716 2.6± 3.8 3.3± 4.1 2.2± 3.6 0.030 2.5± 3.9 2.6± 4.3 2.5± 3.8 0.930 0.597 Dairy product 3.9± 3.1 4.4± 3.2 3.7± 2.9 0.378 3.6± 3.1 4.2± 3.4 3.3± 2.9 0.041 4.3± 3.4 5.5± 3.5 3.7± 3.3 0.075 0.307 Total protein 4.6± 0.8 4.6± 0.8 4.6± 0.9 0.891 4.8± 0.9 4.8± 0.8 4.7± 0.9 0.447 4.9± 0.3 5.0± 0.0 4.9± 0.4 0.085 0.206 Seafood and
vegetables protein
1.9± 2.2 2.4± 2.4 1.7± 2.1 0.234 2.1± 2.2 2.7± 2.2 1.8± 2.1 0.002 2.4± 2.4 2.3± 2.5 2.4± 2.3 0.829 0.586 Fatty acid 2.5± 3.3 2.2± 3.3 2.6± 3.3 0.348 2.4± 3.3 1.8± 3.0 2.7± 3.5 0.053 2.8± 3.3 2.6± 3.9 2.9± 3.1 0.832 0.717 Refined grain 3.8± 3.6 5.3± 4.0 3.1± 3.3 0.048 4.5± 3.9 5.5± 3.9 3.9± 3.9 0.003 5.2± 4.2 5.3± 4.6 5.2± 4.1 0.947 0.181 Sodium 3.2± 3.9 2.8± 3.6 3.3± 4.0 0.993 2.6± 3.6 2.5± 3.5 2.7± 3.6 0.625 1.6± 2.9 0.9± 2.7 1.9± 3.1 0.272 0.053 Saturated fat 3.3± 3.8 1.7± 2.3 4.0± 4.1 0.031 3.1± 3.5 2.6± 3.3 3.4± 3.6 0.067 3.1± 3.3 1.6± 2.9 3.8± 3.2 0.020 0.931 Added sugar 8.9± 1.8 9.0± 1.8 8.9± 1.7 0.813 9.0± 1.7 9.1± 1.7 9.0± 1.8 0.918 9.5± 1.0 9.7± 0.8 9.4± 1.1 0.242 0.182 Total diet quality 41.5± 13.1 43.1± 15.1 40.7± 12.2 0.781 42.9± 12.7 45.3± 13.4 41.5± 12.1 0.026 44.8± 12.4 43.8± 15.5 45.3± 10.9 0.676 0.374 Values are presented as mean± standard deviation.
*Independent sample t-test; †One-way analysis of variance.