건강한 한국성인에서 대사증후군과 아디포넥틴, 인슐린 저항성의 연관성
Metabolic Syndrome is Associated with Low Adiponectin Level and Increased Insulin Resistance in Apparently Healthy Koreans
유경화․오인명․박지은․김미정, 박주상․박상종․장은정 박상운․김상중․윤영숙(1)․정효지(2)․백현욱*
분당 제생병원 내과, 인제의대 일산백병원 가정의학과(1), 서울대 보건대학원(2)
Kyoung Hwa Yoo, In Myung Oh, Ji Eun Park, Mi Jeoung Kim,
Ju Sang Park, Sang Jong Park, Eun Jeong Jang, Sang Woon Park, Sang Jung Kim, Yeong Sook Yoon
(1), Hyo Jee Joung
(2), Hyun Wook Baik
*Department of Internal Medicine, Bundang Jesaeng General Hospital;
Department of Family Medicine, Inje University Ilsan Paik Hospital
(1); and Graduate School of Public Health, Seoul National University
(2)요 약
배경: 저아디포넥틴혈증이 대사증후군의 발생과 유의한 연 과성이 있다는 연구 결과들이 있는데 한국인에서 건강한 성인 을 대상으로 한 연구는 부족하다. 본 연구는 건강한 성인에서 아디포넥틴과 대사증후군 및 그 구성요소와 어떤 연관성을 가 지는지 알아보기 위하여 시행되었다.
방법: 분당 지역에 거주하는 30~59세의 과거 병력이 전혀 없는 건강한 남성 256명, 여성 340명을 대상으로 하였다. 아디 포넥틴과 대사증후군 및 구성요소의 연관성을 알아보기 위하 여 로지스틱 회귀분석을 시행하였다.
결과: 연구대상자의 평균 연령은 남성 43.4 ± 8.1, 여성 44.3 ± 8.1이었으며, 대사증후군으로 진단된 남성과 여성 모두 에서 아디포넥틴 농도가 유의하게 낮았고 인슐린 저항성은 유 의하게 높았다. 남성과 여성 모두에서 대사증후군의 구성요소 를 많이 가질수록 아디포넥틴 농도는 비례하여 감소하였고, log HOMA-IR score는 비례하여 증가하였다. 아디포넥틴 농 도가 가장 높은 삼분위수 집단을 기준으로 하였을 때 아디포 넥틴 농도가 가장 낮은 삼분위수 집단에서 대사증후군의 교차 비는 남성 3.56 (95% CI 1.83~6.91), 여성 6.38 (95% CI 2.35~17.3)로 유의하게 높았으며 아디포넥틴 농도가 증가함에 따라서 대사증후군의 교차비가 감소하는 용량반응관계를 보여 주었다 (P for trend < 0.05) 이러한 연관성은 남성의 경우 나 이, 체질량지수(BMI), log HOMA-IR score을 보정한 후에도 여전히 유의하였으나, 여성에서는 유의성이 사라졌다.
ABSTRACT
Background: Previous studies identified that a low adiponectin level plays a significant role in the development of metabolic syndrome (MetS). The aim of this study was to evaluate the relationship between adiponectin and MetS and its components in apparently healthy Koreans.
Methods: We performed a cross-sectional study in a sample of Koreans aged 30~59 years, including 256 men and 340 women. Study subjects were recruited by advertisement in Bundang and all had unremarkable medical histories. MetS was defined according to the 2009 Joint Interim Statement criteria. Serum adiponectin concen-trations were measured by enzyme-linked immunosorbent assay (ELISA).
Results: The mean ages of study subjects were 43.4 ± 8.1 for men and 44.3 ± 8.1 for women. Both men and women with MetS had significantly lower adiponectin levels and significantly higher HOMA-IR scores. The odds ratios (OR) for MetS in men and women with adiponectin levels in the lowest tertile were 3.56 (95% CI 1.83~6.91) and 6.38 (95%
CI 2.35~17.3) compared with highest tertial, respectively.
There was also a significant linear decrease with increasing tertiles of adiponectin levels in both men and women. This association between adiponectin and MetS was still significant after adjustment for age, BMI, and log HOMA-IR score in men. However, in women, this association disappeared after full adjustment (age, BMI, log HOMA-IR score).
ꠏꠏꠏꠏꠏꠏꠏꠏꠏꠏꠏꠏꠏꠏꠏꠏꠏꠏꠏꠏꠏꠏꠏꠏꠏꠏꠏꠏꠏꠏꠏꠏꠏꠏꠏꠏ
Received: Jul. 20, 2012; Reviewed: Aug. 9, 2012; Accepted: Sep. 10, 2012
Corresponding author: Hyun Wook Baik, Department of Internal Medicine, Division of Gastroenterology & Clinical Nutrition, DMC
Bundang Jesaeng Hospital, Bundang, Gyeonggi-do, 463-774, South KoreaTel: 82-31-779-0210, Fax: 82-31-779-0897, E-mail: hbaik@dmc.or.kr, Mobile: 010-9082-0841
Introduction
Metabolic syndrome (MetS) is characterized by interrelated risk factors (hypertension, hypertriglyceridemia, low high-density lipoprotein (HDL) cholesterol, and elevated fasting blood glucose) and insulin resistance, which leads to an increased risk for type 2 diabetes and progression of cardiovascular disease.
1)The prevalence of MetS in Korea is approximately 30%
2)and this statistic has attracted attention here because cardiovascular disease and diabetes have been ranked the 3
rdand 5
thleading causes of mortality, respectively.
3)Adipose tissue is not only an inert energy storage depot, but also an active organ that secrets various hormones.
4)Serum adiponectin, which is the most abundant adipokine secreted from adipose tissue, regulates lipid metabolism, glucose metabolism, and insulin sensitivity.
5)Adiponectin is regulated by metabolic stress and a number of biological markers, such as catecholamines, glucocorticoids, IL-6, TNF-α, growth hormone, thiazolidinediones, and an-drogens.
6,7)Adiponectin is closely related to obesity and metabolic derangements, including insulin resistance. Previous studies suggested a low adiponectin level may play a major role in the development of MetS. There are many reports showing a relationship between a low adiponectin level and insulin resistance; while, other studies found a low adiponectin level is strongly associated with the risk of MetS, independent of insulin resistance. Yet, there are few reports in apparently healthy Korean. Therefore, this study aimed to evaluate the relationship between adiponectin concentration and MetS and its components in apparently healthy Korean.
Materials and Methods 1. Study Subjects
The study subjects were recruited by advertisement in
Bundang between June 2009 and October 2010. This study included individuals aged 30~59, who did not have a history of cardiovascular disease, diabetes, hypertension, dyslipidemia, cancer and did not use any medications related with these diseases. A total of 596 apparently healthy subjects (256 men and 340 women) were enrolled.
This study was approved by the Institutional Review Board at the Bundang Jesaeng General Hospital and written informed consent was received from each participant.
2. Laboratory measurements
Body weights and heights were measured using an automatic height andweight scale (GL-150; G-Tech International, Korea). Waist circumference was measured to the nearest 0.1 cm at the narrowest point between the lowest rib and the uppermost lateral border of the right iliac crest. Blood pressure was measured using a sphygmomanometer (EW3152; Panasonic, Japan) in the sitting position after a 5-min rest. Venous blood was collected after at least 8 hours of fasting. Triglyceride, HDL-cholesterol, and glucose levels were measured using an enzymatic colorimetric test (GPO-PAP), an enzymatic method, and the HK-G6PD (UV) method, respectively.
Insulin levels were measured with an ECLIA (electrochemiluminescence immunoassay). Insulin resistance was assessed with the Homeostatic Model Assessment (HOMA) index using the following formula: fasting insulin (μIU/mL) × fasting plasma glucose (mmol/L) / 22.5.
8)Serum adiponectin concentration was measured by an enzyme-linked immunosorbent assay using a commercially available kit (AdipoGen, Seoul, Korea). The intra- and inter-assay coefficients of variations were 2.9~3.8% and 2.8~5.5%, respectively.
3. Definition of metabolic syndrome
Metabolic syndrome was defined according to the 2009 결론: 건강한 한국인에서 아디포넥틴 농도와 대사증후군 및
구성요소는 유의한 연관성이 있었다. 남성에서는 저아디포넥 틴혈증과 대사증후군의 연관성이 인슐린 저항성과 독립적으로 나타났으나 여성에서는 그렇지 못하였다.
중심단어: 대사증후군, 저아디포넥틴혈증, 인슐린 저항성
Conclusion: Adipo-nectin levels are independently associated with MetS and its components in apparently healthy Koreans. The relationship between low adiponectin levels and MetS was independent of insulin resistance in men, but not women.
Key words: Metabolic syndrome, Low adiponectin level,
Insulin resistance
Joint Interim Statement criteria proposed by the International Diabetes Federation Task Force on Epidemiology and Prevention, the American Heart Association, and the National Heart, Lung, and Blood Institute.
9)A population-specified cut-off for waist circumference, from the Korean Society for the Study of Obesity, was used.
10)We defined MetS as the presence of at least three of the following conditions: 1) abdominal obesity: waist circumference ≥ 90 cm in men or ≥ 85 cm in women; 2) hypertriglyceridemia: a serum triglyceride concentration ≥ 150 mg/dL; 3) low HDL-cholesterol: a serum HDL cholesterol concentration < 40 mg/dL for men or < 50 mg/dL in women; 4) high blood pressure: systolic blood pressure ≥ 130 mmHg, diastolic blood pressure ≥ 85 mmHg; and 5) high fasting gluose: serum glucose concentration ≥ 100 mg/dL.
4. Statistical Analysis
All descriptive results are presented as the mean ± SD for continuous variables or numbers (%) for categorical variables. The distribution of adiponectin, insulin, and HOMA-IR scores was markedly skewed; therefore, the scores were log-transformed for analyses and the log mean values were transformed back. Continuous variables
were compared by t-test. Categorical variables were compared by χ
2-test. Linear regression analysis was performed to evaluate the associations between log adiponectin levels or log HOMA-IR scores and the number of components of MetS after adjustment for age and body mass index (BMI). Linear trends were tested by scoring the number of components of MetS and entering the score as a continuous term in the regression model.
Multivariate logistic regression was used to assess the independent association of the presence or absence of MetS as a dependent variable in tertiles of adiponectin values after adjustment for age, BMI, and log HOMA-IR score. All statistical analyses were performed using the Stata SE 10.0 (Stata, College Station, TX) and a P-value
< 0.05 was considered statistically significant.
Results
Table 1 shows the basic characteristics of the study subjects. The mean ages of study subjects were 43.4 ± 8.1 for men and 44.3 ± 8.1 for women. More young subjects were included compared with previous studies, with 34.8% of men and 30.3% of women subjects aged 30~39 years. Every component of MetS examined,
Table 1. Baseline characteristics of study participants
Men (n = 256) Women (n = 340)
P value
Age (years) 43.4 ± 8.1 44.3 ± 8.1 0.1912
30~39 89 (34.8) 103 (30.3) 0.2380
40~49 102 (39.8) 130 (38.2)
50~60¡¡ 65 (25.4) 107 (31.5)
BMI (kg/m2) 25.4 ± 2.8 23.1 ± 3.1 < 0.0001
Waist circumference (cm) 85.9 ± 6.9 77.2 ± 8.1 < 0.0001
Systolic Blood Pressure (mmHg) 125.1 ± 13.1 115.8 ± 14.0 < 0.0001
Diastolic Blood Pressure (mmHg) 80.6 ± 9.0 74.5 ± 9.4 < 0.0001
Fasting Blood Glucose (mg/dL) 98.8 ± 23.1 87.5 ± 18.2 < 0.0001
HDL-cholesterol (mg/dL) 48.3 ± 12.0 58.5 ± 13.8 < 0.0001
Triglyceride (mg/dL) 197.4 ± 126.7 113.3 ± 75.4 < 0.0001
Insulin 7.7 ± 2.0 5.5 ± 1.7 < 0.0001
HOMA-IR score 1.8 ± 2.0 1.2 ± 1.9 < 0.0001
Plasma adiponectin 3.9 ± 2.0 8.9 ± 2.01 < 0.0001
Abdominal obesity [N(%)] 85 (33.2) 59 (17.3) < 0.0001
High blood pressure 129 (50.4) 91 (26.76) < 0.0001
High FBG 96 (37.5) 52 (15.3) <0.0001
High TG 165 (64.5) 78 (22.9) < 0.0001
Low HDL 68 (26.6) 103 (30.3) 0.3190
MetS 95 (37.1) 47 (13.8) < 0.0001
All data are mean ± SD or Number (percentage) of participants
BMI, Body mass index; FBG, Fasting blood glucose; TG, Triglycerides; HDL, High density lipoprotein; MetS, Metabolic syndrome; HOMA-IR, Homeostasis model assessment of insulin resistance.
P values by t-test or χ
2-test.including the prevalence of abdominal obesity, high blood pressure (BP), high fasting blood glucose (FBG), and high triglycerides (TG), was significantly higher in men than women (P < 0.0001). The median adiponectin level in women (8.9 ± 2.01 mg/L) was significantly higher than in men (3.9 ± 2.0 mg/L) (P < 0.0001).
Table 2 shows age-and BMI-adjusted mean adiponectin levels and HOMA-IR scores, organized according to MetS and its components. The age-and BMI-adjusted adiponectin levels were significantly lower in women with abdominal obesity (6.5 ± 1.8 vs 8.5 ± 2.1 mg/L, P = 0.0092), with high TG (5.7 ± 2.2 vs 9.0 ± 2.0 mg/L, P
< 0.0001), and with low HDL levels (5.8 ± 1.9 vs 9.4 ± 2.1 mg/L, P < 0.0001).
The age- and BMI-adjusted adiponectin levels were significantly lower in men with high FBG levels (3.5 ± 1.9 vs 4.3 ± 2.0 mg/L, P = 0.0212) and high TG (3.4 ± 1.8 vs 5.2 ± 2.1 mg/L, P < 0.0001). The age- and BMI-adjusted HOMA-IR score was significantly higher in women with abdominal obesity (1.5 ± 2.4 vs 1.1 ± 1.7, P = 0.0007), high BP (1.3 ± 1.9 vs 1.1 ± 1.8, P = 0.0132), high FBG (2.2 ± 1.9 vs 1.0 ± 1.8, P < 0.0001), high TG (1.6 ± 1.9 vs 1.0 ± 1.8, P < 0.0001), and with low HDL levels (1.4 ± 2.0 vs 1.1 ± 1.8, P < 0.0001).
Table 3. Associations between log adiponectin levels, log HOMA-IR scores, and the number of MetS components from
linear regression analysis by sexNo of MetS components
Men Women
Unadjusted Adjusted Unadjusted Adjusted
β s.e.
P value
β s.e.P value
β s.e.P value
β s.e.P value
Log 0 0 0 0 0
Adipo-nectin 1 0.37 0.17 0.027 -0.36 0.17 0.032 -0.33 0.09 < 0.001 -0.30 0.09 0.002
2 -0.52 0.15 0.001 -0.49 0.16 0.002 -0.57 0.11 < 0.001 -0.57 0.12 < 0.001
≥ 3 -0.67 0.15 <0.001 -0.63 0.16 < 0.001 -0.64 0.12 < 0.001 -0.57 0.14 < 0.001
P for trends < 0.0001
0.0002 < 0.001 < 0.001Log 0 0 0 0
HOMA-IR 1 0.38 0.18 0.031 0.33 0.17 0.051 0.27 0.07 < 0.001 0.26 0.08 0.001
Score 2 0.64 0.16 < 0.001 0.55 0.15 < 0.001 0.46 0.09 < 0.001 0.48 0.09 < 0.001
≥ 3 0.96 0.16 < 0.001 0.76 0.16 < 0.001 0.85 0.10 < 0.001 0.82 0.12 < 0.001
P for trends
< 0.001 < 0.001 < 0.001 < 0.001β, regression coefficient; s.e., standard error; MetS, Metabolic syndrome; HOMA-IR, Homeostasis model assessment of insulin resistance. The dependent variable was log plasma adiponectin or Log HOMA-IR Score with the number of MetS components entered as an explanatory covariate in the linear regression analysis after adjustment for age and BMI.
Table 2. Age and BMI adjusted mean adiponectin levels and HOMA-IR scores according to each component of MetS
Adiponectin* HOMA-IR Score*
Men Women Men Women
Abdominal obesity (-) 4.0 ± 2.1 8.5 ±2.1 1.6 ± 2.2 1.1 ± 1.7
(+) 3.8 ± 1.7 6.5 ± 1.8 2.4 ± 1.8 1.5 ± 2.4
P value
0.5385 0.0092 0.0001 0.0007High BP (-) 4.0 ± 2.0 8.4 ± 2.0 1.7 ± 2.0 1.1 ± 1.8
(+) 3.9 ± 1.9 7.4 ± 2.2 1.9 ± 2.3 1.3 ± 1.9
P value
0.8698 0.1878 0.2813 0.0132High FBG (-) 4.3 ± 2.0 8.4 ± 2.1 1.5 ± 2.0 1.0 ± 1.8
(+) 3.5 ± 1.9 6.9 ± 1.8 2.5 ± 2.1 2.2 ± 1.9
P value
0.0212 0.0864 < 0.0001 < 0.0001High TG (-) 5.2 ± 2.1 9.0 ± 2.0 1.5 ± 2.2 1.0 ± 1.8
(+) 3.4 ± 1.8 5.7 ± 2.2 2.0 ± 2.0 1.6 ± 1.9
P value
< 0.0001 < 0.0001 0.0013 < 0.0001Low HDL (-) 4.1 ± 2.0 9.4 ± 2.1 1.7 ± 2.2 1.1 ± 1.8
(+) 3.5 ± 1.8 5.8 ± 1.9 2.1 ± 1.8 1.4 ± 2.0
P value
0.1112 < 0.0001 0.0481 < 0.0001MetS (-) 4.4 ± 2.1 8.6 ± 2.1 1.5 ± 2.1 1.1 ± 1.8
(+) 3.3 ± 1.8 5.7 ± 1.8 2.5 ± 2.0 2.0 ± 2.0
P value
0.0018 0.0004 < 0.0001 < 0.0001BP, blood pressure; FBG, Fasting blood glucose; TG, Triglycerides; HDL, High density lipoprotein; MetS, Metabolic syndrome;
HOMA-IR, Homeostasis model assessment of insulin resistance. *Logarithmic transformations were performed before analysis.
The age-and BMI-adjusted HOMA-IR score was significantly higher in men with abdominal obesity (2.4 ± 1.8 vs 1.6 ± 2.2, P = 0.0001), high FBG (2.5 ± 2.1 vs 1.5 ± 2.0, P < 0.0001), high TG (2.0 ± 2.0 vs 1.5 ± 2.2, P < 0.0013), and with low HDL levels (2.1 ± 1.8 vs 1.7
± 2.2, P = 0.0481). Therefore, the age-and BMI-adjusted HOMA-IR scores were significantly higher in subjects who had components of MetS for both genders (P <
0.05), with the exception of high blood pressure in men (1.9 ± 2.3 vs 1.7 ± 2.0, P = 0.2813).
Table 3 shows interrelationships between serum adiponectin levels, the total number of MetS components, and HOMA-IR scores in both genders. A significant linear decrease in log adiponectin levels and significant linear increase in log HOMA-IR scores were observed according to the total number of MetS components in both men and women (P for trends < 0.001).
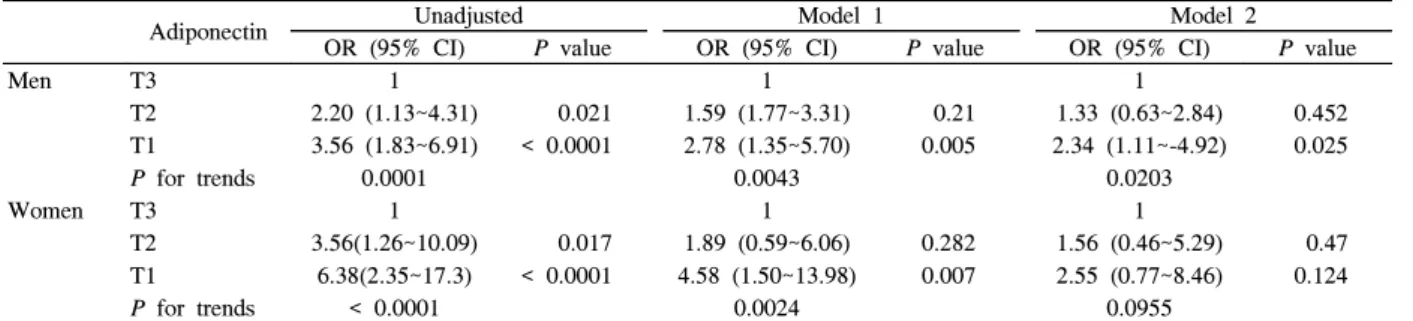
Table 4 shows the unadjusted and adjusted odds ratios (ORs) for MetS by adiponectin tertiles. The OR for MetS in men with levels in the lowest adiponectin tertile was 3.56 (95% CI 1.83~6.91) and that was significantly higher compared with those with levels in the highest tertile.
This association between adiponectin and MetS was still significant after adjustment for age, BMI, and log HOMA-IR score in men. Women with levels in the lowest adiponectin tertile had a significantly higher OR for MetS (OR 6.38, 95% CI 2.35~17.3), but this association disappeared after full adjustment (age, BMI, log HOMA-IR score).
Discussion
We performed a cross-sectional study in apparently healthy Koreans to determine the relationships between serum adiponectin levels and MetS and its components.
We measured the correlation between MetS and various biomarkers, such as resistin 2, IL-6, TNF-α, and hs-CRP.
However, these results were not included because a significant relationship was not found. Our study did clearly show that MetS is associated with low adiponectin levels and increased insulin resistance in apparently healthy Koreans. In addition, the relationship between low adiponectin levels and the risk of MetS was independent of insulin resistance in men, but not women.
The prevalence of MetS in Korea is approximately 30%
2)and is rapidly increasing according to the Korean Nutrition and Health Examination Survey. The frequency of MetS in women in our study was 13.8%, which is lower than that found in a study on a population-based sample.
11)According to the ARIRANG study, 34.1% of women had three or more characteristics of MetS. This difference may be explained by our study population being relatively young. The average age of women in the ARIRANG study was 54.8 ± 8.3; while, the average age of women included in our study was 44.3 ± 8.1. The difference may also be explained by inclusion of apparently healthy people, with no medical history of cardiovascular disease, diabetes, hypertension, and dyslipidemia, who did not use any medications.
Men showed significantly lower mean adiponectin levels than women. Such gender differences in adiponectin levels have been reported in several other studies.
12~13)This gender difference could be explained by inhibitory effects of androgen on adiponectin. Cui et al.
14)showed that a high testosterone level was negatively related with adiponectin; while, Laughlin et al.
11)showed that endogenous testosterone was positively associated with adiponectin in both older men and postmenopausal women. Therefore, higher adiponectin levels in women compared with men could not fully be explained by Table 4. Crude and adjusted odds ratios for MetS by adiponectin tertiles
Adiponectin Unadjusted Model 1 Model 2
OR (95% CI)
P value
OR (95% CI)P value
OR (95% CI)P value
Men T3 1 1 1
T2 2.20 (1.13~4.31) 0.021 1.59 (1.77~3.31) 0.21 1.33 (0.63~2.84) 0.452
T1 3.56 (1.83~6.91) < 0.0001 2.78 (1.35~5.70) 0.005 2.34 (1.11~-4.92) 0.025
P for trends
0.0001 0.0043 0.0203Women T3 1 1 1
T2 3.56(1.26~10.09) 0.017 1.89 (0.59~6.06) 0.282 1.56 (0.46~5.29) 0.47
T1 6.38(2.35~17.3) < 0.0001 4.58 (1.50~13.98) 0.007 2.55 (0.77~8.46) 0.124
P for trends
< 0.0001 0.0024 0.0955The cut-off point for the plasma adiponectin tertiles were < 2.9, 2.9~5.2, and > 5.2 in men and < 6.6, 6.6~11.1, and > 11.1 in women.
OR, odds ratio, CI confidence interval. Model 1: adjusted for age and BMI, Model 2; adjusted for age, BMI, and log HOMA-IR score.
higher testosterone levels in men.
The plasma adiponectin levels were found to be significantly lower in men with high FBG or high TG levels and in women with high TG, low HDL cholesterol, or abdominal obesity. These results were consistent with those from other population-based studies.
13-15)Cui et al.
14)reported that a significant negative correlation was observed between adiponectin and TG, and a positive correlation between adiponectin and HDL cholesterol.
Low circulating adiponectin has been associated with dyslipidemia through an increased free fatty acid uptake by the liver and a decreased TG uptake in muscle and adipose tissue.
16)Among the metabolic syndrome components, abdominal obesity is linked most closely to low adiponectin levels. Ackermann et al. demonstrated a negative relationship between waist circumference and adiponectin in women with MetS, and waist circumference is a key marker of MetS.
17)Our results also showed women with abdominal obesity had lower adiponectin levels, but not men. In previous study, Kazumi et al. reported that plasma concentrations of adiponectin are significantly lower among obese men than non-obese subjects
18)and Silha et al. reported that adiponectin levels were significantly lower in obese compared with lean subjects.
19)On the other hand, Amita et al. showed that adiponectin and waist circumference were not significantly correlated.
20)We assumed these differences were due to obesity criteria, and we used waist circumference as the obesity criteria rather than body mass index.
Plasma adiponectin levels and high BP were not significantly associated in both genders. Studies on the relationship between adiponectin levels and hypertension have produced conflicting results in clinical settings.
21-25)Studies found adiponectin levels are not associated with systolic and diastolic blood pressure
21,25)and that higher adiponectin concentrations were found in hypertensive patients.
24)Thus, the relationship between adiponectin and blood pressure warrants further study with samples drawn from other populations.
In the present study, HOMA-IR scores were significantly associated with the individual components of MetS in both genders, with the exception of high BP in men. Ele Ferrannini et al.
26)reported that arterial blood pressure is inversely related to insulin sensitivity and directly related to fasting plasma insulin concentration in
either sex, at any age, and regardless of body size.
Another significant finding of the present study is that mean log adiponectin levels decreased significantly with the increasing number of MetS components in both men and women (P for trends < 0.001).
Adiponectin was significantly associated with MetS, but this association disappeared after adjustment for age, BMI, and HOMA-IR scores in women. Previous studies concerning the relationship between low adiponectin levels and MetS showed that low adiponectin was a potential risk factor for MetS.
27)Choi et al
28)also showed similar results that lower serum adiponectin was associated with increased risk of metabolic syndrome, though there are some difficulties in direct comparison with our study because of differences in age of subject, study design, and criteria of MetS used. Thus, adiponectin can be used as valuable marker for MetS in men.
No previous studies demonstrated that the relationship between MetS and adiponectin differed between genders.
Hormonal status is related with insulin resistance, as well as adiponectin levels. One study
29)showed that postmenopausal women with MetS had significantly lower adiponectin concentrations than premenopausal women with MetS. Lifestyle factors such as smoking, exercise, and alcohol use could explain the gender differences found for the association between adiponectin and MetS;
although, these factors were not analyzed in this study.
Our study has some limitations. First, our study population was not a representative sample. Therefore, it is worth confirming the use of adiponectin as a biomarker for predicting MetS in a large population-based study, although it may be difficult to measure the adiponectin levels. Second, the cross sectional design of this study prohibited us from concluding causal relationships. Third, we could not adjust for lifestyle factors related to MetS.
In conclusion, adiponectin levels and insulin resistance are associated with MetS in apparently healthy Koreans.
The relationship between low adiponectin levels and MetS
was independent of insulin resistance in men, but not
women. Further research is needed to confirm gender
differences in adiponectin levels and the prevalence of
MetS, and to elucidate the mechanisms leading to MetS in
a large representative sample.
Acknowledgements
This study was carried out with the support of the
"Research Cooperating Program for Agricultural Science
& Technology Development (Project No. PJ007211)", RDA, Republic of Korea.
References