D I A B E T E S & M E T A B O L I S M J O U R N A L
This is an Open Access article distributed under the terms of the Creative Commons At- tribution Non-Commercial License (http://creativecommons.org/licenses/by-nc/3.0/) which permits unrestricted non-commercial use, distribution, and reproduction in any medium, provided the original work is properly cited.
Fracture Incidence and Risk of Osteoporosis in Female Type 2 Diabetic Patients in Korea
Jong Kwan Jung1,*, Hyo Jeong Kim1,*, Hong Kyu Lee1, Sang Soo Kim2, Chan Soo Shin3, Jin Taek Kim1,2
1Department of Internal Medicine, Eulji University College of Medicine,
2Eulji Medi-Bio Research Institute,
3Department of Internal Medicine, Seoul National University College of Medicine, Seoul, Korea
Background: There are no published data regarding fracture risk in type 2 diabetic patients in Korea. In this study, we compared the fracture incidence and risk of osteoporosis of type 2 diabetic female patients with those in a non-diabetic hypertensive cohort.
Methods: The incidence of fracture in a type 2 diabetic cohort was compared with that in a non-diabetic hypertensive cohort over the course of 7 years. Female type 2 diabetic and non-diabetic hypertensive patients who visited Eulji General Hospital out- patient clinic from January 2004 to April 2004 were assigned to the diabetic cohort and the non-diabetic hypertensive cohort, re- spectively. Surveys on fracture event, use of anti-osteoporosis medications, and bone mineral density were performed.
Results: The number of fractures was 88 in the female diabetic cohort (n=1,268, 60.6±11.5 years) and 57 in the female non-dia- betic hypertensive cohort (n=1,014, 61.4±11.7 years). The RR in the diabetic cohort was 1.38 (P=0.064; 95% confidence interval [CI], 0.98 to 1.94) when adjusted for age. Diabetic patients with microvascular complications (61.0%) showed a higher RR of 1.81 (P=0.014; 95% CI, 1.13 to 2.92) compared with those without these complications. The prevalence of osteoporosis was compara- ble between the groups, while use of anti-osteoporosis medication was more common in the diabetic cohort (12.8%) than in the hypertensive cohort (4.5%) (P<0.001).
Conclusion: In our study, a higher fracture risk was observed in female type 2 diabetics with microvascular complications. Spe- cial concern for this risk group is warranted.
Keywords: Diabetes mellitus, type 2; Fracture; Osteoporosis
Corresponding author: Jin Taek Kim
Department of Internal Medicine, Eulji General Hospital, 14 Hangeulbiseong-ro, Nowon-gu, Seoul 139-872, Korea E-mail: [email protected]
Received: Jun. 1, 2011; Accepted: Oct. 29, 2011
INTRODUCTION
Osteoporosis occurring in diabetic patients causes a signifi- cant financial and physical burden. Furthermore hip or verte- bral fractures are frequently accompanied by severe disabilities which can be potentially fatal [1]. Until recently, the associa- tion between type 2 diabetes and osteoporosis has been con- troversial. In general, type 2 diabetes patients tend to have a higher body mass index (BMI) compared to non-diabetics.
Even when bone mineral density (BMD) is high, osteoporotic fractures are known to be more common in diabetic patients
[2-4]. However, there have been a few studies on the risk of os- teoporotic fractures in type 2 diabetes patients, according to which, the risk of vertebral fractures and distal radius fractures, unlike hip fractures, does not increase in such individuals [4].
Very few studies exist on hip and overall fractures in Asian diabetics. Opinions vary regarding the reasons behind the in- creased risk of fracture in type 2 diabetes patients. It is suggest- ed that increase in falling tendency as a result of peripheral neuropathy, retinopathy, postural hypotension, and hypogly- cemia might play a role. At the molecular level, the use of oral hypoglycemic agents such as Thiazolidinedione (TZD); the pISSN 2233-6079 · eISSN 2233-6087
accumulation of advanced glycation end product (AGE); and changes in AGE receptors (RAGE) are known to play an im- portant role in bone metabolism and bone strength. It was also suggested that bone turnover rate is decreased in diabetic pa- tients [5-8].
In order to investigate the association between type 2 diabe- tes and bone fractures, researchers collected data regarding the prevalence of osteoporosis and osteoporotic fractures in female type 2 diabetes patients.
METHODS
Study method and subjects
This study was a retrospective cohort study performed on fe- male patients over 20 years old who had been treated for dia- betes. The study was performed at Eulji General Hospital, en- rolling patients who visited outpatient clinic from January 1, 2004 to April 30, 2004. The control group included hyperten- sive females over 20 years old who had visited Cardiology De- partment outpatients clinic during the same period. This study compared the two groups for likelihood of incurring fractures.
The study concluded on December 31, 2010, for a total study duration of 7 years.
Each subject was surveyed for gender, height, weight, HbA1c and creatinine levels, duration of diabetes, bone density, event of fracture, and whether the subject had diabetes, hyperten- sion, or developed diabetic microvascular complications.
Regarding the use of drugs, the use of anti-osteoporosis drugs, insulin, sulfonylurea, thiazolidinedione, metformin, beta-blockers, thiazide, statin, and tranquilizers was surveyed.
Bone density was measured from the lumbar and femoral ar- eas using dual-energy X-ray absorptiometry (DEXA) (GE Lu- nar DEXA; GE Lunar, Madison, WI, USA). For postmeno- pausal females or females over 50 years who were unsure if they were menopausal, a T-score was used, whereas a Z-score was used for premenopausal females and females under 50 years with unclear menopausal status. Females with T-scores greater than -1.0 were defined as normal, and females with T- scores between -1.0 and -2.5 were defined as having osteope- nia. Osteoporosis was defined by a T-score less than -2.5. Z- scores less than -2.0 were defined as ‘below the expected range for age.’ Patients who took oral hypoglycemic agents or received insulin treatment were placed in the diabetic patient group, and non-diabetic patients taking anti-hypertensive drugs were placed in the hypertensive group.
Patients were exempted from this study if they had pre-ex- isting fractures, a malignant tumor, or were on dialysis for chronic renal failure. Patients with an estimated GFR (eGFR) less than 30 mL/min/1.73 m2 were exempted as well. eGFR was calculated using the following formula: Estimated GFR (mL/min/1.73 m2)=186×(creat/88.4)-1.154×(age)-0.203×(0.742, if female)×(1.210, if black) [9].
HbA1c was measured through high performance liquid chromatography using HLC-723G7 (Tosoh, Tokyo, Japan).
Analysis was confined to the patients who visited outpatient clinic or admitted to the hospital at least once a year.
Fractures in the vertebra, hip, distal radius, proximal hu- merus, pelvis, and ankle (tibia and fibula) were examined, while fractures of the cranium, cervical vertebra, fingers and toes were excluded from the analysis [10]. Multiple fractures from primary trauma such as car accidents were also excluded from the analysis.
The fractures analyzed in this study included those newly diagnosed at Eulji General Hospital as well as other hospitals by using medical records review.
Every year, the number of patients exposed to risk was com- puted, and through that computation, the fracture rate per thousand patients per year was arithmetically estimated. More- over, the relative risk (RR) of fractures in the diabetic group compared to that in the non-diabetic hypertensive group was computed, and the fracture-free survival of both groups was compared.
Statistical analysis
The mean values and the standard deviations were calculated for each variable by using SPSS statistics software version 17.0 (SPSS Inc., Chicago, IL, USA). To analyze the differences be- tween the groups, Student’s t-tests or chi-square tests were conducted accordingly. The calculation of RR was performed using Cox’s proportional hazards model, and fracture-free survival was calculated via life table method. The differences between the two groups were compared using Gehan’s gener- alized Wilcoxon statistic. The significance level was set at P<
0.05.
RESULTS
Clinical characteristics of subjects
There were a total of 2,282 participants. The diabetes group consisted of 1,268 patients, and the hypertension group con-
sisted of 1,014 patients. The clinical characteristics of the sub- jects are shown in Table 1. The mean age of the diabetes group was 60.6±11.5 years, and that of the hypertension group was 61.4±11.7 years. There was no significant difference in the mean ages of the two groups, and BMI and creatinine levels also showed no significant differences (Table 1). The use of be- ta-blockers, thiazide, and statin, which are known to affect fractures, was high in the hypertensive group, and there was no difference in the use of tranquilizers between the two groups (Table 1). The mean observation period was 5.7±2.0 years in the diabetes group and 5.3±2.2 in the hypertensive group, which was significantly longer in the diabetes group (P<0.001).
During the observation period, 60 patients in the hypertensive group developed diabetes. There was no difference in the prev- alence of osteoporosis/osteopenia between both groups when compared according to bone density (Table 2). However, when the BMD of the spine and hip were compared in the postmeno- pausal patients, the femoral neck BMD of the hypertension group was lower than that in the diabetes group (Table 3). The usage rate of anti-osteoporosis medication was significantly higher in the diabetic group (n=162, 12.8%) than the hyper-
tension group (n=46, 4.5%) (P<0.001). Prior to study conduc- tion, there was no difference in the usage rate of anti-osteopo- rosis medication in the two groups, with 15 (1.2%) patients from the diabetes group and 5 (0.5%) patients from the con- trol group (P=0.070). When all drugs were compared, the use of biphosphates, estrogen, and raloxifene did not differ (P=
0.134) (Table 4).
Incidence of fracture
During the study period, 88 members of the diabetes group Table 1. Clinical characteristics of the study population
Characteristic DM Control P value
Age, yr 60.6±11.5 61.4±11.7 0.071
BMI, kg/m2 25.1±3.4 24.8±3.4 0.154
DM duration, yr 9.6±7.5
HbA1c, % 7.67±1.50 5.75±0.46 <0.001
Creatinine, mg/dL 0.83±0.18 0.83±0.15 0.582 eGFR, mL/min/1.73 m2 67.0±16.9 67.5±14.7 0.039 Normal/Microalbumin-
uria/Overt proteinuria 498/462/126 (39.3/36.4/9.9) Peripheral neuropathy 246 (19.4)
Retinopathy 150 (11.8)
Insulin/TZD/SU/MET 449/171/571/521 (35.4/13.5/45.0/41.1)
Beta-blocker 68 (5.4) 195 (19.2) <0.001
Thiazide 23 (1.8) 76 (7.5) <0.001
Statin 185 (14.6) 175 (17.6) 0.009
Tranquilizer 82 (6.5) 76 (7.5) 0.336
Values are presented as either mean±standard deviation or number (%). Significance at P<0.05 according to Student’s t-test or chi-square test.
DM, diabetes mellitus; BMI, body mass index; eGFR, estimated glo- merular filtration rate; TZD, thiazolidinedione; SU, sulfonylurea; MET, metformin.
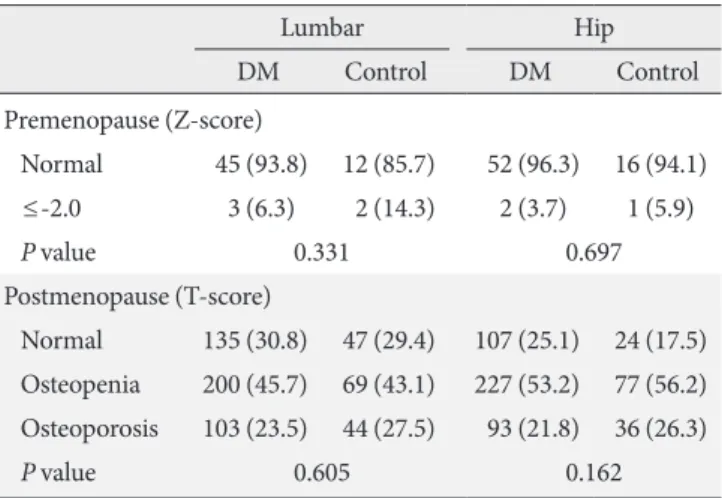
Table 2. Comparison of the prevalence of osteoporosis be- tween the diabetic and non-diabetic hypertensive groups
Lumbar Hip
DM Control DM Control
Premenopause (Z-score)
Normal 45 (93.8) 12 (85.7) 52 (96.3) 16 (94.1)
≤-2.0 3 (6.3) 2 (14.3) 2 (3.7) 1 (5.9)
P value 0.331 0.697
Postmenopause (T-score)
Normal 135 (30.8) 47 (29.4) 107 (25.1) 24 (17.5) Osteopenia 200 (45.7) 69 (43.1) 227 (53.2) 77 (56.2) Osteoporosis 103 (23.5) 44 (27.5) 93 (21.8) 36 (26.3)
P value 0.605 0.162
Values are presented as number (%). Significance at P<0.05 accord- ing to chi-square test.
DM, diabetes mellitus.
Table 3. Comparison of bone mineral density between the di- abetic and non-diabetic hypertensive groups
DM Control
P value
No. Mean±SD No. Mean±SD
Premenopause (Z-score)
L2-4 48 0.02±1.26 14 -0.15±1.29 0.167
Femur neck 46 -0.36±1.12 13 -0.54±0.74 0.589 Trochanter 46 -0.12±1.04 13 -0.08±0.59 0.881 Total hip 46 -0.04±1.07 13 -0.08±0.76 0.881 Postmenopause (T-score)
L2-4 438 -1.63±1.64 160 -1.72±1.30 0.557 Femur neck 427 -1.50±1.09 137 -1.71±0.98 0.045 Trochanter 427 -1.35±1.10 137 -1.40±1.10 0.669 Total hip 427 -1.32±1.16 137 -1.40±1.10 0.446 Values are presented as mean±standard deviation. Significance at P<
0.05 according to Student’s t-test.
DM, diabetes mellitus; SD, standard deviation.
and 56 members of the hypertension group incurred bone fractures. When converted to an annual incidence rate, 16.9 individuals per thousand diabetics had incurred fractures, while 15.5 individuals per thousand hypertensive patients had incurred fractures. The mean age at which patients were diag- nosed with fractures was 69.1±9.8 years, while that for pa- tients with hypertension was 74.9±9.6 years, a significant dif- ference (P=0.001). Overall, among patients who were diag- nosed with fractures, 66 (44.9%) had vertebral fractures, 32 (21.8%) had hip fractures, 27 (18.4%) had distal radius frac- tures, and 22 (15.0%) were diagnosed with fractures in other areas. In the diabetes group, the diagnosis rates were 39.8%, 22.7%, 17.0%, and 20.5% for vertebral fractures, hip fractures, distal radial fractures, and other fractures, respectively, and in the hypertensive patient group, these diagnosis rates were 52.5%, 20.3%, 20.3%, and 6.8%, respectively, a non-significant difference (P=0.112) (Table 5). Among the “other fractures” in the diabetes group, 5 (5.7%) were pelvic fractures, 8 (9.1%) were ankle fractures, 5 (5.7%) were fractures of the humerus. These
fractures numbered 2 (3.5%), 1 (1.8%), and 1 (1.8%), respec- tively, in the hypertensive group.
Comparing incidence of fractures in the diabetic group and the hypertensive group
When the mean annual fracture rate of the diabetic group was compared to the hypertensive group, the fracture rate of the diabetic group was 1.09 times higher. The comparison of RR of fracture was performed using the Cox regression model.
The results showed an unadjusted RR of 1.21 (P=0.259; 95%
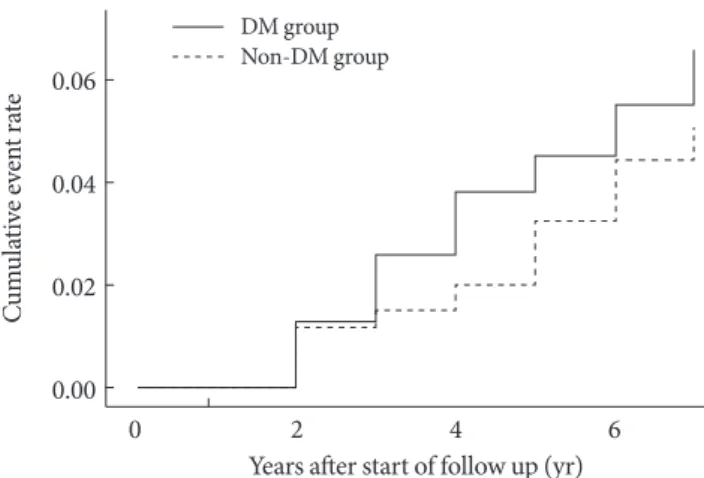
confidence interval [CI], 0.87 to 1.70) and an RR of 1.38 after adjusting for age (P=0.064; 95% CI, 0.98 to 1.94). When frac- ture-free survival was compared using the life table method, diabetic group was comparable to the hypertensive group (P=
0.13) (Fig. 1). When 1,936 postmenopausal women were ana- lyzed, the mean fracture rate per thousand individuals in the diabetes group was 18.9 patients, and that in the hypertensive group was 18.1 patients. In the Cox regression analysis, the RR of postmenopausal diabetic females was 1.22 (P=0.276; 95%
CI, 0.85 to 1.73), and 1.37 (P=0.085; 95% CI, 0.96 to 1.95) af- ter adjusting for age. In the subgroup analysis after excluding those who took anti-osteoporosis medications for the preven- tion of fractures, osteoporotic fractures were confirmed to be higher in the diabetic group (age adjusted RR, 2.507 [P=0.035;
95% CI, 1.07 to 5.89]).
When fractures were classified as vertebral or non-vertebral fractures, the risk of non-vertebral fracture increased signifi- cantly in the diabetes group; RR was 1.62 when adjusted for age (P=0.041; 95% CI, 1.02 to 2.56). There was no significant difference in hip fractures between these groups, but the RR of Table 4. Comparison of the use of anti-osteoporosis medica-
tions between the diabetic and non-diabetic hypertensive groups
DM Control
Bisphosphonate 122 (75.3) 34 (73.9)
Sex hormone 36 (22.2) 8 (17.4)
Raloxifen 4 (2.5) 4 (2.5)
Total 162 46
P value 0.134
Values are presented as number (%). Significance at P<0.05 according to chi-square test.
DM, diabetes mellitus.
Table 5. Comparison of fracture sites between the diabetic and non-diabetic hypertensive groups
DM Control Total
Vertebrae 35 (39.8) 31 (52.5) 66 (44.9)
Hip 20 (22.7) 12 (20.3) 32 (21.8)
Distal radius 15 (17.0) 12 (20.3) 27 (18.4)
Elsewhere 18 (20.5) 4 (6.8) 22 (15.0)
Total 88 57 147
P value 0.112
Values are presented as number (%). Significance at P<0.05 according to chi-square test.
DM, diabetes mellitus.
Fig. 1. Comparison of cumulative incidences of fracture be- tween the diabetic and non-diabetic hypertensive groups. DM, diabetes mellitus.
Cumulative event rate 0.06 0.04 0.02
0.00
0 2 4 6
Years after start of follow up (yr) DM group
Non-DM group
miscellaneous bone fractures in the diabetes group was signifi- cantly higher than in the hypertensive group after adjusting for age (RR, 3.48 [P=0.024; 95% CI, 1.18 to 10.30]).
Relationship between diabetic complications, use of drugs and the incidence of fractures
When the diabetes group was classified based on the presence or absence of microvascular complications, 61.0% appeared to have microvascular complications. The RR of the patients with microvascular complications compared to patients without these complications was 1.81 (P=0.014; 95% CI, 1.13 to 2.92) and remained significantly high at RR 1.64 after adjusting for age (P=0.043; 95% CI, 1.02 to 2.64). The risk of fracture did differ significantly with insulin and thiazolidinedione treat- ments, but when sulfonylurea or metformin were used, the RR of fracture appeared to decrease (sulfonylurea, RR, 0.61 [P=
0.028; 95% CI, 0.39 to 0.95]; metformin, RR, 0.43 [P=0.001;
95% CI, 0.27 to 0.70]), and this effect was statistically signifi- cant even after adjusting for age. Additionally, there was no significant difference in the risk for fracture in the diabetes group or in any group when beta-blockers, thiazide, statin, or tranquilizers were used.
DISCUSSION
This study was a retrospective cohort study covering a period of 7 years during which the incidence of bone fractures was compared between a diabetic group and a non-diabetic hyper- tensive group. In the results of this study, the incidence of over- all fractures in the diabetes group was not significantly differ- ent from that in the non-diabetic hypertensive group. Howev- er, diabetes was associated with an increase in non-vertebral fractures. Although there was no difference in overall bone fractures in our study, incidences of fractures occurred at younger ages in the diabetes group, and more of the diabetes group were taking drugs for osteoporosis. These findings sug- gest increased fracture risk in type 2 diabetes patients and are in line with previous studies [2-4].
In contrast, some studies have reported no increase in the risk of fractures in diabetes patients [11,12]. In a subgroup analysis in a large-scale Rotterdam study, the risk of fracture decreased in patients who had been newly diagnosed with dia- betes; however, in advanced diabetes patients who were un- dergoing treatment, the risk increased [12]. Interestingly, a de- crease in the risk of non-vertebral fractures was observed in
patients with impaired glucose tolerance [12]. In a recently published study, the risk of fracture in recently diagnosed dia- betes patients initially decreased but then increased after 5 or more years [13]. One possible explanation for these results is that the increase in insulin level resulting from impaired glu- cose tolerance and early stages of diabetes may have an influ- ence on bone metabolism, and the simultaneous increase in comorbidities as diabetes progresses may play a role [14]. The diabetes patients who participated in this study who were re- ceiving treatment had a mean duration of diabetes of 9.6 years, and microvascular complications in diabetic patients appeared to be a major risk factor for fractures.
In this study, femoral neck BMD was higher in postmeno- pausal type 2 diabetes patients than in the control group. Ac- cording to a recent meta-analysis, BMD in type 2 diabetes pa- tients tends to be higher, femur BMD tends to be lower than spinal BMD, and risk of hip fracture also increases [4,15]. In this study, femoral BMD was not lower than spinal BMD in diabetes patients, and hip fractures did not appear to increase.
There was no significant difference in the distribution of the location of the fractures between the diabetes group and the control group, and the most common fracture sites were ver- tebrae, hip, and distal radius, in descending order. There was no significant increase in the risk of vertebral or hip fractures in the diabetes group, while the incidences of non-vertebral fractures and miscellaneous fractures appeared to be signifi- cantly different. Although there are no clear causes for the dif- ferences from results reported in Western studies, ethnic and regional differences are assumed to play a role.
Recently, when the results were analyzed using quantitative computed tomography and separating cortical and trabecular bone, an increase in the trabecular bone of the spine and femur in type 2 diabetes patients was observed, and there was no dif- ference in the cortical bone. A decrease in bone volume and cross-sectional area was observed, but there was no difference in terms of load-strength ratio, which partially explains the discrepancy between BMD and fracture risk in diabetes [15].
In a previously published comparative study performed on 185 female type 2 diabetes patients, the BMD of the lumbar of the type 2 diabetes patient group was higher compared to that of the age-adjusted healthy control group [16]. The results for BMD from this study were limited because data were not col- lected from every patient. However, BMD of the diabetic group did not have a tendency to decrease compared to that in the hypertensive group. A significantly higher number of diabetes
patients used osteoporosis drugs compared to hypertensive patients, which may be the result of more aggressive osteopo- rosis screenings in diabetes patients. In our study, patients in the diabetic group received BMD examinations 2.3 times more frequently than patients in the hypertensive group, and 2.9 times more patients from the diabetic group took drugs for osteoporosis. Even when BMD is similar and the use of osteo- porosis drugs is higher, the incidences of fracture are assumed to be higher because non-skeletal problems that develop in di- abetes patients contribute to fractures. In other words, loss of balance due to peripheral neuropathy, retinopathy, postural hypotension, or hypoglycemia is known to increase the risk of falling, which could result in fractures. In our study, when pa- tients had complications such as retinopathy, peripheral neu- ropathy, and nephropathy, we observed an increase in the risk of fracture in diabetes patients. Among oral hypoglycemic agents, thiazolidinedione induces bone loss, which can cause secondary osteoporosis. Through molecular mechanisms, ad- vanced glycation end product (AGE) or receptor glycation end product (RAGE) play an important role in bone metabolism and bone strength [5,7,14]. In addition, macrovascular and peripheral vascular complications have been suggested to de- crease skeletal blood flow, although this is still controversial [17]. A decrease of the bone turnover rate has been observed in diabetes patients. This increases BMD but concommitantly inhibits recovery of bone damage, and it is assumed that this will increase the accumulation of microscopic damage [11].
More recently, and structural and metabolic changes such as low P1NP, and osteocalcin, have been proposed to have influ- ences [8]. Although the mechanism is not clear, the sulfonyl- ureas and metformin protect against fractures, as was con- firmed in this study. However, neither insulin nor thiazolidin- edion was confirmed to have any effect on fractures [6,18].
The limitations of this study are as follows. First, although there was a control group, it was a non-diabetic hypertensive group, and not all hypertensive patients received oral glucose tolerance tests or glycated hemoglobin measurements, which could have offset the increase in the risk of fracture. Addition- ally, alternate studies on changes in the risk of fracture due to hypertension are necessary. Second, the confirmed results from this study are only from one institution. Third, a limitation of retrospective study data in general is that data that have been missed may have had an influence on the results. In fact, BMD data were available only for part of all patients. Fourth, data on identification of asymptomatic cases of vertebral fractures is
limited.
Despite these limitations, to our knowledge, this study was first to evaluate overall fracture risk over a long term follow up period in a large population of type 2 diabetic patients in Ko- rea. It also provides valuable clinical information such as BMD, drug use, and relations to diabetic microvascular complications.
In conclusion, an increased tendency in fractures in Korean diabetes patients were observed even when they were receiv- ing more aggressive treatment for osteoporosis and had simi- lar BMD. Particularly for patients with complications from di- abetes, more aggressive fracture risk assessment, patient edu- cation, and appropriate medication are required to reduce the risk of fracture, especially as the disease progresses.
CONFLICTS OF INTEREST
No potential conflict of interest relevant to this article was re- ported.
ACKNOWLEDGMENTS
This study was supported by a grant from Eulji Medi-Bio Re- search Institute (EMBRI-SN-01).
REFERENCES
1. Chung YS. The medical treatment of osteoporosis. Korean J Med 2010;79:250-3.
2. Lipscombe LL, Jamal SA, Booth GL, Hawker GA. The risk of hip fractures in older individuals with diabetes: a population- based study. Diabetes Care 2007;30:835-41.
3. Strotmeyer ES, Cauley JA, Schwartz AV, Nevitt MC, Resnick HE, Bauer DC, Tylavsky FA, de Rekeneire N, Harris TB, New- man AB. Nontraumatic fracture risk with diabetes mellitus and impaired fasting glucose in older white and black adults: the health, aging, and body composition study. Arch Intern Med 2005;165:1612-7.
4. Vestergaard P. Discrepancies in bone mineral density and frac- ture risk in patients with type 1 and type 2 diabetes: a meta- analysis. Osteoporos Int 2007;18:427-44.
5. Lecka-Czernik B. Bone loss in diabetes: use of antidiabetic thi- azolidinediones and secondary osteoporosis. Curr Osteoporos Rep 2010;8:178-84.
6. Schwartz AV, Sellmeyer DE, Vittinghoff E, Palermo L, Lecka- Czernik B, Feingold KR, Strotmeyer ES, Resnick HE, Carbone
L, Beamer BA, Park SW, Lane NE, Harris TB, Cummings SR.
Thiazolidinedione use and bone loss in older diabetic adults. J Clin Endocrinol Metab 2006;91:3349-54.
7. Yamamoto M, Yamaguchi T, Yamauchi M, Sugimoto T. Low serum level of the endogenous secretory receptor for advanced glycation end products (esRAGE) is a risk factor for prevalent vertebral fractures independent of bone mineral density in pa- tients with type 2 diabetes. Diabetes Care 2009;32:2263-8.
8. Shu A, Yin MT, Stein E, Cremers S, Dworakowski E, Ives R, Rubin MR. Bone structure and turnover in type 2 diabetes mellitus. Osteoporos Int 2012;23:635-41.
9. Levey AS, Bosch JP, Lewis JB, Greene T, Rogers N, Roth D. A more accurate method to estimate glomerular filtration rate from serum creatinine: a new prediction equation. Modifica- tion of Diet in Renal Disease Study Group. Ann Intern Med 1999;130:461-70.
10. Guggenbuhl P, Meadeb J, Chales G. Osteoporotic fractures of the proximal humerus, pelvis, and ankle: epidemiology and diagnosis. Joint Bone Spine 2005;72:372-5.
11. Gerdhem P, Isaksson A, Akesson K, Obrant KJ. Increased bone density and decreased bone turnover, but no evident alteration of fracture susceptibility in elderly women with diabetes melli- tus. Osteoporos Int 2005;16:1506-12.
12. van Daele PL, Stolk RP, Burger H, Algra D, Grobbee DE, Hof- man A, Birkenhager JC, Pols HA. Bone density in non-insulin- dependent diabetes mellitus. The Rotterdam Study. Ann Intern
Med 1995;122:409-14.
13. Leslie WD, Lix LM, Prior HJ, Derksen S, Metge C, O’Neil J. Bi- phasic fracture risk in diabetes: a population-based study. Bone 2007;40:1595-601.
14. Schwartz AV, Garnero P, Hillier TA, Sellmeyer DE, Strotmeyer ES, Feingold KR, Resnick HE, Tylavsky FA, Black DM, Cum- mings SR, Harris TB, Bauer DC; Health, Aging, and Body Com- position Study. Pentosidine and increased fracture risk in older adults with type 2 diabetes. J Clin Endocrinol Metab 2009;94:
2380-6.
15. Melton LJ 3rd, Riggs BL, Leibson CL, Achenbach SJ, Camp JJ, Bouxsein ML, Atkinson EJ, Robb RA, Khosla S. A bone struc- tural basis for fracture risk in diabetes. J Clin Endocrinol Metab 2008;93:4804-9.
16. Kwon DJ, Kim JH, Chung KW, Lee JW, Kim SP, Lee HY. Bone mineral density of the spine using dual energy X-ray absorpti- ometry in patients with non-insulin-dependent diabetes mel- litus. J Obstet Gynaecol Res 1996;22:157-62.
17. Vogt MT, Cauley JA, Kuller LH, Nevitt MC. Bone mineral den- sity and blood flow to the lower extremities: the study of osteo- porotic fractures. J Bone Miner Res 1997;12:283-9.
18. Vestergaard P, Rejnmark L, Mosekilde L. Relative fracture risk in patients with diabetes mellitus, and the impact of insulin and oral antidiabetic medication on relative fracture risk. Diabeto- logia 2005;48:1292-9.