This is an Open Access article distributed under the terms of the Creative Commons At- tribution Non-Commercial License (http://creativecommons.org/licenses/by-nc/3.0/) which permits unrestricted non-commercial use, distribution, and reproduction in any medium, provided the original work is properly cited.
The Small Rice Bowl-Based Meal Plan was Effective at Reducing Dietary Energy Intake, Body Weight, and Blood Glucose Levels in Korean Women with Type 2 Diabetes Mellitus
Hee Jung Ahn1,*, Kyung Ah Han2,*, Hwi Ryun Kwon1, Kyung Wan Min1,2
1Diabetes Center, Eulji Hospital, Seoul,
2Department of Internal Medicine, Eulji University School of Medicine, Daejeon, Korea
Background: The typical Korean diet includes rice, which is usually served in a rice bowl. We investigated the effects of a meal plan using rice bowls of varying sizes on dietary energy intake (EI), body weight (BW), and blood glucose levels.
Methods: Forty-two obese women with type 2 diabetes mellitus were randomly assigned to use either a 200 mL small rice bowl (SB), a 380 mL regular rice bowl (RB), or to a control group (C). Both intervention groups were asked to reduce their EI by 500 kcal/day for 12 weeks and simple instructions for using the assigned bowl were provided. Dietary EI and proportion of macronu- trients (PMN) were estimated from 3-day dietary records.
Results: Reduction of EI was more prominent in the SB group compared to the RB and C group, although EI decreased signifi- cantly from baseline in all groups. Carbohydrate and fat intakes of the SB group were decreased greater than those of the RB and C group. However, changes in PMN were not significant across the 3 groups. Reduction of BW and HbA1c levels in the SB group was more prominent compared to the C group. Although, BW and HbA1c were decreased significantly from baseline in both bowl groups. There was no statistical difference between the two groups.
Conclusion: The small rice bowl-based meal plan was effective at reducing EI, BW, and blood glucose levels, and the observed reductions in EI, carbohydrate, and fat intake were greater than those of the regular rice bowl-based meal plan.
Keywords: Diabetes mellitus, type 2; Diabetic diet; Education; Obesity; Weight loss
Corresponding author: Kyung Wan Min
Diabetes Center, Eulji Hospital, 280-1 Hagye 1-dong, Nowon-gu, Seoul 139-872, Korea
E-mail: [email protected]
INTRODUCTION
The majority of type 2 diabetes mellitus patients are obese, and the risk of developing diabetes is affected by body weight gain [1,2]. For such reasons, the American Diabetes Association recommends a decrease in the body weight of obese diabetes patients or people who are at risk for diabetes [3].
The increasing prevalence of obesity is paralleled by increas-
ing portion sizes. It has been shown in several experimental trials that portion size is an important factor in total energy intake [4]. Rolls et al. [5] reported that when serving sizes are doubled, total energy intake increased even more. Pedersen et al. [6] gave obese type 2 diabetes mellitus patients a controlled diet using partitioned plates, divided for carbohydrates, pro- tein, cheese and sauce sections. The plate group education lost more body weight than a group receiving general diabetes reg- pISSN 1976-9180 · eISSN 2093-2650
ulation, and it was reported that the effective dosage of oral anti-diabetic agents could also be decreased. For this reason, one of the methods for decreasing the body weight of obese individuals is reducing serving size. Some organizations rec- ommend using smaller plates in order to decrease the size of the portions to reduce total energy intake [7]. Rolls et al. [8]
applied varying plate sizes, and when similar menus were avail- able, the use of smaller plates decreased the total energy intake;
however, it was reported that this method was ineffective.
According to the 2005 National Health and Nutrition Ex- amination Survey [9], 70% of total energy intake in Korean women with diabetes is consumed as carbohydrates. Such re- sults show that Korean women with diabetes consume high- carbohydrate diets. It was reported that the primary dietary source of carbohydrates was rice [9]. We reported that among diabetes patients who eat three meals per day, 96.4% of them consume over two meals of rice per day [10], which suggests that the proportion of rice per meal in Korean type 2 diabetes mellitus patients is very high.
In this study, the median size of the rice bowl used by diabe- tes patients was 350 mL and the size of the rice bowl correlated with the intake of energy intake from rice [10]. In previous study [11], a 200 mL rice bowl was effective at reducing total energy intake and carbohydrate intake after a two week period in over- weight and obese patients. However, because this result was just compared before and after intervention, it was difficult to determine the effect of bowl size on total energy intake and carbohydrate intake, especially considering that the short study duration (2 weeks) limited the observable body weight loss.
In the present study, obese Korean women with type 2 dia- betes mellitus consumed rice as a staple food. We have at- tempted to determine if rice bowl size has any effect on total energy intake, carbohydrate intake, body weight, and blood glucose levels. We also observed whether the rice bowls 50%
smaller than regular rice bowl had any metabolic effect.
METHODS
Subjects
Subjects were female type 2 diabetic patients who visited the Eulji Hospital diabetes outpatient clinic between September 2007 and November 2008. They were informed about the pur- pose and procedures involved in this study and all agreed to participate. At the conclusion of the 12-week intervention pe- riod, a total of 42 patients were analyzed. The diagnosis of type
2 diabetes mellitus in this study followed the diagnostic stan- dards established by the American Diabetes Association in 1997. Participants in this study were between the ages of 20 and 70, had a body mass index (BMI) ≥ 23 kg/m2, and glyco- sylated hemoglobin (HbA1c) levels between 6.0% and 10%.
The following conditions were cause for exclusion from this study: patients treated with insulin or thiazolidinedione medi- cations, patients who consumed more than one alcoholic bev- erage per day, patients who ate out more than twice per week, patients with special diets (e.g., vegetarians), patients who were unable to exercise, patients with indigestion, anorexia, gesta- tional diabetes, malignant tumors, cardiovascular disease, pa- tients who had consumed body weight loss drugs in the last three months, patients who were difficult to follow, and patients who refused investigation.
Method
After the subjects enrolled, they were divided into small rice bowl group, regular rice bowl group, or control group, with the random number table. Four weeks of screening period was followed by 12 weeks’ intervention period. During the study period, the type and dosage of oral anti-diabetic agents, blood pressure drugs, and anti-lipid drugs were consistently main- tained. However, in cases where blood glucose was measured to be less than 70 mg/dL, or in cases showing symptoms of hy- poglycemia, we decreased sulfonylurea dosages in the oral hy- poglycemic agents by 25% to 50%.
Food energy intake and total energy consumption survey To determine food energy intake and nutrient intake, the rice bowl groups kept dietary records 3 days per week (2 weekdays and 1 weekend day) and reported to us a minimum of once ev- ery two weeks. Daily total energy expenditure was monitored using a pedometer (HE-500; Healthengine, Yokohama, Japan), which was recorded during each visit.
The subjects were educated on the diet record method sim- ply before writing the record sheet actually and they were asked to write amount and kinds of all foods taken for a meal, nutri- tion supplementary foods and snack for a day on the dietary record sheet by themselves. To increase accuracy of the record, a registered dietitian reviewed contents of the sheets by using real-sized food models measuring cups, measuring spoons, when the sheets were returned. For a dietary record resource, CAN-Pro (computer-aided nutritional analysis program, ver- sion 2.0; Korean Nutrition Society, Seoul, Korea) was used to
convert nutrient intake for further analysis.
Diet and exercise education
The subjects maintained ordinary food intake and exercise during the screening period. The small rice bowl group con- sumed 170-230 kcal of rice per day from a 200 mL bowl (Pro- fessional Ceramics [Sunsoodoyeh], Seoul, Korea). The regular rice bowl group consumed 380-480 kcal of rice per day from a 380 mL bowl (Worldware, Seoul, Korea) [10]. For 12 weeks, individuals in both groups aimed to lose 0.45 kg/wk by reduc- ing their regular dietary intake by 500 kcal/day. The propor- tions of carbohydrate, protein and fat to the total energy intake were recommended to be 55–60%: 15-20%: 20-25%, respec- tively [12]. To accomplish this, the subjects were supplied with leaflet corresponding to prescribed energy and were educated on tips for putting rice into the bowl and taking side dishes, within 5-10 minutes individual education. Study participants consumed an average of 1,900 kcal/day and aimed to consume at least 1,400 kcal/day. In case of 1,400 kcal, the Korea Diabe- tes Association recommends 7 exchange units of starch per day, which means 700 kcal of rice per day. So, 2 meals in a day contain 200 kcal and one meal in a day contains 300 kcal.
In the small rice bowl group, bowls were full of rice but not overflowing in case of 200 kcal and filled beyond the brim slightly overflowing in case of 300 kcal. In the regular rice bowl group, bowls were filled by half in case of 200 kcal and by three quarters in case of 300 kcal.
They were asked to use the bowl for every meal and carbo- hydrate sources such as bread, rice cake, potato, sweet potato were limited through the leaflet. Noodle could substitute for rice but any specific amount for that was not suggested. Fruit intake was shown as the amount per day through the leaflet.
For fish, meat and vegetables, the subjects were educated with pictures of diet fitting each food exchanges unit and were asked to practice it but that was not emphasized intensively at each visit. The picture of diet of fish, meat and vegetables were in- cluded in the leaflet by focusing on foods frequently found in the preliminary survey.
For the control group, dietary education was offered based on the diabetic dietary guideline of Korean Diabetes Associa- tion and food intake was investigated at the start of the study and after 12 weeks.
All subjects were given pedometers (HE-500) to measure total energy expenditure. The same pedometer was used for the duration the study period (12 weeks).
Physical measurement and biochemical test
At the beginning of the study and during each visit, height, body weight, and waist circumference were measured. Subjects were measured for height and body weight dressed in a thin clothe.
BMI was calculated by dividing the body weight (kg) with the square of the height (m2). The narrowest line between the lower rib and iliac crest was measured as waist circumference with a tapeline when a subject breathed out easily, and blood pres- sure was gauged in a sitting posture with a mercury sphygmo- manometer (Yamasu Co., Saitama, Japan) after10 minutes of rest.
Blood chemistry measurements were taken for all groups at the beginning of the study, and 12 weeks later. Venous blood samples were collected following a 10-hour or longer fast. Sam- ples were separated via centrifuge at 3,000 rpm for 15 minutes.
Serum was isolated, stored at -70°C, and used for analysis. Fast- ing blood glucose levels were measured using the glucose oxi- dation method, and HbA1c was measured using the HPLC method, based on a cation exchange resin. Total cholesterol, triglycerides, high density lipoprotein cholesterol (HDL-C), and low density lipoprotein cholesterol (LDL-C) were exam- ined with kits using enzymatic reactions and an automatic biochemical analyzer (Hitachi 7170; Hitachi, Tokyo, Japan).
Compliance with rice bowl use
To assess compliance of use of rice bowl, the subjects were asked to record whether they used the provided bowls during break- fast, lunch, or dinner. During biweekly visits, subjects were in- structed to bring their compliance reports and rice bowl usage compliance was calculated as a percentage. During each visit, the reported values were averaged and overall compliance was calculated as:
Compliance of use of rice bowl (%) = frequency of using bowls/number of total meals × 100.
Data analysis and statistical analysis
Using the statistics program SPSS version 15.0 (SPSS Inc., Chi- cago, IL, USA), we calculated means and standard deviations for the measured items. Variables that did not follow a normal distribution were analyzed following log transformation. To compare the data among three groups (small rice bowl, regu- lar rice bowl and control), one-way ANOVA test with a Tukey post-hoc analysis was used. A paired t-test was used to com- pare the groups before and after the intervention period. Cate- gorical variables were compared using a cross-analysis. P val-
ues less than 0.05 were considered to be statistically significant.
RESULTS
General characteristics of the subjects
A total of 42 subjects were enrolled in this study, and all sub- jects continued the study for the full 16-week duration. The mean age of the subjects was 55.1 ± 7.1 years. The mean dura- tion of diabetes was 4.3 ± 3.9 years and mean BMI was 27.5 ± 3.6 kg/m2. The mean fasting blood glucose level was 147.1 ± 31.2 mg/dL and the mean HbA1c level was 7.6 ± 0.9%. The groups did not show any significant difference in age, duration of diabetes, BMI, fasting blood glucose levels, and HbA1c lev- els. For diabetes treatments, the proportion of a life style mod- ification only, combination of metformin and sulfonylurea,
sulfonylurea only and, metformin only therapy were 57.8%, 26.7%, 4.4%, and 11.1%, respectively. Among the patients tak- en sulfonylurea, the 31.6% of them reduced their sulfonylurea dosage due to hypoglycemia during intervention period. By the conclusion of the study, the mean sulfonylurea dosage had been reduced to 50% of the initial dosage. There was no differ- ence in the reduced amount of the drug dosage among the groups. The dietary energy intakes and number of steps were 1,928 ± 216 kcal and 9,895 ± 4,042, respectively, with no sig- nificant differences among the groups. The proportions of car- bohydrate, protein and fat to the total energy intake were 64.0
± 5.8%, 16.1 ± 2.4% and 20.2 ± 4.4%, respectively. There was no significant difference among the three groups (Table 1).
The proportion of carbohydrates in the diet was higher than that recommended by the Korean Diabetes Association (55- Table 1. Baseline characteristics
Characteristic Intervention assignment
P valuea
SB RB C
No. of subjects 17 14 11
Age, yr 54.4 ± 6.2 56.2 ± 8.1 54.8 ± 7.7 0.781
BMI, kg/m2 28.7 ± 4.7 26.8 ± 2.6 26.6 ± 2.4 0.234
Waist circumference, cm 92.2 ± 9.7 86.1 ± 7.5 87.6 ± 5.9 0.108
Diabetes duration, yr 5.3 ± 3.6 3.0 ± 3.9 4.5 ± 4.3 0.268
Laboratory data
FPG, mg/dL 145.3 ± 29.2 148.1 ± 28.6 148.6 ± 39.6 0.955
HbA1c, % 7.7 ± 0.8 7.8 ± 0.9 7.2 ± 0.9 0.218
SBP, mm Hg 127.1 ± 16.5 131.1 ± 11.9 121.8 ± 10.8 0.259
DBP, mm Hg 78.8 ± 8.6 80.0 ± 9.6 79.3 ± 7.3 0.931
TC, mg/dL 152.3 ± 30.7 172.8 ± 33.2 177.0 ± 17.0 0.056
TG, mg/dL 116.7 ± 54.1 155.1 ± 124.9 145.6 ± 124.1 0.554
HDL, mg/dL 42.3 ± 8.8 49.7 ± 15.5 40.0 ± 5.7 0.070
LDL, mg/dL 98.3 ± 28.8 102.4 ± 25.1 110.9 ± 15.9 0.378
EI and expenditure
Dietary EI, kcal 1,932 ± 233 1,924 ± 234 1,924 ± 182 0.993
Daily total number of steps 9,157 ± 1,079 10,303 ± 1,200 10,656 ± 2,587 0.856
Macronutrient intake
Carbohydrate, % of EI 65.3 ± 6.4 62.7 ± 5.7 63.7 ± 4.8 0.455
Protein, % of EI 15.3 ± 2.1 16.9 ± 2.4 16.5 ± 2.5 0.135
Fat, % of EI 21.0 ± 4.9 20.2 ± 4.4 18.9 ± 3.5 0.638
Values are presented as mean ± standard deviation.
SB, small size rice bowl (200 mL bowl); RB, regular size rice bowl (380 mL bowl); C, control; BMI, body mass index; FPG, fasting plasma glu- cose; HbA1c, glycosylated hemoglobin; SBP, systolic blood pressure; DBP, diastolic blood pressure; TC, total cholesterol; TG, triglycerides;
HDL, high density lipoprotein; LDL, low density lipoprotein; EI, energy intake.
aP values are for comparison among the groups by one-way ANOVA test.
60%). During the 12-week intervention period, the frequencies of rice bowl use during breakfast, lunch, and dinner were 75.4
± 24.3%, 47.6 ± 28.9%, and 60.5 ± 25.8%, respectively. Be- tween the small and regular rice bowl groups, there was no significant difference in frequency of usage.
Changes in total energy intake and carbohydrate intake As changes of dietary energy intake and step counts per day during 12 weeks were not consistent, their averages for the 12 weeks were used. Dietary energy intake and nutrient intake were assessed with 3-day dietary record. Dietary energy intake was significantly reduced by -583 ± 203 kcal/day (-30.1 ± 9.8%) and -294 ± 245 kcal/day (-14.8 ± 12.8%) and -130 ± 76 kcal/
day (-6.9 ± 3.9%) in the small rice bowl group, regular rice bowl group and control group, respectively in 12 weeks (P < 0.001).
After 12 weeks, there was a difference in total energy intake
decrease among the groups (P < 0.001), with the small rice bowl group having a greater decrease than the regular rice bowl group and control group (P < 0.05 and P < 0.05, respectively).
The total energy intake of the small rice bowl group decreased by 15.3% more than the regular rice bowl group (Fig. 1). Total number of steps was not different in 12 weeks compared to their initial levels and the change of the three groups were also not significantly different (Table 2).
During the 12-week intervention period, there was a signif- icant decrease in carbohydrate intake in the three groups (P <
0.05). There was a difference among the three groups in their carbohydrate intake decrease (P < 0.001) and the small rice bowl group had a more significant decrease than the control and regular rice bowl group (P < 0.05 and P < 0.05, respectively).
After 12 weeks, rice bowl group showed significantly reduc- tion protein intake (P < 0.05) and the reduction amount of pro-
Fig. 1. Change of EI (A), carbohydrate intake (B), fat intake (C) and protein intake (D) after 12-week’s intervention in obese women with type 2 diabetes mellitus. The reduction in EI, carbohydrate, and fat intake in the SB group was more prominent than that in the C group (P < 0.05). The reduction of EI and carbohydrate intake in the SB group was greater than that in the RB group (P < 0.05). C, control; EI, energy intake; SB, small size rice bowl (200 mL bowl); RB, regular size rice bowl (380 mL bowl). aP val- ues < 0.05 vs. C group, bP values < 0.05 vs. RB group.
Change of fat intake (g) a, b
SB RB C
50 25 0 -25 -50
Change of protein intake (g)
SB RB C
50 25 0 -25 -50 a, b
Change of EI (kcal/day) a
SB RB C
0 -200 -400 -600
-800 a, b a
Change of carbohydrate intake (g)
SB RB C
0 -100 -200 -300 A -400
C
B
D
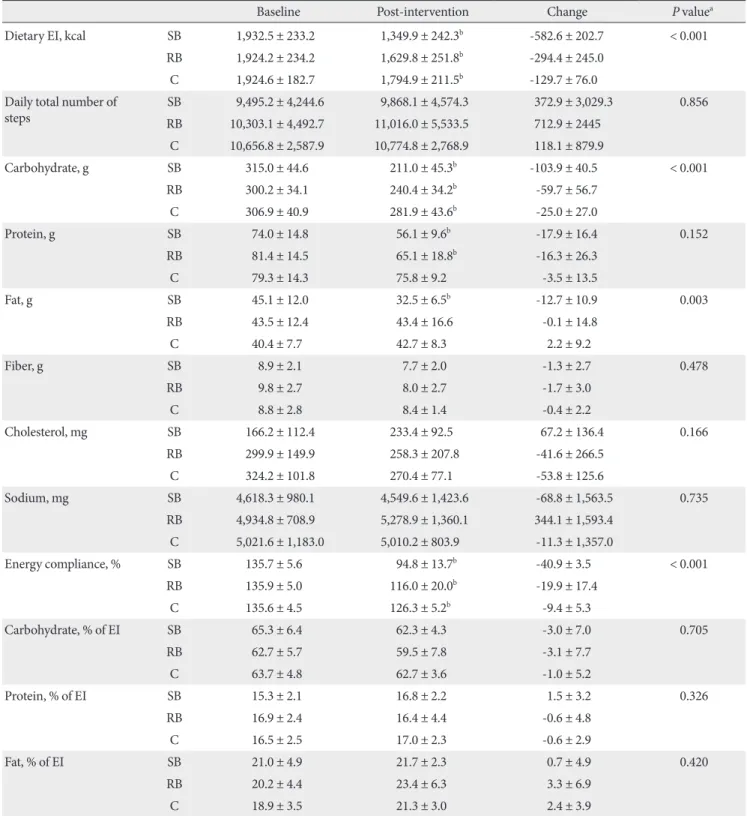
Table 2. Changes in dietary energy intake, macronutrient composition
Baseline Post-intervention Change P valuea
Dietary EI, kcal SB 1,932.5 ± 233.2 1,349.9 ± 242.3b -582.6 ± 202.7 < 0.001
RB 1,924.2 ± 234.2 1,629.8 ± 251.8b -294.4 ± 245.0
C 1,924.6 ± 182.7 1,794.9 ± 211.5b -129.7 ± 76.0
Daily total number of
steps SB 9,495.2 ± 4,244.6 9,868.1 ± 4,574.3 372.9 ± 3,029.3 0.856
RB 10,303.1 ± 4,492.7 11,016.0 ± 5,533.5 712.9 ± 2445 C 10,656.8 ± 2,587.9 10,774.8 ± 2,768.9 118.1 ± 879.9
Carbohydrate, g SB 315.0 ± 44.6 211.0 ± 45.3b -103.9 ± 40.5 < 0.001
RB 300.2 ± 34.1 240.4 ± 34.2b -59.7 ± 56.7
C 306.9 ± 40.9 281.9 ± 43.6b -25.0 ± 27.0
Protein, g SB 74.0 ± 14.8 56.1 ± 9.6b -17.9 ± 16.4 0.152
RB 81.4 ± 14.5 65.1 ± 18.8b -16.3 ± 26.3
C 79.3 ± 14.3 75.8 ± 9.2 -3.5 ± 13.5
Fat, g SB 45.1 ± 12.0 32.5 ± 6.5b -12.7 ± 10.9 0.003
RB 43.5 ± 12.4 43.4 ± 16.6 -0.1 ± 14.8
C 40.4 ± 7.7 42.7 ± 8.3 2.2 ± 9.2
Fiber, g SB 8.9 ± 2.1 7.7 ± 2.0 -1.3 ± 2.7 0.478
RB 9.8 ± 2.7 8.0 ± 2.7 -1.7 ± 3.0
C 8.8 ± 2.8 8.4 ± 1.4 -0.4 ± 2.2
Cholesterol, mg SB 166.2 ± 112.4 233.4 ± 92.5 67.2 ± 136.4 0.166
RB 299.9 ± 149.9 258.3 ± 207.8 -41.6 ± 266.5
C 324.2 ± 101.8 270.4 ± 77.1 -53.8 ± 125.6
Sodium, mg SB 4,618.3 ± 980.1 4,549.6 ± 1,423.6 -68.8 ± 1,563.5 0.735
RB 4,934.8 ± 708.9 5,278.9 ± 1,360.1 344.1 ± 1,593.4
C 5,021.6 ± 1,183.0 5,010.2 ± 803.9 -11.3 ± 1,357.0
Energy compliance, % SB 135.7 ± 5.6 94.8 ± 13.7b -40.9 ± 3.5 < 0.001
RB 135.9 ± 5.0 116.0 ± 20.0b -19.9 ± 17.4
C 135.6 ± 4.5 126.3 ± 5.2b -9.4 ± 5.3
Carbohydrate, % of EI SB 65.3 ± 6.4 62.3 ± 4.3 -3.0 ± 7.0 0.705
RB 62.7 ± 5.7 59.5 ± 7.8 -3.1 ± 7.7
C 63.7 ± 4.8 62.7 ± 3.6 -1.0 ± 5.2
Protein, % of EI SB 15.3 ± 2.1 16.8 ± 2.2 1.5 ± 3.2 0.326
RB 16.9 ± 2.4 16.4 ± 4.4 -0.6 ± 4.8
C 16.5 ± 2.5 17.0 ± 2.3 -0.6 ± 2.9
Fat, % of EI SB 21.0 ± 4.9 21.7 ± 2.3 0.7 ± 4.9 0.420
RB 20.2 ± 4.4 23.4 ± 6.3 3.3 ± 6.9
C 18.9 ± 3.5 21.3 ± 3.0 2.4 ± 3.9
Values are presented as mean ± standard deviation.
EI, energy intake; SB, small size rice bowl (200 mL bowl); RB, regular size rice bowl (380 mL bowl); C, control.
aP values are for comparison for changes from baseline to post-intervention among the groups by one-way ANOVA test, statistically significant in Tukey post-hoc analysis, bP values < 0.05 are for comparison between baseline and intervention within a group by paired t-test.
tein intake was not significantly different among the three groups. There also was a significant decrease in fat intake in the small rice bowl group (P < 0.001), which was greater than that of the regular rice bowl and control group (P < 0.05, P <
0.05, respectively) (Fig. 1).
Although the proportions of carbohydrate, protein and fat to total energy intake initially recorded 64.1:16.0:20.6%, they changed into 61.0:16.6:22.5% in 12 weeks which were more similar with the proportions recommended by Korea Diabetes Association. There was no significant difference among the groups. Fiber, cholesterol and sodium intake were also not dif- ferent in 12 weeks compared to their initial levels and the changes of the three groups were also not significantly differ- ent (Table 2).
Change in body weight
During the 12-week study period, the small rice bowl group, the regular rice bowl group and control group showed signifi- cantly reduced body weight by -3.7 ± 2.4 kg (-5.1 ± 2.6%), -2.5
± 2.4 kg (-3.8 ± 3.8%) and -1.5 ± 2.4 kg (-2.3 ± 1.8%) (P < 0.01).
All three groups had differences in the changes for body weight loss (P = 0.031); the small rice bowl group showed a significant decrease in body weight compared to the control group (P <
0.05) (Fig. 2). Following the 12 week study period, the small rice bowl group, regular rice bowl group and control group showed significantly reduced waist circumferences by -4.8 ± 3.8 cm (-5.1 ± 3.7%), -3.4 ± 3.8 cm (-3.8 ± 4.2%), and -1.6 ± 1.3 cm (-1.8 ± 1.5%), respectively and there was no significant dif- ference in the reduced level among the groups (Table 3).
Change in blood glucose and lipid levels
After the 12-week study period, HbA1c levels in the small rice bowl and regular rice bowl group decreased significantly: -0.8
± 0.6% and -0.8 ± 0.7%, respectively (P < 0.001). There was significant difference in the decrease in HbA1c levels among the groups (P = 0.025); the small rice bowl and regular rice bowl group had greater decrease than the control group (P <
0.05). However, there was no significant difference in the re- duced HbA1c levels between the bowl groups (Fig. 2).
Total cholesterol, triglycerides, HDL-C and LDL-C levels were not different in 12 weeks compared to their initial levels and the changes of the three groups were also not significantly different. Systolic blood pressure was decreased significantly in the small rice bowl group (P < 0.05) but there was no signif- icant difference in the reduced levels among the three groups (Table 3).
DISCUSSION
The American Diabetes Association recommends that obese type 2 diabetes mellitus patients should reduce their dietary energy intake by 500-1,000 kcal [13] and initially result in a loss of 0.5–1 kg/wk. Several organizations recommend the use of smaller dishes as a strategy for reducing the portion size, with the goal of decreasing energy intake [14]. In one study, Rolls et al. [5] provided 500 g and 1,000 g of macaroni and cheese and reported that doubling one serving size (to 1,000 g) increased energy intake by 30%. In another study, Kral et al. [15] provid- ed meals composed of pasta, vegetables, and cheese at 500 g,
Fig. 2. Change in body weight (A) and HbA1c (B) after 12-week bowl intervention or control in obese women with type 2 dia- betes mellitus. BW decreased in the SB group but not in the RB group, compared to the C group (P < 0.05). HbA1c levels de- creased in the bowl groups without difference between the bowl groups (P < 0.05). HbA1c, glycosylated hemoglobin; BW, body weight; C, control; SB, small size rice bowl (200 mL bowl); RB, regular size rice bowl (380 mL bowl). aP values < 0.05 vs. C group.
a A
Percent change of BW (%)
SB RB C
0 -1 -2 -3 -4 -5
a a
Change of HbA1c (%)
SB RB C
0 -1 -2 -3 -4
-5 B
700 g, and 900 g. They reported that the 900 g serving resulted in a 20% greater energy intake than the 500 g serving. Rolls et al. [8] provided equal quantities of food on 17 cm, 22 cm, and 26 cm plates, each used on different days. Using the small plate did not show to a reduction in food intake.
In this study, we attempted to reduce dietary energy intake by 500 kcal in obese type 2 diabetes mellitus patients through portion control using varying rice bowl sizes. The small rice bowl group reduced total energy intake by -583 kcal, the regu- lar rice bowl group by -294 kcal. The dietary energy intake of Table 3. Change in body weight, blood glucose, and plasma lipids
Baseline Post-intervention Change P valuea
BW, kg SB 70.7 ± 10.6 66.9 ± 10.6b -3.7 ± 2.4 0.031
RB 64.7 ± 6.4 62.3 ± 6.4b -2.5 ± 2.4
C 64.2 ± 4.8 62.8 ± 5.1b -1.5 ± 1.1
BMI, kg/m2 SB 28.7 ± 4.7 27.1 ± 4.1b -1.5 ± 1.0 0.041
RB 26.8 ± 2.6 25.8 ± 2.8b -1.0 ± 1.0
C 26.6 ± 2.4 26.0 ± 2.2b -0.6 ± 0.5
Waist circumference, cm SB 92.2 ± 9.7 87.4 ± 8.8b -4.8 ± 3.8 0.071
RB 86.1 ± 7.5 82.7 ± 6.9b -3.4 ± 3.8
C 86.6 ± 5.1 85.0 ± 5.2b 1.6 ± 1.3
SBP, mm Hg SB 127.1 ± 16.5 118.8 ± 13.6b -8.2 ± 11.3 0.132
RB 131.1 ± 11.9 123.6 ± 10.8 -7.5 ± 15.7
C 122.0 ± 11.4 124.0 ± 8.4 2.0 ± 12.2
DBP, mm Hg SB 78.8 ± 8.6 75.3 ± 7.2 -3.5 ± 9.3 0.677
RB 80.0 ± 9.6 77.9 ± 4.3 -2.1 ± 10.5
C 79.3 ± 7.3 79.1 ± 7.0 -0.2 ± 9.4
HbA1c, % SB 7.7 ± 0.8 7.0 ± 0.8b -0.8 ± 0.6 0.025
RB 7.8 ± 0.9 7.0 ± 1.0b -0.8 ± 0.7
C 7.2 ± 0.9 7.2 ± 0.9 -0.0 ± 0.9
TC, mg/dL SB 152.3 ± 30.7 155.4 ± 29.7 3.1 ± 30.5 0.158
RB 172.8 ± 33.2 155.2 ± 41.1 -17.5 ± 44.0
C 177.0 ± 17.0 183.1 ± 23.4 -6.1 ± 23.1
TG, mg/dL SB 116.7 ± 54.1 98.5 ± 37.8 -18.2 ± 44.8 0.627
RB 155.1 ± 124.9 115.1 ± 70.7 -40.0 ± 122.8
C 145.6 ± 124.0 134.5 ± 110.5 -11.2 ± 42.3
HDL, mg/dL SB 42.3 ± 8.8 44.8 ± 7.8 2.5 ± 4.9 0.624
RB 49.7 ± 15.5 49.4 ± 13.6 -0.4 ± 12.2
C 40.0 ± 5.7 40.2 ± 6.8 1.2 ± 8.0
LDL, mg/dL SB 98.2 ± 28.8 95.1 ± 28.2 -3.2 ± 32.5 0.529
RB 102.4 ± 25.1 95.4 ± 35.9 -7.0 ± 43.7
C 110.9 ± 15.8 119.2 ± 15.7 8.2 ± 19.3
Values were presented as mean ± standard deviation.
BW, body weight; SB, small size rice bowl (200 mL bowl); RB, regular size rice bowl (380 mL bowl); C, control; BMI, body mass index; SBP, sys- tolic blood pressure; DBP, diastolic blood pressure; HbA1c, glycosylated hemoglobin; TC, total cholesterol; TG, triglycerides; HDL, high densi- ty lipoprotein; LDL, low density lipoprotein.
aP values are for comparison for changes from baseline to post-intervention among the groups by one-way ANOVA test, statistically significant in Tukey post-hoc analysis, bP values < 0.05 are for comparison between baseline and post-intervention within group by paired t-test.
the small rice bowl group was reduced compared to the control group. Reducing the size of the serving bowl by 50% (small rice bowl vs. regular rice bowl) appears to reduce dietary energy intake by 15% (289 kcal/day). Thus, the reason why the results of this study differ from those reported by Rolls et al. may be because the process of filling the small rice bowl with smaller portions was measured exactly, resulting in a total energy in- take decrease. Steyn et al. [16] showed subjects 29 g of rice 30 minutes after a portion size demonstration, and had the patients choose the portion that was closest to the 29 g portion that they had seen in a 3-D food model. Half the subjects were able to match the portions of equal size, while the others mistook 50 g servings to be 29 g servings. This result shows that patients recognize food portions as being larger than they truly are, and it is possible that consumption is then greater than expected.
To reduce body weight and blood glucose levels in obese type 2 diabetes mellitus patients, total energy intake and ap- propriate proportions of macronutrients intake should be em- phasized. The Korean Diabetes Association [17] advises dia- betes patients to consume diets that consist of 55-60% carbo- hydrates, 15-20% protein, and 20-25% fat. According to a sur- vey of dietitians from general hospitals done by the Food and Nutrition Commission of the Korean Diabetes Association [18], 89.1% educate patients using a food exchange table. Edu- cation of obese type 2 diabetes mellitus patients using the small rice bowl proved to be just as effective as the food exchange ta- ble in meeting the recommended levels of carbohydrates, pro- tein, and fat [19]. The applied education method for using the small rice bowl reduced the intake of carbohydrates, protein, and fat. In this study, carbohydrate intakes for the small rice bowl group were reduced by more than those of the control group. Reducing the size of the serving bowl also reduces the amount of carbohydrate intake. Additionally, the fat intake in the small rice bowl group was significantly reduced following the 12-week study period. Similar results were observed in a previous experiment [19].
The reason that fat intake was reduced in the small rice bowl group was solely based on reduction of rice portion size. This is because rice is a staple in a typical Korean diet, and the con- sumption of soybean oil and sesame oil, which are added to side dishes, has an effect on energy intake [19].
The American Diabetes Association recommends that obese type 2 diabetes mellitus patients reduce their body weight by 5-10%. By reducing dietary energy intake by 500-1,000 kcals, patients can expect to reduce their body weight by 8% in 6
months [13]. In this study, educating subjects on the applica- tion of the bowls for a 12-week period resulted in a 5.1% reduc- tion in body weight in the small rice bowl group, compared to a 2.3% reduction in the control group, which was a significant reduction in body weight. However, the body weight did not show larger reduction in the standard bowl group than control group.
In type 2 diabetes mellitus patients, medical nutrition ther- apy by registered dietitians was associated with a 0.2-2.9% de- crease in HbA1c after 3-6 months [3]. Wilson et al. [20] report- ed that medical nutrition therapy by registered dietitians was associated with a 0.26-0.32% decrease in HbA1c in patients with type 2 diabetes mellitus (average HbA1c 8%). Kim et al.
[21] utilized a food exchanges table oriented towards Korean diabetes patients for 12 weeks using the combined diet and ex- ercise strategies recommended by the diabetes association as a guide, HbA1c levels decreased by 0.7% (from 8.9% to 8.2%).
In this study, reducing carbohydrate intake using rice bowl in obese type 2 diabetes patients decreases the HbA1c in small rice bowl group and regular rice bowl group. But even though dietary total energy intake and carbohydrate intake was reduced more in small rice bowl group. There was no significant differ- ence in HbA1c levels between small rice bowl group and regu- lar rice bowl group, which was due to the effects of different oral anti-diabetic agents, duration of diabetes, initial glycated hemoglobin levels, and exercise level [22].
In this study, we observed that Korean type 2 diabetes mel- litus patients who consumed rice-centered meals using small rice bowls had lower total energy intake and carbohydrate in- takes compared to a control group, which in turn reduced body weight and blood glucose levels. There was more significant reduction in total energy intake and carbohydrate intake in small rice bowl group than regular rice bowl group without additional dietary education. But, there was no addition bene- fit in body weight and glucose control because the regular rice bowl group and control group had more patients who were regulating diabetes through diet and exercise than the small rice bowl group. The regular rice bowl and control groups also had shorter duration of diabetes and consisted of patients with higher HbA1c levels.
Because this study was conducted only in a single hospital and its sample size was small, the effects and changes of body weight and HbA1c levels could not be examined.
In addition, future studies are needed to compare effects of education using varying rice bowl size with obese patients with
different knowledge levels, gender and age. In particular, this study had limitations that it examined only women who took relatively more carbohydrate and followed further management relatively well and that it did not show clinical outcomes of vari- ous groups.
REFERENCES
1. Li Z, Hong K, Saltsman P, DeShields S, Bellman M, Thames G, Liu Y, Wang HJ, Elashoff R, Heber D. Long-term efficacy of soy-based meal replacements vs an individualized diet plan in obese type II DM patients: relative effects on weight loss, meta- bolic parameters, and C-reactive protein. Eur J Clin Nutr 2005;
59:411-8.
2. Colditz GA, Willett WC, Rotnitzky A, Manson JE. Weight gain as a risk factor for clinical diabetes mellitus in women. Ann In- tern Med 1995;122:481-6.
3. American Diabetes Association. Standards of medical care in diabetes--2010. Diabetes Care 2010;33 Suppl 1:S11-61.
4. Ledikwe JH, Ello-Martin JA, Rolls BJ. Portion sizes and the obe- sity epidemic. J Nutr 2005;135:905-9.
5. Rolls BJ, Morris EL, Roe LS. Portion size of food affects energy intake in normal-weight and overweight men and women. Am J Clin Nutr 2002;76:1207-13.
6. Pedersen SD, Kang J, Kline GA. Portion control plate for weight loss in obese patients with type 2 diabetes mellitus: a controlled clinical trial. Arch Intern Med 2007;167:1277-83.
7. Hebert JR, Ma Y, Clemow L, Ockene IS, Saperia G, Stanek EJ 3rd, Merriam PA, Ockene JK. Gender differences in social de- sirability and social approval bias in dietary self-report. Am J Epidemiol 1997;146:1046-55.
8. Rolls BJ, Roe LS, Halverson KH, Meengs JS. Using a smaller plate did not reduce energy intake at meals. Appetite 2007;49:
652-60.
9. Ministry of Health and Welfare. The Korean national health nutrition examination survey 2005. Seoul: Ministry of Health and Welfare; 2007.
10. Ahn HJ, Koo BK, Jung JY, Kwon HR, Chung MY, Ku YH, Kim JT, Han KA, Min KW. Association between volume of bowls and the dietary intakes in subjects with type 2 diabetes. Korean Diabetes J 2009;33:335-43.
11. Ahn HJ, Eom YK, Han KA, Kwon HR, Kim HJ, Park KS, Min KW. The effects of small sized rice bowl on carbohydrate intake
and dietary patterns in women with type 2 diabetes. Korean Diabetes J 2010;34:166-73.
12. Korean Diabetes Association. A guideline for diabetes educa- tion. 2nd ed. Seoul: Gold Agency; 2006.
13. Klein S, Sheard NF, Pi-Sunyer X, Daly A, Wylie-Rosett J, Kulkar- ni K, Clark NG; American Diabetes Association; North Amer- ican Association for the Study of Obesity; American Society for Clinical Nutrition. Weight management through lifestyle modification for the prevention and management of type 2 di- abetes: rationale and strategies: a statement of the American Diabetes Association, the North American Association for the Study of Obesity, and the American Society for Clinical Nutri- tion. Diabetes Care 2004;27:2067-73.
14. Ello-Martin JA, Ledikwe JH, Rolls BJ. The influence of food portion size and energy density on energy intake: implications for weight management. Am J Clin Nutr 2005;82(1 Suppl):
236S-41S.
15. Kral TV, Roe LS, Rolls BJ. Combined effects of energy density and portion size on energy intake in women. Am J Clin Nutr 2004;79:962-8.
16. Steyn NP, Senekal M, Norris SA, Whati L, Mackeown JM, Nel JH. How well do adolescents determine portion sizes of foods and beverages? Asia Pac J Clin Nutr 2006;15:35-42.
17. Korean Diabetes Association. Staged diabetes management.
3rd ed. Seoul: Korean Diabetes Association; 2007. p3-9.
18. Cho JW. The present status of diabetes education and opinion research of food exchange list. Korean Diabetes J 2008;32(Sup- pl 2):S109-14.
19. Ahn HJ, Han KA, Kwon HR, Koo BK, Kim HJ, Park KS, Min KW. Small rice bowl-based meal plan versus food exchange- based meal plan for weight, glucose and lipid control in obese type 2 diabetic patients. Korean Diabetes J 2010;34:86-94.
20. Wilson C, Brown T, Acton K, Gilliland S. Effects of clinical nu- trition education and educator discipline on glycemic control outcomes in the Indian health service. Diabetes Care 2003;26:
2500-4.
21. Kim SH, Kang ES, Park SY, Lee SJ, Kim MJ, Yoo JS, Ahn CW, Cha BS, Lim SK, Lee HC. The effects of lifestyle modification on the metabolic parameters of type 2 diabetes. J Korean Dia- betes Assoc 2004;28:441-51.
22. Khan MA, St Peter JV, Breen GA, Hartley GG, Vessey JT. Dia- betes disease stage predicts weight loss outcomes with long-term appetite suppressants. Obes Res 2000;8:43-8.