Evaluation of the Immune-Stimulating Activity of Samul-tang, a Traditional Korean Herbal Medicine,
Standardized by HPLC-PDA
Chang-Seob Seo
1, Hyekyung Ha
1, Da-Young Jung
1, Ho Young Lee
1,2, Hyeun-Kyoo Shin
11Herbal Medicine EBM Research Center, Korea Institute of Oriental Medicine, Yuseongdae-ro 1672, Yuseong-gu, Daejeon, 305-811, Korea
2Hongcheon Institute of Medicinal Herb, Yeonbong-ri 101, Hongcheon-eup, Gangwon-do, 250-930, Korea Original Article
⋅Received:16 March 2011 ⋅Revised:3 May 2011 ⋅Accepted:4 May 2011
⋅Correspondence to:Hyeun-Kyoo Shin
Herbal Medicine EBM Research Center, Korea Institute of Oriental Medicine, 1672 Yuseongdae-ro, Yuseong-gu, Daejeon 305-811, Korea
Tel:+82-42-868-9464, Fax:+82-42-864-2120, Email:[email protected]
Objectives: We performed simultaneous determination of five constituents by HPLC in Samul-tang (SMT). Additionally, we investigated the immune-stimulatory potential of SMT on specific cellular and humoral immune responses in ovalbumin (OVA)-immunized mice.
Methods: Reverse-phase chromatography using a Gemini C18 column operating at 40°C, and photodiode array (PDA) detection at 190-400 nm, were used for quantification of the five components of SMT. Mobile phase using a gradient flow consisted of two solvent systems. Solvent A was 1.0% (v/v) aqueous acetic acid and solvent B was acetonitrile with 1.0% (v/v) acetic acid. C57BL/6 mice were immunized intraperitoneally with OVA/alum (100 μg/200 μg) on days 1, 8, and 15. The extract of SMT (1000 mg/kg) was given to mice orally for 21 days (from day 1 to day 21).
At day 22, OVA-, lipopolysaccharide (LPS)- and concanavalin A (Con A)-stimulated splenocyte proliferation and OVA-specific and total antibodies were measured in plasma.
Results: Calibration curves were acquired with r2>0.9999, and the relative standard deviation (RSD, %) for intra- and inter-day precision were both less than 3.5%. The recovery was in the range of 95.69-115.12%, with an RSD less than 6.0%. The contents of five components in SMT were 1.08-15.30 mg/g. SMT significantly enhanced Con A-induced splenocyte proliferation in OVA-immunized mice (p<0.01). Also, SMT significantly enhanced OVA- specific IgG, IgG1 and total IgM levels in plasma compared with the OVA-immunized group.
Conclusions: The established method will be applied for the quantification of major components and immune- stimulating activity in OVA-immunized mouse model of SMT.
Key Words : Herbal medicine, HPLC-PDA, Samul-tang , simultaneous determination, immune-stimulating activity
Introduction
Many herbal formulae have been used to prevent and treat of various diseases. Such herbal medicines have few side effects and exhibit multiple activities
1-5).
Samul-tang (SMT, Si-Wu-tang in Chinese, Shimotsu-to
in Japanese) is a traditional herbal medicine that
contains four herbs: Angelica gigas (Angelicae Gigantis
Radix), Cnidium officinale (Cnidii Rhizoma), Paeonia
lactiflora (Paeoniae Radix), and Rehmannia glutinosa(Rehmanniae Radix Preparata). SMT has been
widely used for treatment of ischemic, heart, and
brain diseases, chronic inflammation, and pain
relief
6-9). It has been reported to show anti-pruritic
10),
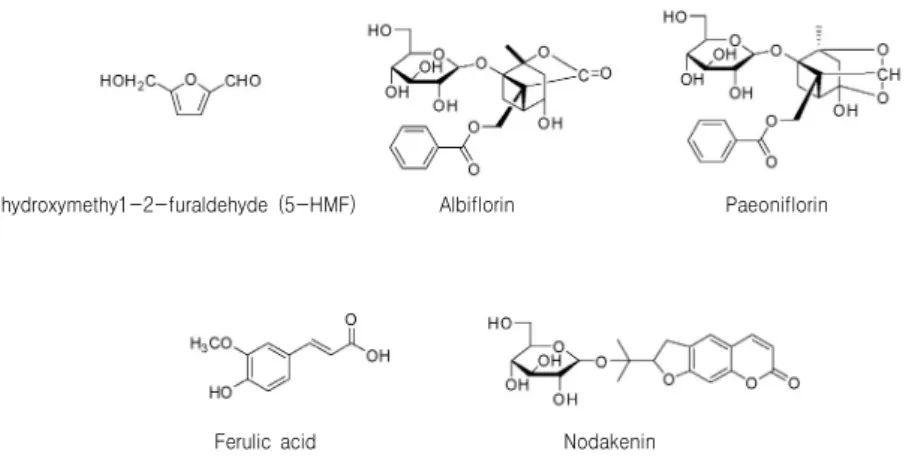
5-hydroxymethy1-2-furaldehyde (5-HMF) Albiflorin Paeoniflorin
Nodakenin Ferulic acid
Fig. 1. The chemical structures of five components of Samul-tang.
anti-inflammatory
10), and anti-cancer
11,12)properties.
However, study on the constituents of SMT is still limited. Therefore, we simultaneously measured major components, for quality control and to evaluate immune-stimulating activity. According to a recent study
3,9), the main constituents of SMT were phenolic compounds, phthalides, alkaloids, terpene glycosides, and iridoid glycosides.
High-performance liquid chromatography (HPLC) coupled with photodiode array (PDA) detection is a convenient, widely used, and powerful approach for the rapid separation and identification of multiple components in herbal extracts and plants important in traditional Chinese medicine
3,13).
In the present study, we focused on quantitative determination of five components of SMT, and used HPLC-PDA. The components were 5-hydroxymethyl- 2-furaldehyde (5-HMF), albiflorin, paeoniflorin, ferulic acid, and nodakenin (Fig. 1). Further, we investigated the immune-stimulatory potential of SMT on specific cellular and humoral immune responses in ovalbumin (OVA)-immunized mice.
Materials and Methods
1. Chromatographic system
A Shimadzu LC-20A HPLC system (Shimadzu
Co., Kyoto, Japan), consisting of a solvent delivery unit, an on-line degasser, a column oven, an autosampler, and a PDA detector, was employed.
The data processor used LCsolution software (Version 1.24). A Gemini C
18analytical column (250×4.6 mm; particle size 5 μm; Phenomenex, Torrance, CA, USA) was used. The mobile phases were solvent A (1.0% v/v aqueous acetic acid) and solvent B (acetonitrile with 1.0% v/v acetic acid).
The gradient flow was as follows: (A)/(B)=95/5 (0 min) → (A)/(B)=40/60 (40 min) → (A)/(B)= 0/100 (45 min; hold for 5 min) → (A)/(B)= 95/5 (55 min;
hold for 15 min). Column temperature was maintained at 40°C. Analysis was performed at a flow-rate of 1.0 mL/min with detection wavelengths of 230 nm (for albiflorin and paeoniflorin), 280 nm (for 5-HMF), 320 nm (for ferulic acid), and 330 nm (for nodakenin). Injection volume was 10 μL.
2. Reagents and materials
Ferulic acid and 5-HMF were purchased from Sigma-Aldrich (St Louis, MO, USA). Albiflorin and paeoniflorin were the products of Wako (Osaka, Japan). Nodakenin was purchased from NPC BioTechnology Inc. (Daejeon, Korea). The purity of all reference standards was more than 98.0%.
HPLC-grade methanol, acetonitrile, and water were
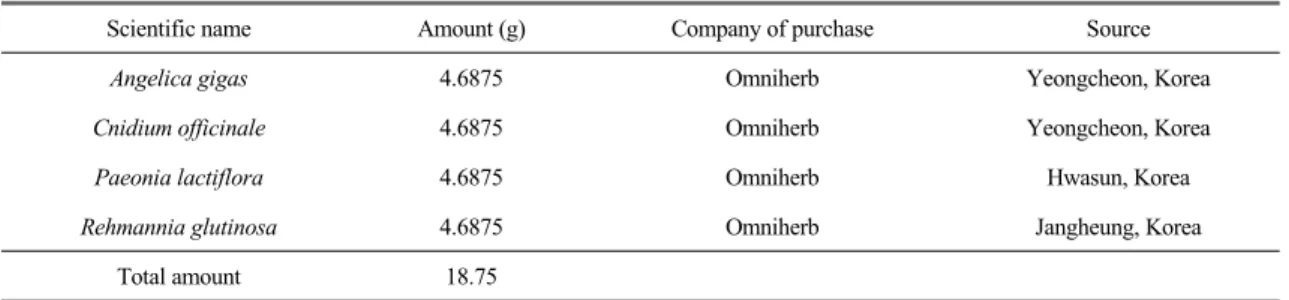
Scientific name Amount (g) Company of purchase Source
Angelica gigas 4.6875 Omniherb Yeongcheon, Korea
Cnidium officinale 4.6875 Omniherb Yeongcheon, Korea
Paeonia lactiflora 4.6875 Omniherb Hwasun, Korea
Rehmannia glutinosa 4.6875 Omniherb Jangheung, Korea
Total amount 18.75
Table 1. Crude Components of Samul-tang.
obtained from J.T. Baker (Phillipsburg, NJ, USA).
Glacial acetic acid was of analytical reagent grade, procured from Junsei (Tokyo, Japan). Dulbecco’s modified Eagle’s medium (DMEM), PBS, penicillin- streptomycin (P&S), and fetal bovine serum (FBS) were purchased from Gibco/BRL (Gaithersburg, MD, USA). Hank’s balanced salt solution (HBSS, pH 7.4), dimethyl sulfoxide (DMSO), concanavalin A (Con A), lipopolysaccharide (LPS), RBC lysing buffer, and aluminum hydroxide gel were obtained from Sigma Chemical Co. (St. Louis, MO, USA).
Ovalbumin (OVA) was purchased from Thermo Scientific (Waltham, MA, USA) and immunoglobulin G (IgG), immunoglobulin G1 (IgG1), and immunoglobulin M (IgM) detection ELISA kits were purchased from Bethyl Laboratories (Montgomery, TX, USA). All other chemicals and solvents were of analytical grade. The materials forming SMT were purchased from Omniherb (Yeongcheon, Korea). A voucher specimen (2008-KE25-1 ~ KE25-4) has been deposited at the Herbal Medicine EBM Research Center, Korea Institute of Oriental Medicine.
3. Preparation of standard solutions and calibration curves
Standard stock solutions of 5-HMF, albiflorin, paeoniflorin, ferulic acid, and nodakenin (all at 1,000 μ g/ml) were prepared in methanol and stored below 4°C. Working standard solutions were prepared by serial dilution of stock solutions with methanol. All calibration curves were obtained by assessment of
peak areas from standard solutions in the concen- tration ranges: 5-HMF, 0.78-100.00 μg/mL; albiflorin, 0.78-100.00 μg/mL; paeoniflorin, 3.91-500.00 μg/mL;
ferulic acid, 0.78-100.00 μg/mL; and nodakenin, 1.56-200.00 μg/mL.
4. Preparation of sample solutions
A decoction of SMT was prepared in our laboratory (Table 1) from a mixture of chopped crude herbs, extracted in distilled water at 100°C for 2 h. The solution was evaporated to dryness and freeze-dried (yield: 33.3%). Lyophilized PMT extract (200 mg) was dissolved in distilled water (20 ml) and mixed in a vortex mixer. The solution was filtered through a SmartPor GHP syringe filter (0.2 μm pore size, Woongki Science, Seoul, Korea).
5. Limits of detection (LOD) and quantification (LOQ)
Stock solutions of reference compounds were diluted with methanol to assess LOD and LOQ values. The LOD and LOQ data obtained under the chromatographic conditions used in the present study were determined using signal-to-noise (S/N) ratios of 3 and 10, respectively.
6. Precision and accuracy
Repeatability was assessed by analysis of five
independently prepared standard solutions. The
relative standard deviation (RSD) of analyte peak
areas, and peak retention times for each standard, were calculated.
Intra- and inter-day precision values were determined using a standard addition method to prepare spiked samples, employing both standards and controls.
Recovery tests were performed by adding known amounts of reference standards to PMT samples before extraction. An average recovery was calculated using the formula: Recovery (%) = (Amount
determined— Amount
original) / Amount
spiked× 100.
7. Animals and immunization
Six-week-old male C57BL/6 mice were purchased from Orient Bio and kept under standard conditions in the Experimental Animal Center of the Korea Institute of Oriental Medicine (KIOM, Daejeon, Korea). Mice were divided into five groups, each containing 10 mice. Mice were injected intraperitoneally with OVA/alum (100/200 μg) at weekly intervals (day 1, 8, and 15). Saline-treated animals were included as normal controls. BK was given orally, at doses of 100, 300 and 1000 mg/kg/day in distilled water, from day 1 to day 21 and vehicle was distilled water. Spleen and plasma were collected at day 22 for splenocyte proliferation assay and measurement of antibodies in plasma. To assess the adjuvant activity of BK, mice were immunized three times at weekly intervals with OVA/Alum and given BK orally.
8. Mitogen- and OVA-stimulated splenocyte proliferation in OVA-immunized mice Splenocytes from OVA-immunized C57BL/6 mice (5×10
5cell/mL) were seeded into wells of 96-well plates. To each well was added, OVA, LPS, or Con A yielding a final volume of 100 μL, and plates were incubated at 37°C for 48 hr. Cells were incubated with CCK-8 and the absorbance at 450 nm was measured. The mitogen effect was calculated
based on the following formula: (%) = 100×Abs
Extract/ Abs
Control9. Measurement of OVA-specific and total antibody levels in plasma
OVA-specific IgG, IgG1 and total IgM levels in plasma were measured by ELISA method. Briefly, each well of a 96-well plate (Nunc, Thermo Fisher Scientific, Roskile, Denmark) was coated by incubation with 100 μL of IgM, IgG, and IgG1-capture antibody or 100 μL of OVA solution (100 μg/mL in 50 mM carbonate-bicarbonate buffer, pH 9.6) overnight at 4°C. Wells were washed three times with PBS containing 0.05% (v/v) Tween 20 (wash buffer), and blocked with 1% (w/v) BSA/PBS at room temperature for 30 min. After three times washing, 100 μL of diluted plasma samples were added, and the plates were incubated for 1 hr at 37°C and washed five times. 100 μL HRP conjugate (1:10,000 in 1% [w/v] BSA/PBS) were added, and plates were incubated for 1 hr at 37°C and washed five times.
100 μL of substrate solution were added and incubated for 30 min at room temperature. Enzyme reactions were terminated by addition of 100 μL of 2 N H
2SO
4, and the absorbance of each supernatant at 450 nm was measured in an ELISA reader, with a 570 nm reference channel.
10. Statistical analysis
The results were represented as means ± SEM and deemed statistically significant at p<0.05, based on ANOVA or Bonferroni multiple comparison analysis using the Systat
®10.0 software (SYSTAT Inc., Evanston, Ill, USA).
Results
1. Optimization of chromatographic conditions
We obtained satisfactory separation using mobile
phases consisting of (A) 1.0% (v/v) aqueous acetic
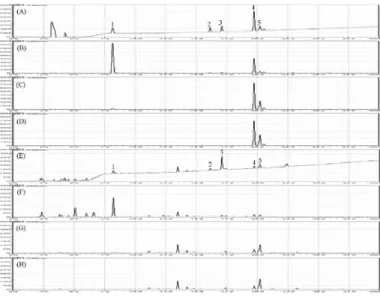
Fig. 2. HPLC chromatographs of a standard mixture (A-D) of five components, with detection at 230 nm (A), 280 nm (B), 320 nm (C), and 330 nm (D). The Samul-tang sample (E-H) was subjected to detection at 230 nm (E), 280 nm (F), 320 nm (G), and 330 nm (H). The peaks represent 5-HMF (1), albiflorin (2), paeoniflorin (3), ferulic acid (4), and nodakenin (5).
acid and (B) acetonitrile with 1.0% (v/v) acetic acid, with a gradient flow of (A)/(B)=95/5 (0 min) → (A)/(B)=40/60 (40 min) → (A)/(B)=0/100 (45 min;
hold for 5 min) → (A)/(B)=95/5 (55 min; hold 15 min). Quantitation was achieved by PDA detection in the region 190-400 nm, based on peak area. The selectivity of the HPLC program is illustrated in Figure 2, where good separation of marker constituents from other components of the extract may be noted. Using optimized chromatography conditions, all analytes eluted before 30 min, showed a resolution better than 1.52, and afforded good specificity upon sample analysis. Representative HPLC chromatograms of standards and the extract are shown in Figure 2.
2. Recovery
A recovery test was performed by addition of known amounts of 5-HMF, albiflorin, paeoniflorin, ferulic acid, and nodakenin, to the extract. Standard compounds, at each of two different levels, were
mixed with sample powder, and extracted. The recovery of each standard ranged from 95.69- 115.12%, and the RSD range was 0.31-5.62% (Table 2).
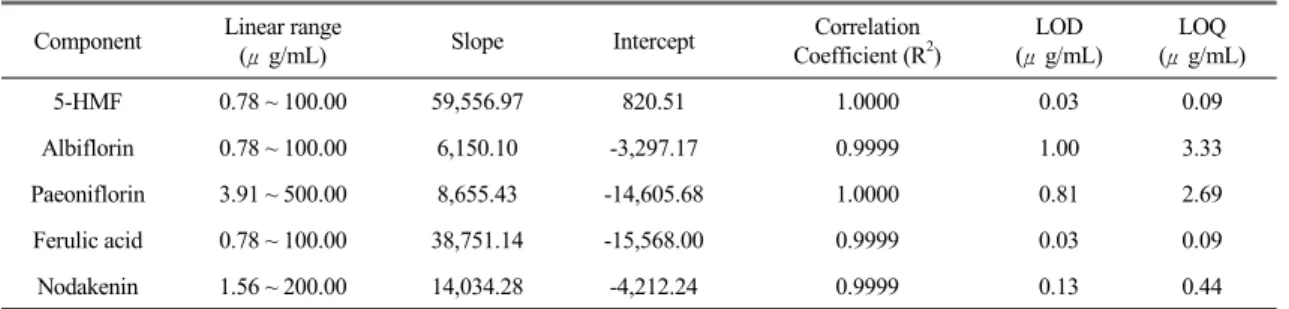
3. Linearity, range, LOD, and LOQ
Calibration curves were obtained using standard solutions containing 0.78-100.00 μg/mL of 5-HMF, albiflorin, and ferulic acid; 3.91-500.00 μg/mL of paeoniflorin; and 1.56-200.00 μg/mL of nodakenin, as marker components. Line equations representing calibration curves, and the correlation coefficients thereof, are summarized in Table 3.
The range in LODs and LOQs was 0.03-1.00 μ g/mL and 0.09-3.33 μg/mL, respectively. These data are shown in Table 3.
4. Accuracy and precision
Repeatability or intra-assay precision was assessed
by repeatedly measuring retention times and peak
areas for three independently prepared samples of
Component Original mean level (μg/mL)
Spiked level (μg/mL)
Detected mean level (μg/mL)
Recovery mean
(%) RSD (%)
5-HMF 27.84 6.00 34.65 108.82 1.08
15.00 45.39 115.12 0.31
Albiflorin 28.85 6.00 34.71 97.54 2.20
15.00 43.98 100.86 1.22
Paeoniflorin 155.51 30.00 186.30 102.62 0.37
75.00 231.06 100.73 0.76
Ferulic acid 11.81 2.00 13.73 95.69 0.87
5.00 17.51 113.86 5.62
Nodakenin 60.93 12.00 72.86 99.39 3.54
30.00 91.99 103.53 0.72
Table 2. Recovery Levels of the Five Components (n=3).
Component Linear range
(μg/mL) Slope Intercept Correlation
Coefficient (R2)
LOD (μg/mL)
LOQ (μg/mL)
5-HMF 0.78 ~ 100.00 59,556.97 820.51 1.0000 0.03 0.09
Albiflorin 0.78 ~ 100.00 6,150.10 -3,297.17 0.9999 1.00 3.33
Paeoniflorin 3.91 ~ 500.00 8,655.43 -14,605.68 1.0000 0.81 2.69
Ferulic acid 0.78 ~ 100.00 38,751.14 -15,568.00 0.9999 0.03 0.09
Nodakenin 1.56 ~ 200.00 14,034.28 -4,212.24 0.9999 0.13 0.44
Table 3. Linearities, Correlation Coefficients, LODs, and LOQs for Components (n=3).
analyte. Reproducibility for all analytes was less than RSD 1.0% for peak responses and less than RSD 0.1% for retention times (data not shown). Thus, the HPLC assay showed good repeatability under optimized conditions.
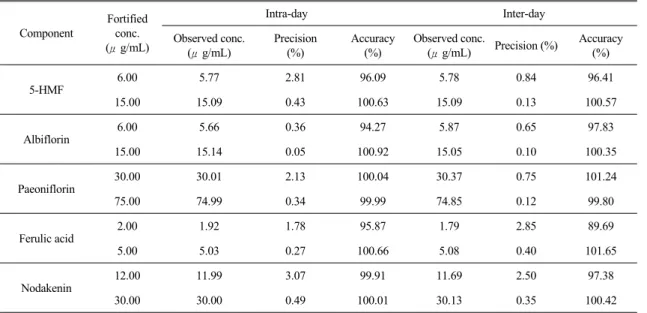
To test the accuracy and precision of our analytical method, intra- and inter-day variations in measurement of five marker components were determined, and are summarized in Table 4. The precision of the method in simultaneous determin- ation of the five constituents was acceptable because the RSD did not exceed 3.5% at any analyte concentration tested. The intra-day accuracy ranged from 94.27-100.92%, and inter-day accuracy was 89.69-101.65%.
5. Determination of the main constituents of SMT
Our assay was subsequently applied to the simultaneous determination of five components, 5-HMF, albiflorin, paeoniflorin, ferulic acid, and nodakenin, in SMT. Figure 2 shows chromatograms of reference components and a water extract of SMT, with detection of eluents at 230 nm, 280 nm, 320 nm, and 330 nm. The analytical results for each component identified are summarized in Table 5.
6. Effect of SMT on mitogen- and
OVA-stimulated splenocyte proliferation in OVA-immunized mice
OVA/Al significantly enhanced splenocyte proli-
Component
Fortified conc.
(μg/mL)
Intra-day Inter-day
Observed conc.
(μg/mL)
Precision (%)
Accuracy (%)
Observed conc.
(μg/mL) Precision (%) Accuracy (%)
5-HMF 6.00 5.77 2.81 96.09 5.78 0.84 96.41
15.00 15.09 0.43 100.63 15.09 0.13 100.57
Albiflorin 6.00 5.66 0.36 94.27 5.87 0.65 97.83
15.00 15.14 0.05 100.92 15.05 0.10 100.35
Paeoniflorin 30.00 30.01 2.13 100.04 30.37 0.75 101.24
75.00 74.99 0.34 99.99 74.85 0.12 99.80
Ferulic acid 2.00 1.92 1.78 95.87 1.79 2.85 89.69
5.00 5.03 0.27 100.66 5.08 0.40 101.65
Nodakenin 12.00 11.99 3.07 99.91 11.69 2.50 97.38
30.00 30.00 0.49 100.01 30.13 0.35 100.42
Table 4. The Precision and Accuracy of Analytical Results (n=3).
Batch (#)
Content (mg/g)
5-HMF Albiflorin Paeoniflorin Ferulic acid Nodakenin
Mean ± SD RSD (%) Mean ± SD RSD (%) Mean ± SD RSD (%) Mean ± SD RSD (%) Mean ± SD RSD (%) 1 2.79±0.04 1.33 2.91±0.06 2.03 15.18±0.12 0.81 1.08±0.02 1.50 5.99±0.10 1.74 2 2.81±0.01 0.32 2.91±0.06 1.91 15.22±0.01 0.05 1.14±0.04 3.84 6.01±0.13 2.11 3 2.82±0.01 0.19 2.89±0.03 1.11 15.30±0.04 0.29 1.11±0.02 2.18 6.07±0.13 2.11 Table 5. The Contents of Five Components in Samul-tang (n=3).
feration (p<0.01) induced by OVA, the B cell mitogen LPS and the T cell mitogen Con A, compared with the control group (Fig. 3). SMT significantly enhanced splenocyte proliferation (p<0.01) induced by the T cell mitogen Con A, compared with OVA/Al group (Fig. 3).
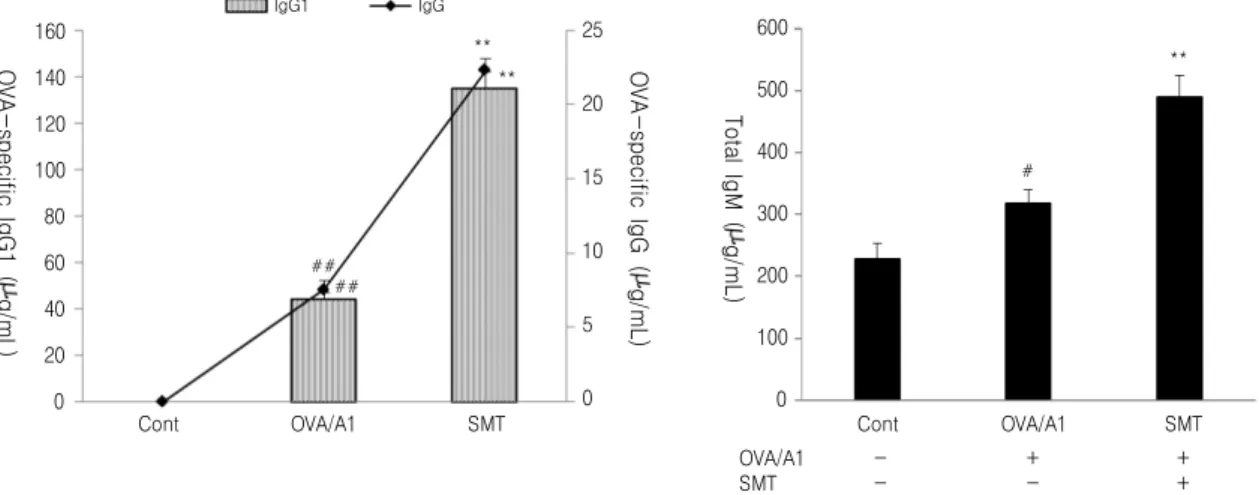
7. Effect of SMT on IgM, IgG, and OVA-specific antibody levels in plasma The levels of OVA-specific IgG, IgG1 (p<0.01) and total IgM (p<0.05) were enhanced by OVA/alum compared with the control group. SMT enhanced the plasma levels of these antibodies over that observed in OVA immunized mice (p<0.01, Fig. 4).
Discussion
We performed an analytical method for simultaneous determination of five components by HPLC-PDA and evaluated immune-stimulating activity in SMT.
Cell mediated immunity, mediated T lymphocytes, is important in combating intracellular infections.
Helper T cells induce B lymphocytes to secrete
antibodies, whereas cytotoxic T lymphocytes assist
phagocytes to destroy ingested microbes and kill
intracellular microbes. Humoral immunity, mediated
antibodies produced by B lymphocytes, functions by
neutralizing and eliminating extracellular microbes
and microbial toxins
14). The OVA is commonly used
**
####
##
400 350 300 250 200 150 100 50 0
Splenocyte proliferation (% of control)
OVA 10 μg/mL LPS 2 μg/mL ConA 4 μg/mL
Cont OVA/A1 SMT
OVA/A1 - + +
SMT - - +
Fig. 3. Effect of Samul-tang (SMT) on OVA-, LPS- and Con A-stimulated splenocyte proliferation ex vivo. C57BL/6 mice were immunized once on the intraperitoneal injection with OVA/Al (100/200 μg) at weekly intervals and oral administration with SMT of 1000 mg/kg/day. Splenocytes were prepared 1 weeks after the last immunization and cultured with OVA (10 μg/mL), LPS (2 μg/mL) and Con A (4 μg/mL) for 48 hr. Splenocyte proliferation was measured by the CCK-8 method as described in the text, and shown as % of control. The values are presented as mean ± SEM (n=6). Differences between control and OVA/Al groups were evaluated in each group (##p<.001).
Significant differences with OVA/Alum groups were designated as **p<0.01.
160 140 120 100 80 60 40 20 0
OVA-specific IgG1 (g/mL)
**
**
##
##
IgG1 IgG
25
20
15
10
5
0
OVA-specific IgG (g/mL)
Cont OVA/A1 SMT
600
500
400
300
200
100
0
Total IgM (g/mL)
**
#
Cont OVA/A1 SMT
OVA/A1 - + +
SMT - - +
Fig. 4. Effects of Samul-tang (SMT) on OVA-specific IgG, IgG1 and total IgMlevels in plasma. OVA-specific IgG, IgG1 and total IgM levels in plasma were assayed by ELISA. Each value represents a mean ± SEM (n=5). Differences between control and OVA/Al groups were evaluated in each group (#p<0.05 and ##p<.001). Significant differences with OVA/alum groups were designated as **p<0.01.