Cataract and Cataract Surgery: Nationwide Prevalence and Clinical Determinants
This study aimed to investigate the prevalence and clinical determinants of cataract and cataract surgery in Korean population. The 2008-2012 Korean National Health and Nutrition Examination Survey was analyzed, which included 20,419 participants aged
≥ 40 years. The survey is a multistage, probability-cluster survey, which can produce nationally representative estimates. Prevalence of cataract and cataract surgery was estimated. Clinical determinants for those were investigated using logistic regression analyses (LRAs). The prevalence of cataract was 42.28% (95% confidence interval [CI], 40.67-43.89); 40.82% (95% CI, 38.97-42.66) for men and 43.62% (95% CI, 41.91- 45.33) for women (P = 0.606). The prevalence of cataract surgery was 7.75% (95% CI, 7.30-8.20); 6.38% (95% CI, 5.80-6.96) for men and 9.01% (95% CI, 8.41-9.61) for women (P < 0.001). Cataract was associated with older age (P < 0.001), men (P = 0.032), lower household income (P = 0.031), lower education (P < 0.001), hypertension
(P < 0.001), and diabetes mellitus (DM) (P < 0.001). Cataract surgery was consistently associated with older age, occupation, DM, asthma, and anemia in two LRAs, which compared participants with cataract surgery to those without cataract surgery and those having a cataract but without any cataract surgery, respectively. Hypertension, arthritis, and dyslipidemia were associated with cataract surgery at least in one of these LRAs. These results suggest that there are 9.4 million individuals with cataract and 1.7 million individuals with cataract surgery in Korea. Further studies are warranted to reveal the causality and its possible mechanism of developing/exacerbating cataract in novel determinants (i.e., anemia, asthma, and arthritic conditions) as well as well-known determinants.
Keywords: Cataract; Cataract Surgery; Prevalence; Determinants; Risk Factors
Sang Jun Park,1,2* Ju Hyun Lee,3*Se Woong Kang,4 Joon Young Hyon,1 and Kyu Hyung Park1
1Department of Ophthalmology, Seoul National University College of Medicine, Seoul National University Bundang Hospital, Seongnam, Korea;
2Department of Preventive Medicine, Seoul National University College of Medicine, Seoul, Korea;
3Medical Research Collaborating Center, Seoul National University Bundang Hospital, Seongnam, Korea; 4Department of Ophthalmology, Samsung Medical Center, Sungkyunkwan University School of Medicine, Seoul, Korea
* Sang Jun Park and Ju Hyun Lee contributed equally to this work.
Received: 22 December 2015 Accepted: 21 March 2016 Address for Correspondence:
Kyu Hyung Park, MD
Department of Ophthalmology, Seoul National University College of Medicine, Seoul National University Bundang Hospital, 82 Gumi-ro 173-beon-gil, Bundang-gu, Seongnam 13620, Korea
E-mail: [email protected]
Funding: This study was supported by the grant funded by the Seoul National University Bundang Hospital (SNUBH) Research Fund (grant No: 14-2015-007).
http://dx.doi.org/10.3346/jkms.2016.31.6.963 • J Korean Med Sci 2016; 31: 963-971
INTRODUCTION
Cataract is the leading cause of blindness in the world, account- ing for half of blindness and affecting about 20 million people (1). Although cataract surgery is an effective method for restor- ing vision, individuals in developing countries have limited ac- cess to cataract surgery services. In addition, cataract is also one of the major socioeconomic and public health burdens, even in developed countries. This is because the volume of cataract sur- gery has increased due to an aging population and an increase in cataract surgery services (2). Hence, estimating the prevalence and clinical determinants of both cataract and cataract surgery is important for establishing a public health plan, identifying modifiable determinants, and minimizing the public health burden. Furthermore, investigating estimates of both cataract and cataract surgery simultaneously may provide clues for their association and unmet needs for health care. However, despite the socioeconomic and public health burden of cataract and cataract surgery, epidemiologic studies representing a nation-
wide population have been scarce.
Korea is one of the newly developed countries in Asia and one of the most populous countries in the world. As the issue of an aging population has been on the rise in Korea, as well as in other developed countries, several nationwide, government- led surveys have been conducted. The Korea National Health and Nutrition Examination Survey (KNHANES) is one of these national surveys; it was initiated in 1998 and publishes nation- ally representative estimates for approximately 50 million Kore- ans (3,4). Accompanying the 2008-2012 KNHANES, the Korean Ophthalmologic Society (KOS) conducted the 5-year Korean Ophthalmic Survey. The results of the 2008-2012 KNHANES and completed Korean Ophthalmic Survey were recently re- leased. Hence, this study estimated the prevalence of, and in- vestigated clinical determinants for, cataract and cataract sur- gery in Koreans using the large-scale, nationally representative 2008-2012 KNHANES database and the Korean Ophthalmic Survey.
Ophthalmology
MATERIALS AND METHODS
Study design and populationThis study analyzed the 5-year (2008-2012) KNHANES data, which included the completed five-year plan ophthalmic sur- vey designed by the KOS. The KNHANES is an ongoing, popu- lation-based, cross-sectional survey in Korea conducted by the Korea Centers for Disease Control and Prevention, and the Ko- rean Ministry of Health and Welfare (3-6). The 2008-2012 KNH- ANES annually selected 3,840-4,600 households in 192-200 enu- meration districts representing the civilian, non-institutional- ized Korean population using rolling sampling designs and in- volving a complex, stratified, multistage, probability-cluster survey. A total of 45,810 subjects participated in the 2008-2012 KNHANES; the response rate in each year was 77.8%, 82.8%, 81.9%, 80.4%, and 80.0% in 2008, 2009, 2010, 2011, and 2012, re- spectively. The KNHANES database is a publicly available data- base in the KNHANES homepage (https://knhanes.cdc.go.kr/, accessed on 29 December 2014), and the KNHANES introduced the database detail regarding the characteristics and the way for data resource use (3).
Data collection and inclusion criteria
The KNHANES consisted of three components, which were the Health Interview Survey, Health Examination Survey, and Nu- trition Survey (3-6). We used data from the first two surveys, in- cluding medical histories, socioeconomic status, anthropomet- ric measurements, blood tests, and ophthalmic surveys (4-7).
The data from a structured slit-lamp examination (BQ-900; Haag- Streit AG, Koeniz, Switzerland) determined the crystalline lens/
cataract status as phakia without any cataract, phakia with cata- ract (i.e., nuclear, cortical, anterior subcapsular, posterior sub- capsular, or mixed cataract using the Lens Opacities Classifica- tion System [LOCS] III (8) as the grading system) pseudophakia and aphakia. The quality of the ophthalmic survey was verified by the Epidemiologic Survey Committee of the KOS (4-7). Par- ticipants aged ≥ 40 years with slit-lamp examination of at least one eye were included in the study.
Definition of variables
The prevalence of, and determinants for, two dependent vari- ables were separately investigated as follows: 1) the presence of cataract and 2) the evidence of cataract surgery. The presence of cataract was defined as the existence of any cataract, pseudo- phakia or aphakia, in at least one eye in a participant. The evi- dence of cataract surgery was defined as the existence of pseu- dophakia or aphakia in at least one eye in a participant. Inde- pendent variables were defined and categorized as follows. For each variable below, the first category in each list was selected as the reference point for logistic regression analysis (LRA). Par- ticipants were divided into four age groups, which were 40-49,
50-59, 60-69, and ≥ 70 years. Smoking status was defined as never-smoker, ex-smoker, and current smoker. Household in- come status was divided into participants with > 50% house- hold income and those with ≤ 50% household income accord- ing to the equivalized annual gross household income. Educa- tion status was divided into participants with at least a high sch- ool degree and those who had graduated from middle school or less. Occupation was categorized as blue collar (agriculture, forestry, fishery workers, craft and related trade workers, plant and machine operators and assemblers, and simple labor), white collar (managers, professionals, clerks, and service/sales work- ers), and inoccupation (unemployed, retired, students, and house- wives). Residence was categorized into urban and rural areas based on participants’ addresses. Sun-exposure status was di- vided into participants with an average of < 5 hours/day and those with ≥ 5 hours/day. Co-morbidities were categorized into participants without a history of co-morbidities and those with a history of co-morbidities. Co-morbidities used in LRAs were as follows: hypertension, diabetes mellitus (DM), dyslip- idemia, stroke, myocardial infarction (MI) or ischemic heart disease (IHD), osteoarthritis (OA) or rheumatoid arthritis (RA), pulmonary tuberculosis, and asthma. Participants were catego- rized into two groups by body mass index (BMI), the ratio of weight (kg) to height
2(m
2): those with BMI < 25 kg/m
2and those with BMI ≥ 25 kg/m
2. Waist circumference (WC) was measured to the nearest 0.1 cm at the narrowest point between the lower borders of the rib cage and iliac crest after normal expiration.
Participants were divided into those with WC < 90 cm in men or WC < 80 cm in women and those with WC ≥ 90 cm in men or ≥ 80 cm in women. Hemoglobin was measured with an XE- 2100D (Sysmex, Kobe, Japan), and participants with a hemo- globin level < 13 g/dL in men or < 12 g/dL in women were des- ignated anemic.
Statistical analysis
The data were analyzed with SAS, version 9.2 (SAS Institute INC., Cary, NC, USA) using PROC SURVEY procedures. We used the KNHANES sample weight adjusted for oversampling, non-re- sponse, and the Korean Population in 2008-2012 (3,4). The stan- dard errors of estimates were calculated. Characteristics of par- ticipants included and excluded from the study were compared.
The prevalence of cataract and cataract surgery, including
age group- and sex-specific prevalence, was estimated. Differ-
ences in the prevalence between sexes were estimated by the χ
2test. Simple LRAs were conducted to investigate associations
between cataract and a set of independent variables. Age-group-,
sex-, and smoking-status-adjusted (ASS-adjusted) LRAs were
subsequently performed. Covariates with a P value < 0.100 in
each ASS-adjusted LRA were chosen for the multiple LRA. Age
group, sex, and smoking status were always included in the
multiple LRA, regardless of P values. The same set of analyses
was also conducted for cataract surgery by estimating preva- lence and determinants compared to 1) participants without any cataract surgery and 2) participants having a cataract in at least one eye but without any cataract surgery. Odds ratio (OR) and 95% confidence interval (CI) values were calculated for all LRAs. P values < 0.05 were considered statistically significant.
Ethics statement
The present study protocol was reviewed and approved by the institutional review board of the Seoul National University Bun- dang Hospital (IRB No. X-1211/177-903). Informed consent was waived by the board.
RESULTS
A total of 20,419 eligible subjects aged ≥ 40 years (8,777 men and 11,642 women) participated in KNHANES during the study period. Of these participants, 19,953 participants had slit-lamp examination data regarding the cataract state of at least one eye. Comparisons between participants with and without the examination data are provided in Supplementary Table S1.
Prevalence of cataract and cataract surgery
The overall prevalence of cataract was 42.28% (95% CI, 40.67- 43.89); 40.82% (95% CI, 38.97-42.66) for men and 43.62% (95%
CI, 41.91-45.33) for women (P = 0.606). The overall prevalence of cataract surgery was 7.75% (95% CI, 7.30-8.20); 6.38% (95%
CI, 5.80-6.96) for men and 9.01% (95% CI, 8.41-9.61) for women (P < 0.001). Detailed sex- and age group-based prevalence can be seen in Table 1 and Fig. 1.
Clinical determinants of cataract
Results of the simple LRA are provided in Supplementary Table S2. Variables with a P value < 0.100 in ASS-adjusted LRAs were age group, household income, education, occupation, hyper- tension, DM, dyslipidemia, and OA or RA. In multiple LRA, cat-
aract were associated with older age (P < 0.001), men (P = 0.032), lower household income (P = 0.031), lower education (P < 0.001), hypertension (P < 0.001), and DM (P < 0.001). Detailed demo- graphic results for each variable, ASS-adjusted LRAs, and mul- tiple LRA are provided in Table 2.
Clinical determinants of cataract surgery
Participants with cataract surgery vs. participants without any cataract surgery
Results of simple LRA are provided in Supplementary Table S2.
Variables with a P value < 0.100 in ASS-adjusted LRAs were age group, sex, smoking status, occupation, residence, sun expo- sure, hypertension, DM, dyslipidemia, MI or IHD, OA or RA, asthma, and anemia. In multiple LRA, cataract surgery was as- sociated with older age (P < 0.001), occupation (P < 0.001), hy- pertension (P = 0.011), DM (P < 0.001), OA or RA (P = 0.044),
Fig. 1. Age- and sex-specific weighted prevalences of cataracts and cataract surgery in Korea during the 5-year study period (2008-2012).
Weighted prevalence (%)
Any cataract Cataract surgery Any cataract Cataract surgery Any cataract Cataract surgery Any cataract Cataract surgery Age groups (year)
Any cataract/Cataract surgery
40-49 50-59 60-69 ≥ 70
100 80 60 40 20 0
11.1 12.4 9.8
1.0 1.2 0.7
35.7 38.0 33.3
2.4 3.0 1.9
71.8 71.6 71.9
10.4 9.6 11.2
94.2 92.3 95.3
30.6 26.4 33.3 Total
Men Women
Table 1. Weighted prevalences and frequencies of participants with any cataract (in- cluding cataract surgery) in at least one eye and participants with cataract surgery in at least one eye in the Korean population aged ≥ 40 years during the 5-year study period (2008-2012)
Demographic parameters Participants with
cataract Participants with cataract surgery
Frequency 10,128 1,989
Prevalence (95% CI) 42.28 (40.67-43.89) 7.75 (7.30-8.20) Sex
Men, Frequency Prevalence % (95% CI) Women, Frequency Prevalence % (95% CI)
4,355 40.82 (38.97-42.66)
5,773 43.62 (41.91-45.33)
774 6.38 (5.80-6.96)
1,215 9.01 (8.41-9.61) Age groups, yr
40-49, Frequency Prevalence % (95% CI) 50-59, Frequency Prevalence % (95% CI) 60-69, Frequency Prevalence % (95% CI) ≥ 70, Frequency Prevalence % (95% CI)
578 11.11 (9.57-12.65)
1,862 35.65 (33.05-38.25)
3,507 71.77 (69.29-74.24)
4,181 94.15 (93.10-95.21)
51 0.95 (0.67-1.24)
132 2.44 (1.95-2.93)
495 10.42 (9.36-11.49)
1,311 30.63 (28.91-32.36) CI, confidence interval.
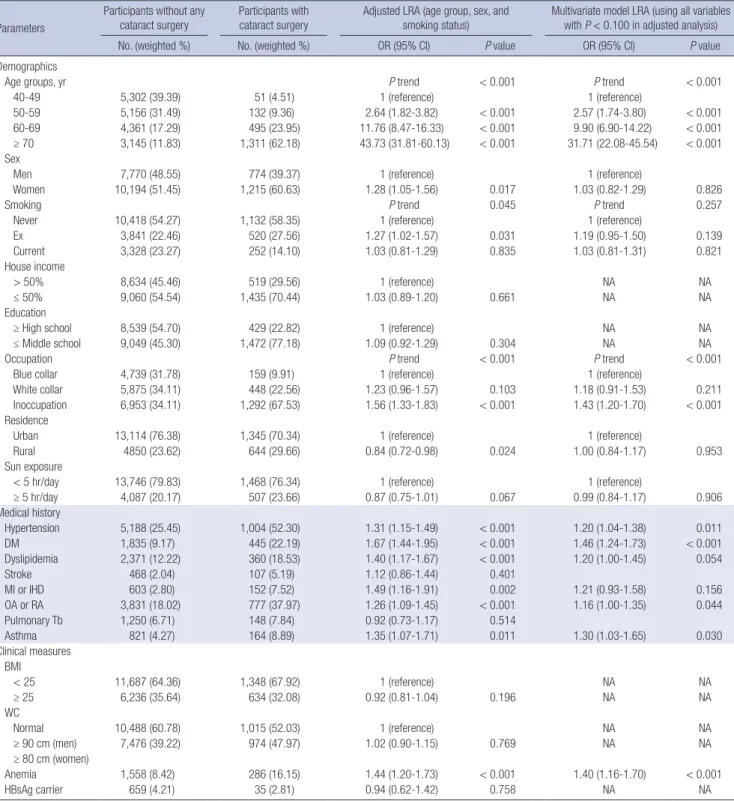
asthma (P = 0.030), and anemia (P < 0.001). Detailed demo- graphic results for each variable, ASS-adjusted LRAs, and mul- tiple LRA are provided in Table 3.
Participants with cataract surgery vs. participants with cataract but without any cataract surgery
Variables with a P value < 0.100 in ASS-adjusted LRAs were age group, sex, smoking status, occupation, residence, sun exposure,
Table 2. Comparison of characteristics of participants with cataracts (including cataract surgery) and without cataracts in at least one eye and its clinical determinants using lo- gistic regression analyses (LRAs) from the 5-year data of the KNHANES (2008-2012)Parameters
Participants without any cataract
Participants with cataract
Adjusted LRA (age group, sex, and smoking status)
Multivariate model LRA (using all variables with P < 0.100 in adjusted analysis)
No. (weighted %) No. (weighted %) OR (95% CI) P value OR (95% CI) P value
Demographics
Age groups, yr P trend < 0.001 P trend < 0.001
40-49 4,775 (56.50) 578 (9.64) 1 (reference) 1 (reference)
50-59 3,426 (33.20) 1,862 (25.11) 4.46 (3.84-5.18) < 0.001 3.76 (3.23-4.37) < 0.001
60-69 1,349 (8.71) 3,507 (30.22) 20.85 (17.44-24.94) < 0.001 14.72 (12.18-17.80) < 0.001
≥ 70 275 (1.59) 4,181 (35.03) 129.20 (101.83-163.92) < 0.001 83.37 (64.41-107.90) < 0.001
Sex
Men 4,189 (49.05) 4,355 (46.18) 1 (reference) 1 (reference)
Women 5,636 (50.95) 5,773 (53.82) 0.94 (0.82-1.08) 0.379 0.85 (0.73-0.99) 0.032
Smoking P trend 0.121 P trend 0.332
Never 5,797 (54.05) 5,753 (55.31) 1 (reference) 1 (reference)
Ex 1,919 (21.20) 2,442 (25.15) 1.03 (0.87-1.21) 0.754 1.00 (0.84-1.18) 0.966
Current 1,958 (24.76) 1,622 (19.54) 1.17 (0.99-1.37) 0.064 1.11 (0.94-1.31) 0.228
House income
> 50% 6,098 (62.62) 3,481 (38.86) 1 (reference) 1 (reference)
≤ 50% 3,593 (37.38) 6,476 (61.14) 1.23 (1.09-1.38) < 0.001 1.14 (1.01-1.28) 0.031
Education
≥ High school 6,141 (66.92) 2,827 (32.01) 1 (reference) 1 (reference)
≤ Middle school 3,527 (33.08) 6,994 (67.99) 1.31 (1.15-1.48) < 0.001 1.24 (1.10-1.40) < 0.001
Occupation P trend 0.003 P trend 0.070
Blue collar 3,113 (33.21) 3,210 (33.29) 1 (reference) 1 (reference)
White collar 3,594 (39.83) 1,304 (16.67) 0.84 (0.72-0.98) 0.027 0.91 (0.79-1.06) 0.244
Inoccupation 2,950 (26.96) 5,295 (50.04) 1.05 (0.91-1.22) 0.495 1.07 (0.92-1.24) 0.378
Residence
Urban 7,623 (79.50) 6,836 (71.02) 1 (reference) NA NA
Rural 2,202 (20.50) 3,292 (28.98) 1.08 (0.84-1.38) 0.543 NA NA
Sun exposure
< 5 hr/day 7,938 (82.67) 7,276 (75.30) 1 (reference) NA NA
≥ 5 hr/day 1,822 (17.33) 2,772 (24.70) 1.10 (0.93-1.30) 0.257 NA NA
Medical history
Hypertension 1,881 (17.51) 4,311 (41.30) 1.33 (1.20-1.48) < 0.001 1.22 (1.09-1.37) < 0.001
DM 593 (5.79) 1,687 (16.22) 1.74 (1.47-2.06) < 0.001 1.60 (1.34-1.90) < 0.001
Dyslipidemia 1,114 (10.15) 1,617 (16.23) 1.21 (1.07-1.37) 0.003 1.08 (0.94-1.23) 0.287
Stroke 134 (1.11) 441 (3.90) 1.20 (0.89-1.62) 0.224 NA NA
MI or IHD 209 (1.78) 546 (5.07) 1.23 (0.94-1.60) 0.126 NA NA
OA or RA 1,472 (12.81) 3,136 (28.84) 1.13 (1.01-1.27) 0.030 1.07 (0.96-1.20) 0.223
Pulmonary Tb 591 (5.89) 807 (8.04) 1.05 (0.87-1.28) 0.616 NA NA
Asthma 334 (3.44) 651 (6.25) 1.13 (0.90-1.41) 0.293 NA NA
Clinical measures BMI
< 25 6,406 (64.62) 6,629 (64.65) 1 (reference) NA NA
≥ 25 3,402 (35.38) 3,468 (35.35) 1.07 (0.97-1.17) 0.180 NA NA
WC
Normal 6,131 (64.22) 5,372 (54.49) 1 (reference)
≥ 90 cm (men) 3,694 (35.78) 4,756 (45.51) 1.09 (0.98-1.20) 0.106 NA NA
≥ 80 cm (women)
Anemia 831 (8.05) 1,013 (10.29) 1.05 (0.89-1.23) 0.568 NA NA
HBsAg carrier 317 (4.18) 226 (3.44) 1.02 (0.81-1.27) 0.873 NA NA
KNHANES, Korean National Health and Nutrition Examination Survey; Unadjusted, unadjusted simple logistic regression analysis; Adjusted, age groups, sex, and smoking status- adjusted logistic regression analysis; OR, odds ratio; CI, confidence interval; Never, never-smoker; Ex, ex-smoker; Current, current smoker; DM, diabetes mellitus; MI, myocar- dial infarction; IHD, ischemic heart disease; OA, osteoarthritis; RA, rheumatoid arthritis; Tb, tuberculosis; BMI, body mass index; WC, waist circumference; HBsAg, hepatitis B surface antigen; NA, not applicable.
hypertension, DM, dyslipidemia, MI or IHD, OA or RA, asthma, and anemia. In multiple LRA, cataract surgery was associated with older age (P < 0.001), occupation (P < 0.001), DM (P < 0.001), dyslipidemia (P = 0.049), asthma (P = 0.044), and anemia (P =
0.007). Detailed demographic results for each variable, ASS-ad- justed LRAs, and multiple LRA are provided in Table 4.
Table 3. Comparison of characteristics of participants with or without cataract surgery in at least one eye and its clinical determinants using logistic regression analyses (LRAs) from the 5-year data of the KNHANES (2008-2012)
Parameters
Participants without any cataract surgery
Participants with cataract surgery
Adjusted LRA (age group, sex, and smoking status)
Multivariate model LRA (using all variables with P < 0.100 in adjusted analysis)
No. (weighted %) No. (weighted %) OR (95% CI) P value OR (95% CI) P value
Demographics
Age groups, yr P trend < 0.001 P trend < 0.001
40-49 5,302 (39.39) 51 (4.51) 1 (reference) 1 (reference)
50-59 5,156 (31.49) 132 (9.36) 2.64 (1.82-3.82) < 0.001 2.57 (1.74-3.80) < 0.001
60-69 4,361 (17.29) 495 (23.95) 11.76 (8.47-16.33) < 0.001 9.90 (6.90-14.22) < 0.001
≥ 70 3,145 (11.83) 1,311 (62.18) 43.73 (31.81-60.13) < 0.001 31.71 (22.08-45.54) < 0.001
Sex
Men 7,770 (48.55) 774 (39.37) 1 (reference) 1 (reference)
Women 10,194 (51.45) 1,215 (60.63) 1.28 (1.05-1.56) 0.017 1.03 (0.82-1.29) 0.826
Smoking P trend 0.045 P trend 0.257
Never 10,418 (54.27) 1,132 (58.35) 1 (reference) 1 (reference)
Ex 3,841 (22.46) 520 (27.56) 1.27 (1.02-1.57) 0.031 1.19 (0.95-1.50) 0.139
Current 3,328 (23.27) 252 (14.10) 1.03 (0.81-1.29) 0.835 1.03 (0.81-1.31) 0.821
House income
> 50% 8,634 (45.46) 519 (29.56) 1 (reference) NA NA
≤ 50% 9,060 (54.54) 1,435 (70.44) 1.03 (0.89-1.20) 0.661 NA NA
Education
≥ High school 8,539 (54.70) 429 (22.82) 1 (reference) NA NA
≤ Middle school 9,049 (45.30) 1,472 (77.18) 1.09 (0.92-1.29) 0.304 NA NA
Occupation P trend < 0.001 P trend < 0.001
Blue collar 4,739 (31.78) 159 (9.91) 1 (reference) 1 (reference)
White collar 5,875 (34.11) 448 (22.56) 1.23 (0.96-1.57) 0.103 1.18 (0.91-1.53) 0.211
Inoccupation 6,953 (34.11) 1,292 (67.53) 1.56 (1.33-1.83) < 0.001 1.43 (1.20-1.70) < 0.001
Residence
Urban 13,114 (76.38) 1,345 (70.34) 1 (reference) 1 (reference)
Rural 4850 (23.62) 644 (29.66) 0.84 (0.72-0.98) 0.024 1.00 (0.84-1.17) 0.953
Sun exposure
< 5 hr/day 13,746 (79.83) 1,468 (76.34) 1 (reference) 1 (reference)
≥ 5 hr/day 4,087 (20.17) 507 (23.66) 0.87 (0.75-1.01) 0.067 0.99 (0.84-1.17) 0.906
Medical history
Hypertension 5,188 (25.45) 1,004 (52.30) 1.31 (1.15-1.49) < 0.001 1.20 (1.04-1.38) 0.011
DM 1,835 (9.17) 445 (22.19) 1.67 (1.44-1.95) < 0.001 1.46 (1.24-1.73) < 0.001
Dyslipidemia 2,371 (12.22) 360 (18.53) 1.40 (1.17-1.67) < 0.001 1.20 (1.00-1.45) 0.054
Stroke 468 (2.04) 107 (5.19) 1.12 (0.86-1.44) 0.401
MI or IHD 603 (2.80) 152 (7.52) 1.49 (1.16-1.91) 0.002 1.21 (0.93-1.58) 0.156
OA or RA 3,831 (18.02) 777 (37.97) 1.26 (1.09-1.45) < 0.001 1.16 (1.00-1.35) 0.044
Pulmonary Tb 1,250 (6.71) 148 (7.84) 0.92 (0.73-1.17) 0.514
Asthma 821 (4.27) 164 (8.89) 1.35 (1.07-1.71) 0.011 1.30 (1.03-1.65) 0.030
Clinical measures BMI
< 25 11,687 (64.36) 1,348 (67.92) 1 (reference) NA NA
≥ 25 6,236 (35.64) 634 (32.08) 0.92 (0.81-1.04) 0.196 NA NA
WC
Normal 10,488 (60.78) 1,015 (52.03) 1 (reference) NA NA
≥ 90 cm (men) 7,476 (39.22) 974 (47.97) 1.02 (0.90-1.15) 0.769 NA NA
≥ 80 cm (women)
Anemia 1,558 (8.42) 286 (16.15) 1.44 (1.20-1.73) < 0.001 1.40 (1.16-1.70) < 0.001
HBsAg carrier 659 (4.21) 35 (2.81) 0.94 (0.62-1.42) 0.758 NA NA
KNHANES, Korean National Health and Nutrition Examination Survey; Unadjusted, unadjusted simple logistic regression analysis; Adjusted, age groups, sex, and smoking status- adjusted logistic regression analysis; OR, odds ratio; CI, confidence interval; Never, never-smoker; Ex, ex-smoker; Current, current smoker; DM, diabetes mellitus; MI, myocar- dial infarction; IHD, ischemic heart disease; OA, osteoarthritis; RA, rheumatoid arthritis; Tb, tuberculosis; BMI, body mass index; WC, waist circumference; HBsAg, hepatitis B surface antigen; NA, not applicable.
Table 4. Comparison of characteristics of participants with cataract surgery in at least one eye to participants with cataracts but without any cataract surgery using logistic re- gression analyses (LRAs) from the 5-year data of the KNHANES (2008-2012)
Parameters
Participants with cataract but without
cataract surgery
Participants with
cataract surgery Adjusted LRA (age group, sex,
and smoking status) Multivariate model LRA (using all variables with P < 0.100 in adjusted analysis)
No. (weighted %) No. (weighted %) OR (95% CI) P value OR (95% CI) P value
Demographics
Age groups, yr P trend < 0.001 P trend < 0.001
40-49 527 (10.79) 51 (4.51) 1 (reference) 1 (reference)
50-59 1,730 (28.64) 132 (9.36) 0.79 (0.53-1.17) 0.240 0.78 (0.51-1.19) 0.247
60-69 3,012 (31.63) 495 (23.95) 1.72 (1.20-2.45) 0.003 1.57 (1.07-2.31) 0.022
≥ 70 2,870 (28.94) 1,311 (62.18) 4.78 (3.38-6.76) < 0.001 3.85 (2.62-5.66) < 0.001
Sex
Men 3,581 (47.71) 774 (39.37) 1 (reference) 1 (reference)
Women 4,558 (52.29) 1,215 (60.63) 1.25 (1.02-1.54) 0.035 1.02 (0.80-1.29) 0.859
Smoking P trend 0.029 P trend 0.154
Never 4,621 (54.64) 1,132 (58.35) 1 (reference)
Ex 1,922 (24.61) 520 (27.56) 1.23 (0.99-1.54) 0.061 1.17 (0.92-1.48) 0.204
Current 1,370 (20.75) 252 (14.10) 0.94 (0.74-1.19) 0.622 0.94 (0.74-1.20) 0.619
House income
> 50% 2,962 (40.94) 519 (29.56) 1 (reference) NA NA
≤ 50% 5,041 (59.06) 1,435 (70.44) 0.97 (0.84-1.13) 0.708 NA NA
Education
≥ High school 2,398 (34.03) 429 (22.82) 1 (reference) NA NA
≤ Middle school 5,522 (65.97) 1,472 (77.18) 0.98 (0.83-1.17) 0.837 NA NA
Occupation P trend < 0.001 P trend < 0.001
Blue collar 2,762 (35.65) 159 (9.91) 1 (reference) 1 (reference)
White collar 1,145 (18.16) 448 (22.56) 1.35 (1.05-1.74) 0.018 1.29 (0.99-1.68) 0.060
Inoccupation 4,003 (46.19) 1,292 (67.53) 1.56 (1.33-1.83) < 0.001 1.42 (1.19-1.70) < 0.001
Residence
Urban 5,491 (59.06) 1,345 (70.34) 1 (reference) 1 (reference)
Rural 2,648 (40.94) 644 (29.66) 0.82 (0.70-0.96) 0.012 0.97 (0.82-1.14) 0.683
Sun exposure
< 5 hr/day 5,808 (75.07) 1,468 (76.34) 1 (reference) 1 (reference)
≥ 5 hr/day 2,265 (24.93) 507 (23.66) 0.85 (0.72-0.99) 0.032 0.98 (0.83-1.16) 0.780
Medical history
Hypertension 3,307 (38.85) 1,004 (52.30) 1.25 (1.10-1.42) 0.001 1.15 (0.99-1.33) 0.066
DM 1,242 (14.89) 445 (22.19) 1.53 (1.31-1.79) < 0.001 1.34 (1.13-1.58) 0.001
Dyslipidemia 1,257 (15.72) 360 (18.53) 1.39 (1.16-1.66) < 0.001 1.21 (1.00-1.47) 0.049
Stroke 334 (3.61) 107 (5.19) 1.11 (0.85-1.43) 0.452 NA NA
MI or IHD 394 (4.53) 152 (7.52) 1.46 (1.14-1.88) 0.003 1.21 (0.92-1.58) 0.174
OA or RA 2,359 (26.81) 777 (37.97) 1.24 (1.08-1.43) 0.002 1.15 (0.99-1.33) 0.070
Pulmonary Tb 659 (8.09) 148 (7.84) 0.92 (0.73-1.17) 0.487 NA NA
Asthma 487 (5.68) 164 (8.89) 1.33 (1.04-1.69) 0.021 1.29 (1.01-1.64) 0.044
Clinical measures BMI
< 25 5,281 (63.92) 1,348 (67.92) 1 (reference) NA NA
≥ 25 2,834 (36.08) 634 (32.08) 0.91 (0.80-1.03) 0.123 NA NA
WC
Normal 4,357 (55.04) 1,015 (52.03) 1 (reference) NA NA
≥ 90 cm (men) 3,782 (44.96) 974 (47.97) 1.01 (0.89-1.15) 0.900 NA NA
≥ 80 cm (women)
Anemia 727 (9.05) 286 (16.15) 1.44 (1.19-1.73) < 0.001 1.41 (1.16-1.71) 0.001
HBsAg carrier 191 (3.57) 35 (2.81) 0.93 (0.60-1.43) 0.739 NA NA
KNHANES, Korean National Health and Nutrition Examination Survey; Unadjusted, unadjusted simple logistic regression analysis; Adjusted, age groups, sex, and smoking status- adjusted logistic regression analysis; OR, odds ratio; CI, confidence interval; Never, never-smoker; Ex, ex-smoker; Current, current smoker; DM, diabetes mellitus; MI, myocar- dial infarction; IHD, ischemic heart disease; OA, osteoarthritis; RA, rheumatoid arthritis; Tb, tuberculosis; BMI, body mass index; WC, waist circumference; HBsAg, hepatitis B surface antigen; NA, not applicable.
DISCUSSION
This study provided detailed estimates regarding the prevalence
and clinical determinants of cataract and cataract surgery based
on a nationally representative database of over 20,000 partici-
pants aged ≥ 40 years. The KOS completed the five-year oph-
thalmic survey project in 2012, accompanying the 2008-2012 KNHANES, and the present results are reported on behalf of the KOS. Since previous epidemiologic studies for cataract and cataract surgery vary considerably across regions, racial/ethnic groups, population structures, economic status, and healthcare systems (9-13), the results of this study are expected to provide a meaningful stepping stone for future investigations and es- tablishing a public health plan.
The prevalence of cataract in participants aged ≥ 40 years in Korea was 42.28%, but in those aged ≥ 70 years, it was > 90%.
Age was the most significant determinant for cataract even in the multiple LRA, as in all previous studies (11,12,14,15). With- out appropriate cataract surgery, the effect of cataract on vision in an aged population can be easily guessed (1). Historically, the association between sex and cataract has not been consis- tent, showing either no association (11) or a higher incidence in women (13). Differences in ethnicity, public health states, child- bearing rates, and socioeconomic status may play a role in these various associations (11,12,14-18). Interestingly, household in- come and education were associated with cataract, and occu- pation also had a marginal association (P = 0.070) with cataract.
Although the underlying mechanism remains unknown, these socioeconomic determinants have also been associated with cataract in previous studies (11,15,16). The determinants of house- hold income, education, and occupation may be surrogate mark- ers for nutrition status, lifestyle, and living conditions. A recent report from the Physicians’ Health Study (PHS) II showed that daily multivitamin use decreased the risk of cataract in well-nou- rished men of high social position (19), suggesting nutrition af- fects the development of cataract. Lastly, like many other stud- ies (17,18,20), the present study also found that hypertension and DM had a positive association with cataract. Hypertension and DM are modifiable risk factors and should be better con- trolled to lessen the socioeconomic and public health burden of cataract.
The current study also estimated cataract surgery in Korea.
The prevalence of cataract surgery in participants aged ≥ 40 years was 7.75%, increasing to 30.63% in those ≥ 70 years. Be- fore comparing the prevalence of cataract surgery between coun- tries, it should be noted that Korea has several remarkable fac- tors/barriers affecting cataract surgery, such as medical resource availability, health insurance, costs, and healthcare utilization.
First, Korea has had universal health insurance coverage since 1989 (21); Koreans have paid only 30% or less of their total med- ical fees, including cataract examination and surgery. In addi- tion, the National Health Insurance provides health checkup programs to all Koreans every two years, including a vision test and referral system. Second, Korea has a relatively large num- ber (approximately 3,000) of certificated ophthalmologists, and there are over 1,100 clinics/hospitals serving small-incision cat- aract surgeries. Cataract surgery is the most frequent surgery in
Korea, reaching 335,915-425,473 cases annually during the study period of 2008-2012. The corresponding cataract surgical rate was 7,000-8,900/million persons/year, which was one of the highest level in the world, especially considering the popula- tion structure of Korea (22,23). All these statistics were from the Korean Statistical Information Service (http://kosis.kr, accessed on 1 March 2014). Lastly, in Korea, the medical fees for hospi- tal/clinics and physicians are set by the government for cost containment (21), and Korea has one of the cheapest medical fees (approximately 1,300 USD in 2012) for cataract surgery in the world (24). Based on these characteristics, Korea is assumed one of the countries that has minimized unmet needs and bar- riers for cataract surgery, and the prevalence of cataract surgery should be interpreted in light of these characteristics.
In addition, this study investigated clinical determinants for cataract surgery by comparing participants in two ways. Similar to the determinants of cataract stated above, age, occupation, and DM consistently had an association with cataract surgery in both two analyses. Interestingly, in addition to these covari- ates, cataract surgery was consistently associated with anemia and asthma, which are novel determinants for cataract surgery found in the present study. Anemia may be associated with ag- ing, as a pro-inflammatory state accompanies aging and may give rise to anemia (25); moreover, inflammation is the second- most cause of anemia and accounts for one-third of anemia in older persons (26,27). As inflammation plays an important role in the development of cataract, it partially explains the associa- tion between anemia and cataract surgery. Inflammation may also explain, at least partially, the association between asthma and cataract surgery; this is because increased systemic inflam- mation is common in asthmatics (28,29). In addition, inhaled corticosteroids are the recommended, preferred long-term ther- apy in asthma patients of all ages (30), and corticosteroids, even inhaled corticosteroids, are causally involved in cataract patho- genesis, especially in posterior subcapsular opacities, which of- ten require early surgical treatment (31). Cataract surgery was also associated with OA or RA when analyzing all participants in the first analysis. The effect of OA or RA on cataract surgery might have been caused by the use of anti-inflammatory drugs (15). However, some studies have shown conflicting results for the association between cataract surgery and anti-inflammato- ry drugs (32,33). Lastly, in addition to DM, hypertension and dyslipidemia were associated with cataract surgery, as they had been for cataract. Both physicians and public health experts must pay attention to these modifiable clinical determinants, including cardiovascular diseases, anemia, and asthma.
However, although it was assumed that Korea has minimized
barriers and unmet needs for cataract surgery, inevitable un-
met needs for cataract surgery and/or lead time bias may affect
the prevalence of and determinants for cataract surgery. The
patients with OA or RA, asthma, or cardiovascular diseases may
be more familiar with healthcare use, resulting in earlier detec- tion of and intervention for cataract. In addition, the results in- dicating lower household income and lower education were positively associated with cataract, but not with cataract sur- gery, suggesting the presence of possible unmet needs for cata- ract surgery due to socioeconomic status. Although the present study, a cross-sectional study using a pre-existing database, did not examine a causal relationship, the results of this study pro- vide directions for further investigations into unmet needs and socioeconomic determinants for cataract surgery. Further in- vestigations, including longitudinal and qualitative studies, are warranted.
The present study has several limitations. The KNHANES did not included institutionalized individuals, and participants with no information on cataract status were excluded. This may cause selection bias in analyzing determinants for cataract and cata- ract surgery, as well as underestimating the prevalence of cata- ract and cataract surgery. The results should be interpreted un- der consideration of these limitations (4). In addition, this study did not provide cataract type-specific analyses, as classified by the LOCS III, for estimating the prevalence and determinants of cataract. Since small-incision cataract surgery, which has be- come commonly used in Korea and developed countries, re- duces the importance of the cataract subtypes and its determi- nants. In addition, a recent study using the three-year data of the 2008-2010 KNHANES has already reported the cataract-type specific prevalence and risk factors for each cataract subtype (34).
In conclusion, the prevalence of cataract and cataract sur- gery was 40.28% and 7.75% respectively in Koreans aged ≥ 40 years, suggesting 9.4 million individuals with cataract and 1.7 million individuals with cataract surgery in at least one eye. In addition to the nationally representative estimates of cataract and cataract surgery from this populous Asian country, the cur- rent study also provides clinical determinants for cataract and cataract surgery. Since cataract has emerged as a public con- cern and the cost burden for cataract surgery has increased with an aging population, it is expected that the present study will form a cornerstone for further investigations and the establish- ment of a public health plan.
DISCLOSURE
No conflicting relationship exists for any author of this study.
The funding organization played no role in the design or con- duct of this research.
AUTHOR CONTRIBUTION
Research conception & design: Park SJ, Lee JH, Park KH. Data acquisition: Kang SW, Hyon JY, Park KH. Data analysis and in-
terpretation: Park SJ, Lee JH, Kang SW, Hyon JY, Park KH. Statis- tical analysis: Park SJ, Lee JH. Drafting of the manuscript: Park SJ, Lee JH, Park KH. Critical revision of the manuscript: Kang SW, Hyon JY, Park KH. Receiving grant: Park SJ. Approval of fi- nal manuscript: all authors.
ORCID
Sang Jun Park http://orcid.org/0000-0003-0542-2758 Ju Hyun Lee http://orcid.org/0000-0001-5743-6751 Se Woong Kang http://orcid.org/0000-0003-2095-6977 Joon Young Hyon http://orcid.org/0000-0003-3620-1536 Kyu Hyung Park http://orcid.org/0000-0002-5516-8121 REFERENCES
1. Pascolini D, Mariotti SP. Global estimates of visual impairment: 2010. Br J Ophthalmol 2012; 96: 614-8.
2. Blindness C. Vision 2020: the cataract challenge. Community Eye Health 2000; 13: 17-9.
3. Kweon S, Kim Y, Jang MJ, Kim Y, Kim K, Choi S, Chun C, Khang YH, Oh K.
Data resource profile: the Korea National Health and Nutrition Examina- tion Survey (KNHANES). Int J Epidemiol 2014; 43: 69-77.
4. Park SJ, Lee JH, Woo SJ, Ahn J, Shin JP, Song SJ, Kang SW, Park KH; Epide- miologic Survey Committee of the Korean Ophthalmologic Society. Age- related macular degeneration: prevalence and risk factors from Korean National Health and Nutrition Examination Survey, 2008 through 2011.
Ophthalmology 2014; 121: 1756-65.
5. Park SJ, Ahn S, Woo SJ, Park KH. Extent of exacerbation of chronic health conditions by visual impairment in terms of health-related quality of life.
JAMA Ophthalmol 2015; 133: 1267-75.
6. Park SJ, Lee JH, Woo SJ, Kang SW, Park KH; Epidemiologic Survey Com- mittee of Korean Ophthalmologic Society. Five heavy metallic elements and age-related macular degeneration: Korean National Health and Nu- trition Examination Survey, 2008-2011. Ophthalmology 2015; 122: 129- 37.
7. Yoon KC, Mun GH, Kim SD, Kim SH, Kim CY, Park KH, Park YJ, Baek SH, Song SJ, Shin JP, et al. Prevalence of eye diseases in South Korea: data from the Korea National Health and Nutrition Examination Survey 2008-2009.
Korean J Ophthalmol 2011; 25: 421-33.
8. Chylack LT Jr, Wolfe JK, Singer DM, Leske MC, Bullimore MA, Bailey IL, Friend J, McCarthy D, Wu SY; The Longitudinal Study of Cataract Study Group. The Lens Opacities Classification System III. Arch Ophthalmol 1993; 111: 831-6.
9. Seah SK, Wong TY, Foster PJ, Ng TP, Johnson GJ. Prevalence of lens opaci- ty in Chinese residents of Singapore: the tanjong pagar survey. Ophthal- mology 2002; 109: 2058-64.
10. Congdon N, Vingerling JR, Klein BE, West S, Friedman DS, Kempen J, O’Col- main B, Wu SY, Taylor HR; Eye Diseases Prevalence Research Group. Prev- alence of cataract and pseudophakia/aphakia among adults in the Unit- ed States. Arch Ophthalmol 2004; 122: 487-94.
11. Athanasiov PA, Casson RJ, Sullivan T, Newland HS, Shein WK, Muecke JS, Selva D, Aung T. Cataract in rural Myanmar: prevalence and risk factors
from the Meiktila Eye Study. Br J Ophthalmol 2008; 92: 1169-74.
12. Duan XR, Liang YB, Wang NL, Wong TY, Sun LP, Yang XH, Tao QS, Yuan RZ, Friedman DS. Prevalence and associations of cataract in a rural Chi- nese adult population: the Handan Eye Study. Graefes Arch Clin Exp Oph- thalmol 2013; 251: 203-12.
13. Mahdi AM, Rabiu M, Gilbert C, Sivasubramaniam S, Murthy GV, Ezelum C, Entekume G; Nigeria National Blindness and Visual Impairment Study Group. Prevalence and risk factors for lens opacities in Nigeria: results of the national blindness and low vision survey. Invest Ophthalmol Vis Sci 2014; 55: 2642-51.
14. Foster PJ, Wong TY, Machin D, Johnson GJ, Seah SK. Risk factors for nu- clear, cortical and posterior subcapsular cataracts in the Chinese popula- tion of Singapore: the Tanjong Pagar Survey. Br J Ophthalmol 2003; 87:
1112-20.
15. Chang JR, Koo E, Agrón E, Hallak J, Clemons T, Azar D, Sperduto RD, Fer- ris FL 3rd, Chew EY; Age-Related Eye Disease Study Group. Risk factors associated with incident cataracts and cataract surgery in the Age-related Eye Disease Study (AREDS): AREDS report number 32. Ophthalmology 2011; 118: 2113-9.
16. Klein R, Klein BE, Jensen SC, Moss SE, Cruickshanks KJ. The relation of socioeconomic factors to age-related cataract, maculopathy, and impaired vision. The Beaver Dam Eye Study. Ophthalmology 1994; 101: 1969-79.
17. Klein BE, Klein R, Lee KE. Diabetes, cardiovascular disease, selected car- diovascular disease risk factors, and the 5-year incidence of age-related cataract and progression of lens opacities: the Beaver Dam Eye Study. Am J Ophthalmol 1998; 126: 782-90.
18. Leske MC, Wu SY, Hennis A, Connell AM, Hyman L, Schachat A. Diabe- tes, hypertension, and central obesity as cataract risk factors in a black population. The Barbados Eye Study. Ophthalmology 1999; 106: 35-41.
19. Christen WG, Glynn RJ, Manson JE, MacFadyen J, Bubes V, Schvartz M, Buring JE, Sesso HD, Gaziano JM. Effects of multivitamin supplement on cataract and age-related macular degeneration in a randomized trial of male physicians. Ophthalmology 2014; 121: 525-34.
20. Tan JS, Wang JJ, Mitchell P. Influence of diabetes and cardiovascular dis- ease on the long-term incidence of cataract: the Blue Mountains eye study.
Ophthalmic Epidemiol 2008; 15: 317-27.
21. Anderson GF. Universal health care coverage in Korea. Health Aff (Mill- wood) 1989; 8: 24-34.
22. Erie JC, Baratz KH, Hodge DO, Schleck CD, Burke JP. Incidence of cata- ract surgery from 1980 through 2004: 25-year population-based study. J Cataract Refract Surg 2007; 33: 1273-7.
23. Lansingh VC, Resnikoff S, Tingley-Kelley K, Nano ME, Martens M, Silva JC, Duerksen R, Carter MJ. Cataract surgery rates in latin america: a four- year longitudinal study of 19 countries. Ophthalmic Epidemiol 2010; 17:
75-81.
24. International Federation of Health Plans (GB). 2012 Comparative price report. Available at http://www.ifhp.com [accessed on 3 March 2014].
25. Roy CN. Anemia of inflammation. Hematology Am Soc Hematol Educ Program 2010; 2010: 276-80.
26. Guralnik JM, Eisenstaedt RS, Ferrucci L, Klein HG, Woodman RC. Preva- lence of anemia in persons 65 years and older in the United States: evi- dence for a high rate of unexplained anemia. Blood 2004; 104: 2263-8.
27. Weiss G, Goodnough LT. Anemia of chronic disease. N Engl J Med 2005;
352: 1011-23.
28. Girdhar A, Kumar V, Singh A, Menon B, Vijayan VK. Systemic inflamma- tion and its response to treatment in patients with asthma. Respir Care 2011; 56: 800-5.
29. Wood LG, Baines KJ, Fu J, Scott HA, Gibson PG. The neutrophilic inflam- matory phenotype is associated with systemic inflammation in asthma.
Chest 2012; 142: 86-93.
30. National Asthma Education and Prevention Program. Expert Panel Re- port 3 (EPR-3): guidelines for the diagnosis and management of asthma- summary report 2007. J Allergy Clin Immunol 2007; 120: S94-138.
31. Weatherall M, Clay J, James K, Perrin K, Shirtcliffe P, Beasley R. Dose-re- sponse relationship of inhaled corticosteroids and cataracts: a systematic review and meta-analysis. Respirology 2009; 14: 983-90.
32. Christen WG, Manson JE, Glynn RJ, Ajani UA, Schaumberg DA, Sperduto RD, Buring JE, Hennekens CH. Low-dose aspirin and risk of cataract and subtypes in a randomized trial of U.S. physicians. Ophthalmic Epidemiol 1998; 5: 133-42.
33. Cumming RG, Mitchell P. Medications and cataract. The Blue Mountains Eye Study. Ophthalmology 1998; 105: 1751-8.
34. Rim TH, Kim MH, Kim WC, Kim TI, Kim EK. Cataract subtype risk factors identified from the Korea National Health and Nutrition Examination sur- vey 2008-2010. BMC Ophthalmol 2014; 14: 4.
Supplementary Table S1. Comparisons of participants aged ≥ 40 years included in and excluded from the study in the KNHANES during 5-year study period (2008-2012)
Characteristics Included participants Excluded participants P value
No. (weighted %) 19,953 (97.34) 466 (2.66)
Age, weighted mean (SE) 55.83 (0.14) 55.87 (0.83) 0.958
Sex, No. (weighted %) 0.002
Male 8,544 (47.84) 233 (56.37)
Female 11,409 (52.16) 233 (43.63)
Smoking, No. (weighted %) 0.010
Never-smoker 11,550 (54.57) 183 (48.90)
Ex-smoker 4,361 (22.85) 68 (20.24)
Current smoker 3,580 (22.58) 87 (30.85)
House income, No. (weighted %) 0.005
> 50% 9,579 (52.62) 184 (42.54)
≤ 50% 10,069 (47.38) 266 (57.46)
Education, No. (weighted %) 0.437
≥ High school 8,968 (47.71) 146 (54.94)
≤ Middle school 10,521 (52.29) 191 (45.06)
Occupation, No. (weighted %) 0.880
White collar 4,898 (30.13) 82 (30.92)
Blue collar 6,323 (33.24) 105 (34.09)
Inoccupation 8,245 (36.63) 150 (34.99)
Residence, No. (weighted %) 0.852
Urban 14,459 (75.91) 346 (75.26)
Rural 5,494 (24.09) 120 (24.74)
Sun exposure, No. (weighted %) 0.862
< 5 hours/day 15,214 (79.56) 285 (80.08)
≥ 5 hours/day 4,594 (20.44) 75 (19.92)
Hypertension, No. (weighted %) 6,192 (27.51) 118 (29.47) 0.547
DM, No. (weighted %) 2,280 (10.17) 48 (12.30) 0.261
Dyslipidemia, No. (weighted %) 2,731 (12.70) 44 (11.77) 0.647
Stroke, No. (weighted %) 575 (2.28) 12 (2.69) 0.672
MI or IHD, No. (weighted %) 755 (3.16) 18 (3.42) 0.774
OA or RA, No. (weighted %) 4,608 (19.55) 90 (18.54) 0.682
Pulmonary Tb, No. (weighted %) 1,398 (6.80) 28 (9.55) 0.156
Asthma, No. (weighted %) 985 (4.62) 28 (6.33) 0.152
Body mass index, No. (weighted %) 0.542
< 25 13,035 (64.63) 297 (62.87)
≥ 25 6,870 (35.37) 151 (37.13)
Waist circumference, No. (weighted %) 0.877
Normal 11,503 (60.10) 280 (59.66)
≥ 90 cm (men) 8,450 (39.90) 186 (40.34)
≥ 80 cm (women)
Anemia, No. (weighted %) 1,844 (8.97) 47 (11.64) 0.129
HBsAg carrier, No. (weighted %) 704 (4.10) 14 (4.37) 0.842
KNHANES, Korean National Health and Nutrition Examination Survey; SE, standard error; DM, diabetes mellitus; MI, myocardial infarction; IHD, ischemic heart disease; OA, os- teoarthritis; RA, rheumatoid arthritis; Tb, tuberculosis; WC, waist circumference; HbsAg, hepatitis B surface antigen.
Supplementary Table S2. Results of unadjusted logistic regression analyses (LRAs) between potential determinants and 1) cataracts and 2) cataract surgery from the 5-year data of the KNHANES (2008-2012)
Parameters Unadjusted LRA for cataract Unadjusted LRA for cataract surgery
OR (95% CI) P value OR (95% CI) P value
Demographics
Age groups P trend < 0.001 P trend < 0.001
40-49 1 (reference) 1 (reference)
50-59 4.43 (3.81-5.15) < 0.001 2.59 (1.80-3.35) < 0.001
60-69 20.34 (17.03-24.29) < 0.001 12.09 (8.78-16.64) < 0.001
≥ 70 128.79 (101.82-162.90) < 0.001 45.88 (33.64-62.58) < 0.001
Sex
Men 1 (reference) 1 (reference)
Women 1.12 (1.05-1.19) < 0.001 1.45 (1.30-1.63) < 0.001
Smoking P trend < 0.001 P trend < 0.001
Never 1 (reference) 1 (reference)
Ex 1.16 (1.07-1.26) < 0.001 1.14 (1.00-1.30) 0.052
Current 0.77 (0.70-0.85) < 0.001 0.56 (0.47-0.67) < 0.001
House income
> 50% 1 (reference) 1 (reference)
≤ 50% 2.64 (2.41-2.89) < 0.001 2.86 (2.49-3.28) < 0.001
Education
≥ High school 1 (reference) 1 (reference)
≤ Middle school 4.30 (3.92-4.71) < 0.001 4.08 (3.56-4.68) < 0.001
Occupation P trend < 0.001 P trend < 0.001
Blue collar 1 (reference) 1 (reference)
White collar 0.42 (0.37-0.47) < 0.001 0.47 (0.38-0.59) < 0.001
Inoccupation 1.85 (1.66-2.06) < 0.001 2.99 (2.57-3.48) < 0.001
Residence
Urban 1 (reference) 1 (reference)
Rural 1.58 (1.34-1.87) < 0.001 1.34 (1.18-1.57) < 0.001
Sun exposure
< 5 hr/day 1 (reference) 1 (reference)
≥ 5 hr/day 1.57 (1.39-1.77) < 0.001 1.23 (1.07-1.41) 0.004
Medical history
Hypertension 3.31 (3.05-3.61) < 0.001 3.21 (2.87-3.59) < 0.001
DM 3.15 (2.76-3.59) < 0.001 2.82 (2.45-3.25) < 0.001
Dyslipidemia 1.72 (1.55-1.90) < 0.001 1.63 (1.40-1.90) < 0.001
Stroke 3.62 (2.86-4.58) < 0.001 2.63 (2.05-3.38) < 0.001
MI or IHD 2.95 (2.39-3.64) < 0.001 2.82 (2.25-3.53) < 0.001
OA or RA 2.76 (2.53-3.01) < 0.001 2.79 (2.47-3.14) < 0.001
Pulmonary Tb 1.40 (1.22-1.61) < 0.001 1.18 (0.95-1.48) 0.143
Asthma 1.87 (1.57-2.22) < 0.001 2.16 (1.75-2.67) < 0.001
Clinical measures BMI
< 25 1 (reference) 1 (reference)
≥ 25 1.00 (0.93-1.08) 0.971 0.85 (0.76-0.96) 0.007
WC
Normal 1 (reference) < 0.001 1 (reference)
≥ 90 cm (men) 1.50 (1.39-1.62) 1.43 (1.28-1.60) < 0.001
≥ 80 cm (women)
Anemia 1.31 (1.16-1.47) < 0.001 2.10 (1.78-2.47) < 0.001
HBsAg carrier 0.77 (0.64-0.93) 0.006 0.70 (0.46-1.07) 0.102
KNHANES, Korean National Health and Nutrition Examination Survey; Unadjusted, unadjusted simple logistic regression analysis; Adjusted, age groups, sex, and smoking status- adjusted logistic regression analysis; OR, odds ratio; CI, confidence interval; Never, never-smoker; Ex, ex-smoker; Current, current smoker; DM, diabetes mellitus; MI, myocar- dial infarction; IHD, ischemic heart disease; OA, osteoarthritis; RA, rheumatoid arthritis; Tb, tuberculosis; BMI, body mass index; WC, waist circumference; HBsAg, hepatitis B surface antigen.