Analysis of Correlation between 24-Hour Urinary Sodium and the Degree of Blood Pressure Control in Patients with Chronic Kidney Disease and Non-Chronic Kidney Disease
We investigated the association between 24-hr urinary sodium (24UNA) and adequacy of blood pressure (BP) control in patients with chronic kidney disease (CKD) and nonCKD. All data were collected retrospectively by accessing the electrical medical records in patients with 24-hr urine collection and serum creatinine. Enrolled 400 subjects were subgrouped by the amount of 24UNA, or CKD stage. The appropriate BP was defined as BP < 130/80 mmHg for subjects with proteinuria, and BP < 140/90 mmHg for subjects without proteinuria. The mean level of 24UNA was 166 ± 76 mEq/day. The 24UNA group was an independently related factor to diastolic BP as a continuous variable. The rate of appropriate BP control in patients with proteinuria was highest in 24UNA < 100 mEq/L (P = 0.012). The odds to fail achievement of BP target in subjects with 24UNA ≥ 90 mEq/
day was 2.441 (1.249-4.772, P = 0.009) higher than that of 24UNA < 90 mEq/day among participants with proteinuria. There was difference in the amount of 24UNA between CKD and non-CKD except each stage of CKD group. In conclusion, salt intake estimated by 24-hr urine sodium excretion is a risk factor to achieve appropriate BP control.
Keywords: Salt; Hypertension; Blood pressure; Renal insufficiency Ho Seok Koo,1,2 Yong Chul Kim,2,3
Shin Young Ahn,4,5 Se Won Oh,6 Suhnggwon Kim,2,5,7,8 and Ho Jun Chin4,5,7,8,9
1Department of Internal Medicine, Seoul Paik Hospital, Inje University College of Medicine, Seoul;
2The Research Institute for Salt and Health,
3Department of Internal Medicine, Armed Forces Capital Hospital, Seongnam; 4Department of Internal Medicine, Seoul National University Bundang Hospital, Seongnam; 5Department of Internal Medicine, Seoul National University College of Medicine, Seoul; 6Department of Internal Medicine, Ilsan Paik Hospital, Inje University College of Medicine, Goyang; 7Renal Institute, Seoul National University Medical Research Center, Seoul;
8Seoul K-Clinic, Seoul; 9Department of Immunology, Seoul National University Postgraduate School, Seoul, Korea,
Received: 7 May 2014 Accepted: 8 July 2014 Address for Correspondence:
Ho Jun Chin, MD
Department of Internal Medicine, Seoul National University Bundang Hospital, 82 Gumi-ro 173beon-gil, Bundang-gu, Seongnam 463-707, Korea
Tel: +82.31-787-7025, Fax: +82.31-787-4052 E-mail: [email protected]
Funding: This research was supported by a grant (13162MFDS104) from Ministry of Food and Drug Safety in 2013.
http://dx.doi.org/10.3346/jkms.2014.29.S2.S117 • J Korean Med Sci 2014; 29: S117-122
INTRODUCTION
High sodium intake increases blood pressure (BP) and proteinuria, induces glomeru- lar hyperfiltration (1), and negatively affects renal outcome (2). Lowering salt intake not only reduces BP, but also lowers albuminuria. A low salt diet (5 g per day) signifi- cantly reduced 24-hr urinary protein excretion by 19% and decreased systolic BP (SBP) and diastolic BP (DBP) by 8 mmHg and 3 mmHg, respectively (3). However, few stud- ies have investigated the direct effect of salt on the incidence of end-stage renal dis- ease, a hard end-point of renal function.
According to guidelines for diabetic and non-diabetic patients with chronic kidney disease (CKD), an albuminuria < 30 mg/day necessitates a BP target consistently be- low 140/90 mmHg and an albuminuria level over 30 mg/day induces a BP target con- sistently below 130/90 mmHg (4). Except for anti-hypertensive medication, modifiable risk factors to increased blood pressure are life styles such as salt intake, obesity, and exercise. The recommended amount of daily salt intake for individuals with cardiovas- cular risks is < 90 mM ( < 2 g) of sodium (corresponding to 5 g of sodium chloride) in adults (4).
The 24-hr urinary sodium (24UNA) analysis is a standard method for estimating the daily sodium intake. A few studies have investigated the association between 24UNA and surrogate markers of renal outcome. In patients with metabolic syndrome, the salt intake estimated by 24UNA was associated with hypertension (5). In patients with hy- pertension, there was also an association of 24UNA and blood pressure (6). However, no study has examined the association between 24UNA and surrogate markers for re- nal outcome in CKD. Therefore, we estimated the salt intake by 24UNA and observed the degree of BP controlled by the daily salt intake.
MATERIALS AND METHODS Populations
All data were collected retrospectively by accessing the electri- cal medical records of patients in Seoul National University Hospital. Among 1,363 outpatients whose serum creatinine and 24-hr urinary sodium were measured, we selected outpatients who collected 24-hr urine, appropriately. We defined an appro- priate urine collection as the ratio of measured 24-hr urinary creatinine to estimated 24-hr urinary creatinine, 0.75-1.25. We also excluded patients who had been prescribed diuretics or fluid therapy, which may influence 24-hr urinary sodium excre- tion. The number of enrolled patients for this analysis was 400.
Definitions
The 24UNA groups were defined by the level of 24-hr urinary sodium (group 1: < 100 mEq/day, group 2: ≥ 100 mEq/day, < 200, group 3: ≥ 200 mEq/day). CKD was defined as 24-hr urine pro- tein 150 mg/day (proteinuria) or more and/or estimated GFR < 60 mL/min/1.73 m2 (7). The GFR was estimated by the equation of the 2009 CKD-EPI creatinine equation (8). CKD groups were classified by the estimated GFR (CKD group - non- CKD, CKD stage 1, CKD stage 2, CKD stage 3a, CKD stage 3b, CKD stage 4, and CKD stage 5).
We used two BP criteria for appropriate BP control according to KDIGO guideline (4). The BP target 1 with SBP < 130 and DBP < 80 mmHg was applied to patients with proteinuria and the other BP target 2, with SBP < 140 and DBP < 90 mmHg, for patients without proteinuria. Hypertension was defined as SBP of ≥ 140 mmHg, DBP of ≥ 90 mmHg, a self-reported history of HTN, or use of antihypertensive medications. Diabetes mellitus (DM) was defined as a fasting glucose of 126 mg/dL, a self-re- ported history of DM, or use of hypoglycemic agents. The amount of 24-hr urinary creatinine was estimated by the equation ([28- (0.2 × age)] × body weight (kg), { × 0.85 if female}, [mg/day] (9).
Statistics
We used Student’s t-test or one-way ANOVA test for continuous data according to the number of subgroups and Fischer’s exact chi-square test for categorical data. The continuous data were summarized as mean ± standard deviation values. Pearson’s correlation coefficients were calculated to determine the relat- ed factors for BP targets. Multiple logistic regression analyses were conducted to determine the independent risk factors to target BP adjusted related factors. The blood pressures were es- timated among groups by a covariate analysis (ANCOVA) ad- justed with related factors to blood pressure. Statistical analyses were performed with SPSS version 20.0 (SPSS Inc., Chicago, IL, USA). Two-sided P values were used in all statistical analyses. A P value < 0.05 was considered statistically significant.
Ethics statement
This study was approved by the institutional review board of the Seoul National University Hospital (IRB No. H-1306-030-496).
Informed consent was exempted by the board.
RESULTS
Participants’ characteristics
The mean age was 48.8 ± 15.0 yr. The female:male ratio was 204:196. The proportion of DM patients was 17.3% (69/400) and that of patients with hypertension was 58.0% (232/400). The mean estimated GFR was 85.2 ± 34.3 mL/min/1.73 m2. The mean amount of 24UNA was 166 ± 76 mEq per day. The mean ratio of 24-hr urinary creatinine and estimated creatinine was 1.01 ± 0.13. The 24UNA groups 1 (24UNA < 100 mEq/L), group 2 (24UNA 100-199 mEq/day) and group 3 (24UNA ≥ 200 mEq/
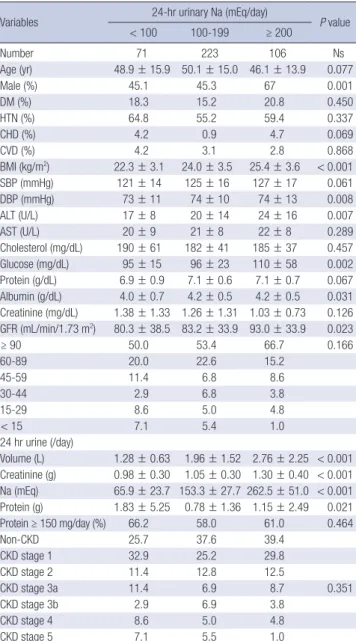
L) comprised of 71,223, and 106 subjects, respectively. There was no difference in the prevalence of DM, hypertension, coro- nary heart disease, and cerebrovascular disease. The propor- tion of men and obesity and the levels of DBP, ALT, serum albu- min, glucose, estimated GFR, daily urine volume, and 24-hr creatinine were highest in 24UNA group 3 (Table 1). There was no difference in the proportion of patients taking anti-hyper- tensive medication among groups (P = 0.776).
The risk factors have an effect on blood pressure
The variables associated with SBP independently were age, BMI, serum glucose, ALT and the amount of 24-hr urinary pro- tein. There was no correlation with 24UNA (Table 2). Estimated SBP was 122 (118-126) mmHg in group 1, 125 (123-127) mmHg in group 2, and 125 (122-128) mmHg in group 3 by ANCOVA adjusted with those related factors (P = 0.381) (Fig. 1).
The variables associated with DBP independently were CKD, serum glucose, and 24UNA group. The estimated DBP was 73 (70-76) mmHg in group 1, 74 (72-75) mmHg in group 2, and 77 (74-79) mmHg in group 3 by ANCOVA adjusted with those re- lated factors (P = 0.050). There was a difference between groups 1 and 3 (P = 0.030) by post-hoc analysis by Fisher’s least signifi- cance difference (Fig. 1).
The association between 24UNA and achieved targets for blood pressure
For patients with proteinuria; the degree of blood pressure control (target BP < 130/80 mmHg)
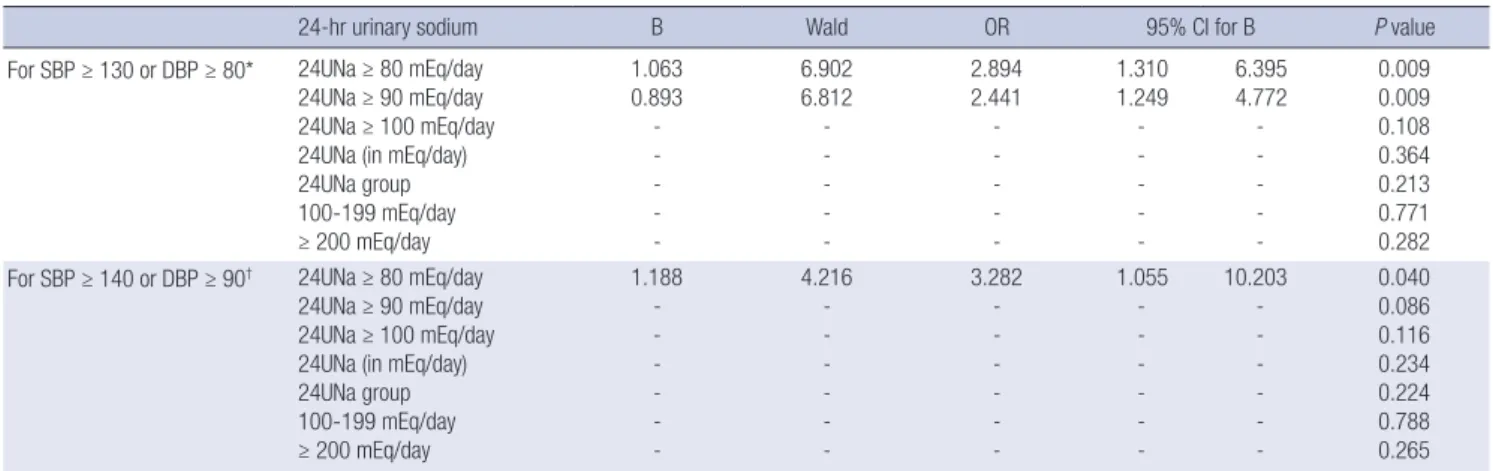
The frequency of BP below 130/80 mmHg was 70.4% (50/71) in 24UNA group 1, 59.6% (130/218) in group 2 and 48.1% (50/104) in group 3 (P = 0.012) (Fig. 2). We demonstrated the association of the following risk factors with not target BP: history of cere- brovascular disease and cardiovascular disease, DM, BMI, se- rum glucose, ALT, AST, and 24-hr urinary protein. In multiple logistic regression analysis adjusted with these variables, sub-
groups divided by the amount of 24UNA 80 mEq/day or 90 mEq/day were associated with achievement of BP target (Table 3). The higher excretion of 24UNA was, the higher risk of failure to achieve BP target. The odds to fail achievement of BP target in subjects with 24UNA ≥ 90 mEq/day was 2.441 (1.249-4.772) (P = 0.009) higher than those of 24UNA < 90mEq/day. The odds to fail achievement of BP target in subjects with 24UNA
≥ 80 mEq/day was 2.894 (1.310-6.395) (P = 0.009) higher than those of 24UNA < 90 mEq/day.
For patients without proteinuria; the degree of blood pressure control (the target BP < 140/90 mmHg)
The frequency of BP < 140/90 mmHg was 87.3% (62/71) in 24UNA group 1, 81.7% (178/218) in group 2 and 75.0% (78/104) in group 3 (P = 0.115) (Fig. 2). We analyzed the risk factors that resulted in failure to achieve the target BP and revealed that the factors of DM, cholesterol, albumin, glucose, ALT, AST, GFR, and 24-hr urinary protein, were associated. In multiple logistic regression analysis adjusted with these variables, the group di- Table 1. Clinical characteristics of 24UNA group
Variables 24-hr urinary Na (mEq/day)
P value
< 100 100-199 ≥ 200
Number 71 223 106 Ns
Age (yr) 48.9 ± 15.9 50.1 ± 15.0 46.1 ± 13.9 0.077
Male (%) 45.1 45.3 67 0.001
DM (%) 18.3 15.2 20.8 0.450
HTN (%) 64.8 55.2 59.4 0.337
CHD (%) 4.2 0.9 4.7 0.069
CVD (%) 4.2 3.1 2.8 0.868
BMI (kg/m2) 22.3 ± 3.1 24.0 ± 3.5 25.4 ± 3.6 < 0.001
SBP (mmHg) 121 ± 14 125 ± 16 127 ± 17 0.061
DBP (mmHg) 73 ± 11 74 ± 10 74 ± 13 0.008
ALT (U/L) 17 ± 8 20 ± 14 24 ± 16 0.007
AST (U/L) 20 ± 9 21 ± 8 22 ± 8 0.289
Cholesterol (mg/dL) 190 ± 61 182 ± 41 185 ± 37 0.457
Glucose (mg/dL) 95 ± 15 96 ± 23 110 ± 58 0.002
Protein (g/dL) 6.9 ± 0.9 7.1 ± 0.6 7.1 ± 0.7 0.067 Albumin (g/dL) 4.0 ± 0.7 4.2 ± 0.5 4.2 ± 0.5 0.031 Creatinine (mg/dL) 1.38 ± 1.33 1.26 ± 1.31 1.03 ± 0.73 0.126 GFR (mL/min/1.73 m2) 80.3 ± 38.5 83.2 ± 33.9 93.0 ± 33.9 0.023
≥ 90 50.0 53.4 66.7 0.166
60-89 20.0 22.6 15.2
45-59 11.4 6.8 8.6
30-44 2.9 6.8 3.8
15-29 8.6 5.0 4.8
< 15 7.1 5.4 1.0
24 hr urine (/day)
Volume (L) 1.28 ± 0.63 1.96 ± 1.52 2.76 ± 2.25 < 0.001 Creatinine (g) 0.98 ± 0.30 1.05 ± 0.30 1.30 ± 0.40 < 0.001 Na (mEq) 65.9 ± 23.7 153.3 ± 27.7 262.5 ± 51.0 < 0.001 Protein (g) 1.83 ± 5.25 0.78 ± 1.36 1.15 ± 2.49 0.021
Protein ≥ 150 mg/day (%) 66.2 58.0 61.0 0.464
Non-CKD 25.7 37.6 39.4
CKD stage 1 32.9 25.2 29.8
CKD stage 2 11.4 12.8 12.5
CKD stage 3a 11.4 6.9 8.7 0.351
CKD stage 3b 2.9 6.9 3.8
CKD stage 4 8.6 5.0 4.8
CKD stage 5 7.1 5.5 1.0
CHD, coronary heart disease-stable or unstable angina, acute or old myocardial in- farction, CVD, hemorrhagic or non-hemorrhagic cerebrovascular disease
Table 2. Correlation between BPs and other factors by multiple linear regression model
Variables B 95% CI for B P value
For SBP* Glucose (mg/dL) BMI (kg/m2) 24HU protein (mg/day) Age (yr)
ALT (U/L)
0.075 0.527 0.001 0.131 0.114
0.031 0.093 0.000 0.026 0.004
0.119 0.961 0.001 0.237 0.224
0.001 0.017 0.007 0.015 0.043 For DBP† Glucose (mg/dL)
CKD (presence) 24HUNA group‡
0.049 2.942 1.965
0.018 0.617 0.264
0.081 5.267 3.665
0.002 0.013 0.024
*For SBP: adjusted with age, BMI, glucose, cholesterol, 24-hr urinary protein, ALT, GFR, uric acid, history of CVD and cancer, and 24-hr urinary sodium group, which were re- lated factors to SBP by correlation coefficient; †For DBP: adjusted with BMI, glucose, cholesterol, 24-hr urinary protein, ALT, presence of CKD, and 24-hr urinary sodium group, which were related factors to SBP by correlation coefficient; ‡24HUNA group:
24-hr urinary sodium grouped by the criteria of 100 and 200 mEq/day.
SBP (mmHg)
< 100 100-199 ≥ 200
24 hr-urine sodium (mEq/day) 130
128 126 124 122 120 118 116
P = 0.381
DBP (mmHg)
< 100 100-199 ≥ 200
24 hr-urine sodium (mEq/day) 80
78 76
74 72
70 68
P = 0.050 *
Fig. 1. The estimated levels of blood pressures in 24UNA group adjusted with relat- ed factors (see Table 2) by ANCOVA test. *P value = 0.030 compared to group with 24 hr-urine sodium < 100 mEq/day. The bar means the 95% confidence interval of estimated value in each group.
Table 4. Descriptive statistics of 24-hr urinary sodium in CKD group Variables Number 24-hr urinary Na (mEq/day)
Mean SD Range
Non-CKD 141 174 70 23 444
CKD stage 1 109 166 77 5 376
CKD stage 2 49 170 78 14 396
CKD stage 3 53 163 77 29 373
CKD stage 4 22 148 77 16 269
CKD stage 5 18 132 52 38 227
*P value = 0.235 by ANOVA test.
Table 3. Correlation between BP targets and 24-hr urinary sodium parameters by multiple logistic regression model in all participants
24-hr urinary sodium B Wald OR 95% CI for B P value
For SBP ≥ 130 or DBP ≥ 80* 24UNa ≥ 80 mEq/day 24UNa ≥ 90 mEq/day 24UNa ≥ 100 mEq/day 24UNa (in mEq/day) 24UNa group 100-199 mEq/day
≥ 200 mEq/day
1.063 0.893 - - - - -
6.902 6.812 - - - - -
2.894 2.441 - - - - -
1.310 1.249 - - - - -
6.395 4.772 - - - - -
0.009 0.009 0.108 0.364 0.213 0.771 0.282 For SBP ≥ 140 or DBP ≥ 90† 24UNa ≥ 80 mEq/day
24UNa ≥ 90 mEq/day 24UNa ≥ 100 mEq/day 24UNa (in mEq/day) 24UNa group 100-199 mEq/day
≥ 200 mEq/day
1.188 - - - - - -
4.216 - - - - - -
3.282 - - - - - -
1.055 - - - - - -
10.203 - - - - - -
0.040 0.086 0.116 0.234 0.224 0.788 0.265
*For BP target, 130/80 mmHg, adjusted with history of cerebrovascular disease and cardiovascular disease, DM, BMI, serum glucose, ALT, AST, and 24-hr urinary protein; †For BP target, 140/90 mmHg, adjusted with DM, cholesterol, albumin, glucose, ALT, AST, GFR, and 24-hr urinary protein.
BP 13080 BP 14090
<100 100-199 ≥ 200 <100 100-199 ≥ 200 24-hr urine Na (mEq/day)
90 80 70 60 50 40 30 20 10 0 (%)
P = 0.012
P = 0.115
Fig. 2. Frequency of BP<130/80 mmHg or<140/90 mmHg among all participants according to levels of 24-hr urine sodium.
vided by the amount of 24UNA 80 mEq/day was associated with achievement of BP target (Table 3). The more excretion of 24UNA was, the higher risk of failure to achieve BP target. The odds to fail achievement of BP target in subjects with 24UNA ≥ 80 mEq/day was 2.441 (1.249-4.772) (P = 0.040) higher than those of 24UNA < 80 mEq/day (Table 3).
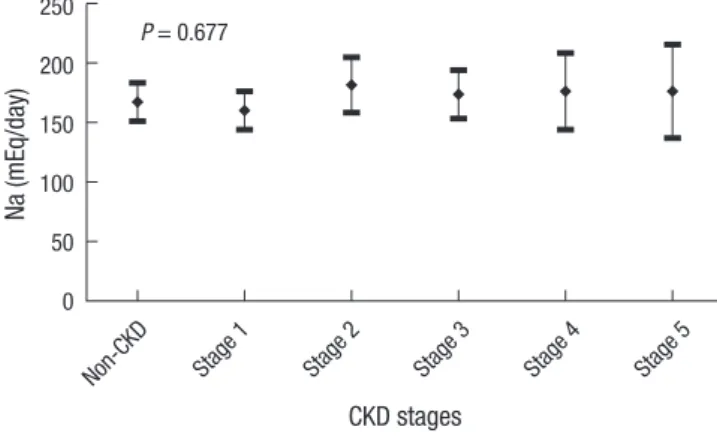
The amount of 24-hr urine sodium according to CKD stages There was no difference of the amount of 24UNA according to CKD stages (Table 4, P = 0.235). The proportion of subjects with 24UNa < 100 mEq/day differed when we compared non-CKD with CKD (12.8% vs. 20.7%, P = 0.049). However, this difference disappeared in the comparison between non-CKD group with each stage-group of CKD (Fig. 3). We estimated the amount of 24UNA within CKD stages by the ANCOCA adjusted with meaningful variables such as BMI, DBP, serum albumin, uric acid, glucose and 24-hr urinary creatinine and found that there was no difference in the amount of 24UNA between non-CKD and each CKD stage (P = 0.677) (Fig. 4).
DISCUSSION
The feasible methods to estimate the sodium intake are dietary survey and 24-hr urine collection. Dietary survey tends to un-
derestimate sodium intake due to the difficulty of quantifying sodium intake (10). The 24-hr urine collection method is now accepted as the gold standard to estimate the sodium intake (11). However, it can be biased if the participant collects urine incompletely. To overcome incomplete sampling, urinary cre- atinine is also measured with sodium (12). In the present study, we judged the completeness by comparing the measured and calculated creatinine. The ratio of those values was 1.01 ± 0.13 and the mean 24UNA value of 166 ± 76 mEq per day was simi- lar with the mean value of 166.4 ± 68.1 mEq per day for 24-hr urinary sodium in residents of a randomly selected city (13).
Therefore although the data were extracted in the hospital, they had epidemiological value.
In patients with CKD, hypertension is both a cause and com-
plication of CKD. It is the most important risk factor for the pro- gression of CKD and the occurrence of cardiovascular disease (14). In addition, proteinuria is evidence of kidney injury, CKD progression and a risk factor of cardiovascular disease (15).
Hence many studies on CKD progression have used hyperten- sion and proteinuria as surrogate markers for renal outcome of end-stage renal disease. High dietary salt intake increases the risk of high BP and worsens existing hypertension (16) and pro- teinuria (3). Many studies have investigated the associations with salt intake estimated by 24-hr urine collection and BP in both the general population and in patients with hypertension (16). However, not many studies have examined patients with other diseases. Especially, no study has investigated the associ- ations with salt intake estimated by the 24-hr urine collection and surrogate markers in CKD and in nonCKD. Therefore, we observed such associations in CKD. We found an association of salt intake estimated by the 24-hr urine collection, with DBP.
When humans consume salt, the volume of extracellular flu- id expands. In turn, BP is increased by the increase of cardiac output (17). So if patients with CKD have a high salt intake, hy- pertension may occur and the kidney function can be degrad- ed. One meta-analysis of this result has been conducted (2).
Following much evidence such as this study, a recommenda- tion of low salt intake was made in the KDIGO 2012 CKD man- agement guideline (4). This guideline recommends that pa- tients with CKD have a daily salt intake below 5 g. Unlike other minerals, there is no recommendation for estimated average requirement for beneficial effects and an upper tolerance level for adverse effects. Sodium has only a standard for requirement of adequate intake. Therefore, we could not determine the level of salt intake that has a bad effect on hypertension and protein- uria. How much salt should humans consume to avoid the bad effects of BP and proteinuria? No study has examined salt in- take with adverse effects on BP and proteinuria in CKD pa- tients. Recommended guidelines of salt intake from an evi- dence-based study cannot be extended to patients with CKD.
In the present study, we observed an association between salt intake estimated by 24UNA and the target of BP (130/80,140/90 mmHg). We found that a 24-hr urinary sodium level below 100 mEq/L resulted in a proportion of target BP up to 70%. When 24UNA was over 80 mEq/L, the odds of BP over 130/90 mmHg was 2.4 times in patients with CKD and nonCKD. In this con- text, we suggest that patients with CKD should limit their sodi- um intake below 100 mEq/L (2.5 gram Salt), and preferably be- low 80 mEq/L, to control for target BP.
The fraction of sodium excretion is increased to maintain the sodium balance because of the loss of functioning nephrons.
Therefore, as kidney function deteriorates, sodium excretion is known to be increased (1). Hence the 24 hr urine sodium can- not be a good indicator of the sodium intake in patients with CKD. In the present study, however, there was difference in so- dium excretion fraction between non-CKD and CKD except CKD stages. Therefore, 24UNA is thought to be a useful guide for salt intake in patients with CKD.
The present study was limited by its retrospective design. The information from the 3rd referral hospital may have produced a selection bias.
In conclusion, salt intake estimated by 24-hr urine sodium excretion is a risk factor to achieve appropriate BP control.
DISCLOSURE
The authors declare that they have no conflicts of interest to disclose.
ORCID
Ho Seok Koo http://orcid.org/0000-0001-7856-8083 Yong Chul Kim http://orcid.org/0000-0003-3215-8681 Ho Jun Chin http://orcid.org/0000-0003-1185-2631 Suhnggwon Kim http://orcid.org/0000-0001-6904-9126 Non-CKD All-CKDs Stage 1
Stage 2 Stage 3
Stage 4 Stage 5 30
25 20 15 10 5 0
Fig. 3. The prevalence of 24-hr urine sodium < 100 mEq in each group of chronic kidney disease (CKD). *P < 0.05 compared to Non-CKD group.
*
Na (mEq/day)
Non-CKD Stage 1
Stage 2
Stage 3
Stage 4
Stage 5 CKD stages
250 200 150 100 50 0
P = 0.677
Fig. 4. The estimated value of 24-hr urine sodium in CKD groups adjusted with relat- ed factors, such as history of cancer, DBP, BMI, glucose, uric acid, serum albumin stratified with 3.0 g/dL, and 24-hr urine protein, by ANCOVA test. The bar means the 95% confidence interval of estimated value in each group.
(%)
REFERENCES
1. Weir MR, Dengel DR, Behrens MT, Goldberg AP. Salt-induced increases in systolic blood pressure affect renal hemodynamics and proteinuria.
Hypertension 1995; 25: 1339-44.
2. Jones-Burton C, Mishra SI, Fink JC, Brown J, Gossa W, Bakris GL, Weir MR. An in-depth review of the evidence linking dietary salt intake and progression of chronic kidney disease. Am J Nephrol 2006; 26: 268-75.
3. Swift PA, Markandu ND, Sagnella GA, He FJ, MacGregor GA. Modest salt reduction reduces blood pressure and urine protein excretion in black hypertensives: a randomized control trial. Hypertension 2005; 46:
308-12.
4. Outcomes KDIG. KDIGO guidelines. Available from http://kdigo.org/
home/guidelines/ckd-evaluation-management/ [accessed on 31 Mar 2014].
5. Hoffmann IS, Cubeddu LX. Increased blood pressure reactivity to di- etary salt in patients with the metabolic syndrome. J Hum Hypertens 2007; 21: 438-44.
6. Xu J, Wang M, Chen Y, Zhen B, Li J, Luan W, Ning F, Liu H, Ma J, Ma G.
Estimation of salt intake by 24-hour urinary sodium excretion: a cross- sectional study in Yantai, China. BMC Public Health 2014; 14: 136.
7. K/DOQI clinical practice guidelines for chronic kidney disease: evalua- tion, classification, and stratification. Am J Kidney Dis 2002; 39: S1-266.
8. Levey AS, Stevens LA, Schmid CH, Zhang YL, Castro AF 3rd, Feldman HI, Kusek JW, Eggers P, Van Lente F, Greene T, et al. A new equation to estimate glomerular filtration rate. Ann Intern Med 2009; 150: 604-12.
9. Cockcroft DW, Gault MH. Prediction of creatinine clearance from serum creatinine. Nephron 1976; 16: 31-41.
10. Khaw KT, Bingham S, Welch A, Luben R, O’Brien E, Wareham N, Day N.
Blood pressure and urinary sodium in men and women: the Norfolk Cohort of the European Prospective Investigation into Cancer (EPIC- Norfolk). Am J Clin Nutr 2004; 80: 1397-403.
11. Schachter J, Harper PH, Radin ME, Caggiula AW, McDonald RH, Diven WF. Comparison of sodium and potassium intake with excretion. Hy- pertension 1980; 2: 695-9.
12. Ljungman S, Aurell M, Hartford M, Wikstrand J, Wilhelmsen L, Berglund G. Sodium excretion and blood pressure. Hypertension 1981; 3: 318-26.
13. Rhee MY, Shin SJ, Park SH, Kim SW. Sodium intake of a city population in Korea estimated by 24-h urine collection method. Eur J Clin Nutr 2013; 67: 875-80.
14. Sarnak MJ, Levey AS, Schoolwerth AC, Coresh J, Culleton B, Hamm LL, McCullough PA, Kasiske BL, Kelepouris E, Klag MJ, et al. Kidney disease as a risk factor for development of cardiovascular disease: a statement from the American Heart Association Councils on Kidney in Cardiovas- cular Disease, High Blood Pressure Research, Clinical Cardiology, and Epidemiology and Prevention. Circulation 2003; 108: 2154-69.
15. Jafar TH, Stark PC, Schmid CH, Landa M, Maschio G, Marcantoni C, de Jong PE, de Zeeuw D, Shahinfar S, Ruggenenti P, et al. Proteinuria as a modifiable risk factor for the progression of non-diabetic renal disease.
Kidney Int 2001; 60: 1131-40.
16. Elliott P, Stamler J, Nichols R, Dyer AR, Stamler R, Kesteloot H, Marmot M. Intersalt revisited: further analyses of 24 hour sodium excretion and blood pressure within and across populations. Intersalt Cooperative Re- search Group. BMJ 1996; 312: 1249-53.
17. Meneton P, Jeunemaitre X, de Wardener HE, MacGregor GA. Links be- tween dietary salt intake, renal salt handling, blood pressure, and car- diovascular diseases. Physiol Rev 2005; 85: 679-715.