서 론
세계보건기구(
World Health Organization
,WHO
)에 의하면 비만의 유병률은1980
년 이후 전 세계적으로2
배 가까이 증가하였으며,2014
년 기준 성인19
억 명이 과체중,6
억 명이 비만이라고 보고하였 다.1) 비만은 심혈관계 질환, 근골격계 질환, 종양과 당뇨를 포함한 다양한 질환의 위험도를 상승시키는 것으로 알려져 있다.1-3) 따라서 비만은 이러한 질환들의 중요한 예측지표가 될 수 있기에, 비만의 진단과 관리는 중요하게 여겨진다. 비만 측정지표로써 체질량지수 (body mass index
,BMI
), 허리둘레 등이 이용되어 왔으며4)waist-to-
hip ratio
,waist-to-height ratio
등이 연구되고 있다.5) 이외에도WHO
에서는 체지방률에 따른 비만의reference standard
를 제안하고 있는 데, 남성25
%, 여성35
% 이상을 기준으로 한다.6)BMI
는 키와 몸무게로 쉽게 계산할 수 있어 비만 선별을 위해 흔 히 사용되는 지표이지만, 체지방률과 체지방 분포를 확인하는데 한 계가 있으며 성별에 따른 차이가 없다.7,8) 또한 체지방률로 정의하는 비만의 오진율을 높이는 것으로 알려져 있는데, 특히 과체중인 사 람에서 체지방률로 정의하는 비만의 유병률을 실제보다 낮게 평가 시킬 수 있다.9)이전 연구들에서 체지방률이 높으면
mortality
가 증가하는 것으로Received May 31, 2019 Revised October 8, 2019 Accepted January 15, 2020
Corresponding author Seon Yeong Lee Tel: +82-2-950-1150, Fax: +82-2-950-4093 E-mail: [email protected]
ORCID: http://orcid.org/0000-0002-8274-3654
Copyright © 2020 The Korean Academy of Family Medicine
This is an open-access article distributed under the terms of the Creative Commons At- tribution Non-Commercial License (http://creativecommons.org/licenses/by-nc/4.0) which permits unrestricted noncommercial use, distribution, and reproduction in any medium, provided the original work is properly cited.
Original Article
https://doi.org/10.21215/kjfp.2020.10.1.68 eISSN 2233-9116
Korean J Fam Pract. 2020;10(1):68-73
Korean Journal of Family Practice
KJFP
한국 성인에서 Relative Fat Mass 공식의 적용
이미지, 김영혜, 김진구, 이선영*, 김규남, 김종우, 백정기
인제대학교 의과대학 상계백병원 가정의학교실
Application of Relative Fat Mass Equation in Korean Adults
Mi Ji Lee, Young Hye Kim, Jin Gu Kim, Seon Yeong Lee*, Kyunam Kim, Jongwoo Kim, Jeong Ki Paek Department of Family Medicine, Sanggye Paik Hospital, Inje University College of Medicine, Seoul, Korea
Background: Body mass index (BMI) has limitations in determining body fat percentage and body fat distribution, and causes misclassification of body fat-defined obesity. As high body fat percentage is associated with mortality, an accurate assessment of body fat percentage is considered clinically important. Recently, Woolcott and Bergman reported a relative fat mass (RFM) equation which calculated the body fat percentage using the height and waist circumferences. However, as RFM has been studied only in European-, Mexican-, and African-Americans, an assessment in Asians was needed. Therefore, we aimed to evaluate the applicability of RFM in Korean adults.
Methods: This study included 7,733 adults who visited a Sanggye Paik Hospital Health Promotion Center from May 1, 2016 to November 12, 2018. BMI and RFM were calculated by measuring height, weight, and waist circumference. The total body fat (TBF) percentage was measured by bioelectrical impedance analysis. We compared the BMI, RFM, and TBF percentage to assess the applicability of RFM in Korean adults.
Results: RFM had a statistically significant correlation with TBF percentage in both male and female (male: β=0.808, R2=0.653, female: β=0.766, R2=0.587, P<0.001). In the Bland-Altman plot, RFM showed good agreement with the TBF percentage within the 95% confidence interval.
Conclusion: The RFM equation can be used to predict TBF percentage in Korean adults.
Keywords: Obesity; Body Mass Index; Adiposity
이미지 외. 한국 성인에서 Relative Fat Mass 공식의 적용 Korean Journal of Family Practice
KJFP
보고되었으며,10,11) 따라서 체지방률을 정확히 평가하는 것은 임상적 으로 중요하게 생각된다. 체지방률은
dual energy X-ray absorptiometry
(DXA
)나bioelectrical impedance analysis
(BIA
) 등을 이용하여 측정할 수 있지만,12-14) 이를 갖추기 힘든1
차 의료에서 체지방률을 평가하는 것에는 한계가 있다. 또한 체지방률을 계산하는 여러 공식들이 개 발되었으나, 임상에서 사용하기에 실효성이 떨어지는 경우가 많고, 연구 대상자의 수가 적거나 대상군이 제한되어 전체 인구에 적용하 기에는 한계가 있는 경우가 많았다.15-18)최근 미국의
Woolcott
과Bergman
19)은DXA
로 측정한 체지방률과 키/허리둘레의 상관관계를 분석하여 새로운 비만 측정도구로써 간 단하고 정확한relative fat mass
(RFM
) 공식을 개발하여 발표하였다.그러나
RFM
은 유럽계, 멕시코계, 아프리카계 미국인을 대상으로 연 구되어 아시아인에 대한 평가가 필요하다.따라서 본 연구는 한국인을 대상으로
BIA
로 측정한total body fat
(TBF
)percentage
와RFM
을 비교하여 한국인에서의RFM
적용 가능 성을 평가하고자 한다.방 법
1. 연구대상
2016
년5
월1
일부터2018
년11
월12
일까지 인제대학교 상계백병원 종합건강증진센터를 방문하여BIA
를 시행한20
세 이상 성인(20–88
세)7
,758
명 중에서1
) 체중136 kg
이상,2
) 신장196 cm
이상,3
) 허리 둘레 기입에 오류가 있는 경우,4
)BIA
결과가 없는 경우를 제외한 총7
,733
명(남성5
,282
명, 여성2
,451
명)을 대상으로 하였다.1
),2
)는Woolcott
과Bergman
19)의exclusion criteria
를 반영하였다. 본 연구는 인제대학교 상계백병원 임상연구윤리위원회(Institutional Review Board
)의 승인을 받아 시행되었다(IRB No
.SGPAIK
/2019-02-011
).2. 신체계측치
신체계측치는
12
시간 이상 공복 후 가벼운 옷을 입고 신발과 양 말을 벗은 상태로 측정하였다. 신장과 체중은 자동신장/체중 측정 기(BSM330
;Biospace
,Seoul
,Korea
)로 각각0
.1 cm
,0
.1 kg
단위까지 측정했다. 허리둘레는 숨을 편안히 내쉰 상태에서 중간겨드랑 선에 서 촉진되는 마지막 늑골 하단의 가장 아래 부위와 장골능선 상단 부위의 중간 지점을 바닥과 평행하게 하여0
.1 cm
단위까지 측정했 다.BMI
는 체중(kg
)을 신장(m
)의 제곱으로 나눈 값으로 계산했으 며,RFM
은 성별에 따라 키와 허리둘레를 이용해 계산했다.RFM
공 식은 다음과 같다.19)여자:
76-
(20
×height
/waist circumference
)남자:
64-
(20
×height
/waist circumference
)3. Total body fat percentage
TBF percentage
는BIA
(Inbody770
;Biospace
)를 통해 측정했다. 검 사 전12
시간 이상 공복 상태로 격렬한 운동은 하지 않고, 측정 전 소변을 보게 한 후, 가벼운 옷을 입고 신발과 양말을 벗은 상태로 전류의 흐름에 영향을 주는 금속류는 모두 제거하고 측정하였다.4. 통계분석
IBM SPSS Statistics for Windows
,Version 24
.0
(IBM Co
.,Armonk
,NY
,USA
)를 이용하였고99
.9
%의 유의수준(P<0
.001
)에서 통계적 유 의성을 평가하였다. 연구 대상자의 일반적 특성을 분석하기 위해 모 든 통계 수치들은 평균±표준오차를 구하였다.BIA
로 측정한TBF percentage
와BMI
및RFM
의 상관관계를 분석하기 위하여 전체, 남 성, 여성으로 나눠 연령을 보정하여 편상관분석을 하였다. 단순 선 형 회귀분석을 통해 표준화계수(β) 및 결정계수(R
2)를 구하였고,TBF percentage
와RFM
의mean difference
(MD
)와95
%limits of agreement
(LoA
)를 구하고Bland-Altman plot
20)을 이용하여TBF percentage
와RFM
의 일치도를 평가하였다.Bland-Altman plot
은 다른 측정법으로 측정한 두 측정값의 일치도 를 평가하기 위한 것으로, 두 측정값의 평균과 차이를 구하여 각각 을x
축,y
축으로 하여 그릴 수 있다.Mean difference
는bias
를 의미하 며,mean difference
±1
.96
×standard deviation
(SD
)of the difference
를 계산하여limit of agreement
로 한다. 관측치의 차이가 정규분포한다 면95
%의 값은 이 안에 들어온다고 볼 수 있으며, 점들이bias
주변 으로 균일하게 퍼져있다면 측정값의 크기에 따라 측정 차이가 달라 지지 않는 것을 의미한다.20)결 과
1. 연구대상자의 임상적 특성
전체 대상자
7
,733
명 중, 남성은5
,282
명(68
%), 여성은2
,451
명(32
%) 이었고, 평균 나이는 각각48
.7
±0
.14
세,51
.2
±0
.23
세였다. 남성의 평 균BMI
는25
.0
±0
.04
,RFM
은24
.0
±0
.05
,TBF percentage
는24
.4
±0
.08
이었다. 여성의 평균BMI
는23
.4
±0
.07
,RFM
은34
.9
±0
.11
,TBF percentage
는33
.3
±0
.12
였다(Table 1
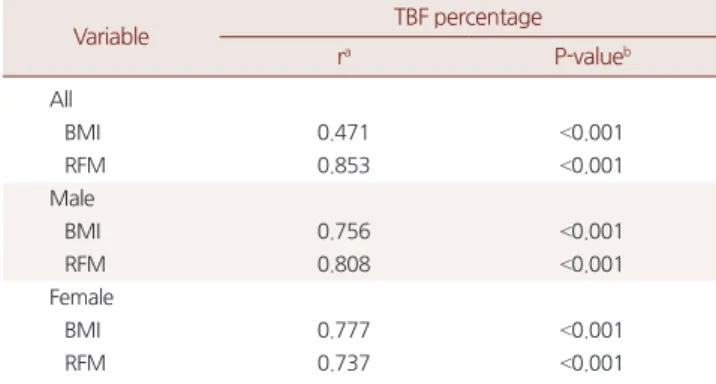
).2. Total body fat percentage와 변수들의 상관관계
편상관분석에서
TBF percentage
는 남성과 여성에서BMI
(r=0
.756 vs
.r=0
.777
,P<0
.001
),RFM
(r=0
.808 vs
.r=0
.737
,P<0
.001
)과 유의한 양Original Article
Korean Journal of Family Practice
Mi Ji Lee, et al. Application of Relative Fat Mass Equation in Korean Adults
Korean Journal of Family Practice
KJFP
의 상관관계를 보였다. 전체 대상자에서
TBF percentage
는RFM
(r=0
.853
,P<0
.001
)과 더 높은 유의한 양의 상관관계를 보인 반면,BMI
(r=0
.471
,P<0
.001
)와는 유의한 양의 상관관계를 보였지만 남녀 를 구분했을 때보다는 상관성이 감소되었다(Table 2
).3. Total body fat percentage와 변수들의 회귀분석
단순 선형 회귀분석을 이용하여 전체 및 남성과 여성에서
BMI
와RFM
을 통해TBF percentage
를 예측하는 선형 회귀식을 구하였으며 결정계수(R
2)를 구하여 적합성을 판정하였다. 남성의 경우BMI
의R
2 은0
.558
(P<0
.001
),RFM
의R
2은0
.653
(P<0
.001
)이었고, 여성에서는BMI
의R
2은0
.638
(P<0
.001
),RFM
의R
2은0
.587
(P<0
.001
)이었다. 전 체 대상자에서는RFM
의R
2은0
.740
(P<0
.001
)인 반면BMI
의R
2은0
.224
(P<0
.001
)였다(Table 3
).4. Total body fat percentage와 relative fat mass의 일치도 분석
TBF percentage
와RFM
이 일치하는 정도를 확인해 보기 위해, 두 측정값의 평균과 차이를 구하여Bland-Altman plot
을 이용하였다 (Figure 1
). 남성의 경우MD
는-0
.419
(SD
:3
.314
,95
%LoA
:-6
.915
,6
.078
)였으며, 여성의 경우MD
는1
.620
(SD
:3
.950
,95
%LoA
:-6
.122
,9
.362
)이었다.고 찰
체지방률을 평가함에 있어
BMI
를 대체할 수 있는 다양한 공식들 이 연구되어 왔지만,15-18) 이전에 발표된 공식들은 실효성이 떨어져 임상에서 사용하기에 제한이 있어 더 단순한 공식의 개발이 필요하 다. 최근Woolcott
과Bergman
19)이 발표한RFM
은 미국National
Health and Nutrition Examination Survey
(NHANES
)를 이용하여20
세 이상 성인을 대상으로 연구되었다.NHANES 1999–2004 data
에서 성인12
,581
명을 대상으로model development
를 하였으며NHANES 2005–2006 data
에서 성인3
,456
명을 대상으로model validation
을 시 행하였다. 체지방률은DXA
를reference method
로 하여 구하였다. 체 지방률과 신체계측치들과의 상관성을 분석하였으며, 회귀분석을 통 해 하나 또는 여러가지로 조합된 신체계측치 중에 체지방률과 가장 높은 상관성을 보이는 것들을 선택하여, 이 중 체지방률을 예측하 는 정도(R
2), 단순성을 비교하여height
/waist equation
을 최종 모델로 선택하였다.19)RFM
은 키와 허리둘레만으로 단순하고 정확하게 체지 방률을 얻을 수 있어 체지방률 측정에 있어BMI
를 대체할 수 있는 비만 선별 도구로 임상에서 쉽게 이용될 수 있을 것으로 기대된다.하지만
RFM
은 유럽계, 멕시코계, 아프리카계 미국인을 대상으로 연 구되어 아시아인에 대한 평가가 필요하다.19) 따라서 본 연구는 건강 증진센터에 방문한 일반 성인을 대상으로BIA
로 측정한TBF percentage
와RFM
을 비교하여 한국인에서RFM
을 적용할 수 있는지 Table 1. Characteristics of study subjectsCharacteristic All (n=7,733)
Male (n=5,282)
Female (n=2,451)
Age (y) 49.5±0.12 48.7±0.14 51.2±0.23
Body weight (kg) 68.2±0.14 73.0±0.15 57.9±0.17
Height (cm) 166.5±0.10 170.8±0.09 157.2±0.11
WC (cm) 83.4±0.11 86.1±0.11 77.6±0.19
BMI (kg/m2) 24.5±0.04 25.0±0.04 23.4±0.07
RFMa 27.4±0.08 24.0±0.05 34.9±0.11
TBF percentage (%)b 27.2±0.08 24.4±0.08 33.3±0.12 Values are presented as mean±standard error.
WC, waist circumference; BMI, body mass index; RFM, relative fat mass; TBF, to- tal body fat.
aRFM equation: female=76-(20×height/WC), male=64-(20×height/WC).
bTBF percentage is measured by bioelectrical impedance analysis.
Table 2. Correlation between TBF percentage and variables
Variable TBF percentage
ra P-valueb
All
BMI 0.471 <0.001
RFM 0.853 <0.001
Male
BMI 0.756 <0.001
RFM 0.808 <0.001
Female
BMI 0.777 <0.001
RFM 0.737 <0.001
TBF, total body fat; BMI, body mass index; RFM, relative fat mass.
aCorrelation coefficient.
bP-values are calculated by partial correlation analysis adjusted by age.
Table 3. Regression analysis between TBF percentage and variables
Variable βa SE P-valueb R2c AR2
All
BMI 0.473 0.022 <0.001 0.224 0.224
RFM 0.860 0.006 <0.001 0.740 0.740
Male
BMI 0.747 0.017 <0.001 0.558 0.558
RFM 0.808 0.012 <0.001 0.653 0.653
Female
BMI 0.798 0.022 <0.001 0.638 0.637
RFM 0.766 0.015 <0.001 0.587 0.587
TBF, total body fat; SE, standard error; AR2, adjusted R2; BMI, body mass index;
RFM, relative fat mass.
aβ: standardized regression coefficient.
bP-values are calculated by regression analysis.
cR2: coefficient of determination.
이미지 외. 한국 성인에서 Relative Fat Mass 공식의 적용 Korean Journal of Family Practice
KJFP
알아보고자 하였다.
본 연구에서는 체지방률 측정을 위해
BIA
를 이용하였다.BIA
는 저비용으로 간편하게 체성분을 측정할 수 있어 널리 사용되는 검사 법이지만, 정확도에 대해서는 논란이 있다.21,22)Sun
등23)의 연구에 의 하면BIA
는adiposity
의 정도에 따라bias
가 발생하는 한계가 있다. 정 상 범위의 체지방률을 가진 사람에서는 비교적 정확하게 체지방률 을 측정할 수 있지만, 마른 사람에서는 체지방률이 높게 측정되고 비만인 사람에서는 낮게 측정되었으며,BIA
로 측정한 체지방률은DXA
로 측정한 값보다 낮은 경향이 있었다.23) 또한BIA
로 측정된 체 지방률은 측정방법이나 기계의 종류에 따라 체중의10
%까지 체지 방률의 측정값이 달라질 수 있다고 알려져 있다.24) 따라서 체지방률 측정에 있어 더 정확하다고 알려진DXA
같은reference method
12,13)와RFM
을 비교한 연구가 필요할 것으로 보인다. 본 연구에서는 총7
,733
명을 전체 대상자, 남성, 여성으로 구분하여 연령을 보정한 편 상관분석을 시행하여BMI
,RFM
이 모두BIA
로 측정한TBF percen
tage
와 유의한 양의 상관관계가 있음을 확인하였다.BMI
와RFM
으 로TBF percentage
를 예측하기 위한 선형 회귀식을 구하기 위해 시행 한 선형 회귀분석에서 남성은RFM
이BMI
보다 표준화계수 및 결정 계수가 더 높았지만, 여성은BMI
가RFM
보다 표준화계수 및 결정계 수가 더 높은 결과를 보였다. 반면 전체 대상자에서는BMI
는 상관 계수 및 결정계수가 크게 감소한 반면RFM
은 더 높은 상관계수 및 결정계수를 보였다. 이는Woolcott
과Bergman
19)의 연구에서 전체 대 상자, 남성, 여성에서RFM
이BMI
보다 더 선형의 관계를 보였으며더 높은
R
2을 가진 것과 비교하였을 때, 전체 대상자와 남성의 경우 일치하였으나 여성의 경우 일치하지 않는 결과를 보였다. 하지만 본 연구에서 여성의 경우RFM
이BMI
보다 낮은 상관계수 및 결정계수 를 가짐에도 불구하고,RFM
은 통계적으로 유의한 높은 상관계수 및 결정계수를(β=0
.766
,R
2=0
.587
,P<0
.001
) 가짐을 보여주었다.BMI
가 같은 경우 여성이 남성에 비해 체지방률이 높다.25,26) 하지만BMI
는 성별에 따른 차이 없이 키와 체중만으로 계산되기 때문에 전체 대상자에서는BMI
와TBF percentage
의 상관성 및 결정계수가 저하 되는 것으로 보여진다. 따라서BMI
와TBF percentage
의 일치도는 성 별에 따른 차이가 생길 수 밖에 없으며, 본 연구 대상자에서BMI
와TBF percentage
의MD
는 남자는0
.596
(SD
:3
.845
)이지만 여자는-9
.851
(SD
:3
.981
)로 크게 나타났고 이것은 여성에서bias
가 큰 것을 의미한다. 이는BMI
로 체지방률을 평가하는 것에는 한계가 있다는 이전 연구들과 일치한다.9,25) 반면에RFM
의 경우MD
는 남성에서-0
.419
, 여성에서1
.620
이었고,Bland-Altman plot
에서95
%LoA
에 대 부분의 측정값들이 분포하여RFM
과TBF percentage
의 높은 일치도 를 보였으며, 이것은Woolcott
과Bergman
19)의 연구와 일치한다.RFM equation
은 아시아인에서 적용할 수 있을지에 대한 평가가 필요하기에, 본 연구는 비교적 많은 수(n=7
,733
)의 한국 성인을 대상 으로 하여BIA
로 측정한TBF percentage
를RFM
식을 통해 계산한 값으로 대체할 수 있는지 알아보았으며,Bland-Altman plot
을 통해 그 일치도를 평가하였고 남성과 여성 모두95
%LoA
범위 내에 대부 분의 측정값들이 분포하는 것을 확인한 것에 의의가 있다.10
-10 -20
Differences
0
A
B
40 10
0 -10 -20
Differences
Male
Female
10 20 30 40
20
20 30 50
Average RFM and TBF percentage (%) Average RFM and TBF percentage (%)
Figure 1. Bland-Altman plot: showing the agreement between RFM and TBF percentage, as measured by BIA. The X-axis indicates the average RFM and TBF percentages The y-axis indicates the difference between RFM-TBF per- centage. The MD was -0.419 in male and 1.620 in female. The upper limit of the agreement was 6.078 in male and 9.362 in female. The lower limit of the agreement was -6.915 in male and -6.122 in female. Limits of agreement are calculated as MD±1.96×SD of the difference.
RFM, relative fat mass; TBF, total body fat; BIA, bioelectrical impedance analy- sis; MD, mean difference; SD, standard deviation.
Mi Ji Lee, et al. Application of Relative Fat Mass Equation in Korean Adults
Korean Journal of Family Practice
KJFP
본 연구는 몇 가지 제한점을 가진다. 첫째, 체지방률 측정을 위해 사용한
BIA
는 앞에서 언급한 것처럼 정확도에 논란이 있다.21,22) 따라 서 체지방률 측정에 있어 더 정확하다고 알려진DXA
같은reference method
12,13)와RFM
을 비교한 연구가 필요할 것으로 보인다. 둘째, 한 국인만을 대상으로 하여 전체 아시아인을 대변하는 것에는 한계가 있다. 셋째, 본 연구는 한국 성인만을 대상으로 이루어져 전체 연령 에 적용시킬 수 없다는 제한점이 있다. 추후 소아청소년을 포함한 연구가 필요할 것이다. 넷째, 본 연구는 비교적 많은 수의 대상자를 연구에 포함시켰지만,RFM
을 일반화시키기 위해서는 국민건강영양 조사 같은 큰 표본을 이용한 대규모 연구가 이루어져야 할 것이다.마지막으로, 본 연구는 한국인에서
RFM
이TBF percentage
를 평가하 는데 이용될 수 있는가에 국한된 연구이며, 비만 진단 도구로써의RFM
평가를 포함하지 않았다. 따라서RFM
이 비만 진단을 위해 임 상적으로 이용되기 위해서는 몇 가지 연구들이 선행되어야 한다.WHO
에서 체지방률에 대한reference standard
를 제시하였지만,6) 아 직까지 체지방률로 정의하는 비만 진단의 기준이 되는 일치된cut- off
는 존재하지 않는다.27,28) 따라서 체지방률로 정의되는 비만의 진 단을 위한gold standard
가 우선 설립되어야 할 것이다. 또한 비만 진 단 도구로써RFM
이 다른 지표들을 대체하여 사용되기 위해서는 비 만 진단의 민감도 및 특이도에 대해 다른 비만 지표들과의 비교가 필요하다.Woolcott
과Bergman
19)은 체지방률로 정의되는 비만의 진 단에 있어RFM
이BMI
보다 더 나은 정확도를 보였고 위음성이 더 낮았으며, 비만의 오진율을 줄여준다고 보고하였다. 하지만 이는 아 시아인은 포함되지 않은 연구로RFM
이 다른 비만 지표들 대신 사 용되기 위해서는 다양한 인종과 연령을 대상으로 비만 진단의 민감 도 및 특이도에 대해 다른 비만 지표들과 비교한 연구가 필요할 것 이다.결론적으로 본 연구에서는 한국 성인에서
RFM
과BIA
로 측정한TBF percentage
는 높은 일치도를 보였으며, 이는 한국 성인에서RFM
이TBF percentage
를 예측하는데 이용될 수 있음을 보여주었다. 하지 만 비만 선별 도구로써 임상적으로RFM
이 이용되기 위해서는 체지 방률로 정의되는 비만 진단의criteria
가 필요하며, 다른 아시아인과 전 연령에서의RFM
적용에 대한 평가 및 다양한 인종에서 비만 진 단의 정확도에 대한 대규모 연구가 필요하다.요 약
연구배경: 체질량지수(
body mass index
,BMI
)는 체지방률 및 체지방 분포를 확인하는데 한계가 있으며, 체지방률로 정의하는 비만의 분 류 오류를 일으킨다. 높은 체지방률은 여러 질환 및 사망과 관련이있기 때문에 체지방률을 정확히 평가하는 것은 임상적으로 중요하 게 여겨진다. 최근 미국의
Woolcott
과Bergman
은 키와 허리둘레로 체지방률을 계산하는relative fat mass
(RFM
) 공식을 발표하였다. 그 러나RFM
은 유럽계, 멕시코계, 아프리카계 미국인을 대상으로 연구 되어 아시아인에 대한 평가가 필요하다. 따라서 본 연구는 한국 성 인에서RFM
적용 가능성에 대해 알아보고자 한다.방법:
2016
년5
월부터2018
년11
월12
일까지 건강증진센터에 내원한7
,733
명의 성인을 대상으로 하였고 키, 체중, 허리둘레를 측정하여BMI
,RFM
을 계산한 뒤bioelectrical impedance analysis
(BIA
)로 측정 한 체지방률과 비교하여 한국인에서RFM
적용 가능성을 평가하였 다.결과: 남녀 모두에서
RFM
은total body fat
(TBF
)percentage
와 통계적 으로 유의한 상관관계를 가졌다(남: β=0
.808
,R
2=0
.653
, 여: β=0
.766
,R
2=0
.587
,P<0
.001
).Bland-Altman plot
에서RFM
은TBF percentage
와95
%limits of agreement
내에서 좋은 일치도를 보였다.결론: 한국 성인에서
RFM
공식은TBF percentage
를 예측하는 도구 로써 이용될 수 있다.중심단어: 비만; 체질량지수; 체지방
CONFLICT OF INTEREST
No potential conflict of interest relevant to this article was reported
. ORCIDMi Ji Lee
,http
://orcid
.org
/0000-0002-2763-5079 Young Hye Kim
,http
://orcid
.org
/0000-0001-5162-3994 Jin Gu Kim
,http
://orcid
.org
/0000-0002-4289-6816 Seon Yeong Lee
,http
://orcid
.org
/0000-0002-8274-3654 Kyunam Kim
,http
://orcid
.org
/0000-0003-4168-4616 Jongwoo Kim
,http
://orcid
.org
/0000-0001-7317-8748 Jeong Ki Paek
,http
://orcid
.org
/0000-0002-5837-0106
REFERENCES
1. WHO. Obesity and overweight [Internet]. Geneva: World Health Organiza- tion; c2017 [cited 2019 Jan 2]. Available from: http://www.who.int/media- centre/factsheets/fs311/en/.
2. Guh DP, Zhang W, Bansback N, Amarsi Z, Birmingham CL, Anis AH. The incidence of co-morbidities related to obesity and overweight: a systematic review and meta-analysis. BMC Public Health 2009; 9: 88.
이미지 외. 한국 성인에서 Relative Fat Mass 공식의 적용 Korean Journal of Family Practice
KJFP
3. Shapiro CL. Cancer survivorship. N Engl J Med 2018; 379: 2438-50.
4. Nazare JA, Smith J, Borel AL, Aschner P, Barter P, Van Gaal L, et al.; INSPIRE ME IAA Investigators. Usefulness of measuring both body mass index and waist circumference for the estimation of visceral adiposity and related car- diometabolic risk profile (from the INSPIRE ME IAA study). Am J Cardiol 2015; 115: 307-15.
5. Ashwell M, Gibson S. Waist-to-height ratio as an indicator of 'early health risk': simpler and more predictive than using a 'matrix' based on BMI and waist circumference. BMJ Open 2016; 6: e010159.
6. Physical status: the use and interpretation of anthropometry. Report of a WHO Expert Committee. World Health Organ Tech Rep Ser 1995; 854:
1-452.
7. Rothman KJ. BMI-related errors in the measurement of obesity. Int J Obes (Lond) 2008; 32 Suppl 3: S56-9.
8. Hung SP, Chen CY, Guo FR, Chang CI, Jan CF. Combine body mass index and body fat percentage measures to improve the accuracy of obesity screening in young adults. Obes Res Clin Pract 2017; 11: 11-8.
9. Romero-Corral A, Somers VK, Sierra-Johnson J, Thomas RJ, Collazo- Clavell ML, Korinek J, et al. Accuracy of body mass index in diagnosing obesity in the adult general population. Int J Obes (Lond) 2008; 32: 959-66.
10. Heitmann BL, Erikson H, Ellsinger BM, Mikkelsen KL, Larsson B. Mortality associated with body fat, fat-free mass and body mass index among 60-year- old Swedish men-a 22-year follow-up. The study of men born in 1913. Int J Obes Relat Metab Disord 2000; 24: 33-7.
11. Lahmann PH, Lissner L, Gullberg B, Berglund G. A prospective study of ad- iposity and all-cause mortality: the Malmö Diet and Cancer Study. Obes Res 2002; 10: 361-9.
12. Slosman DO, Casez JP, Pichard C, Rochat T, Fery F, Rizzoli R, et al. Assess- ment of whole-body composition with dual-energy x-ray absorptiometry.
Radiology 1992; 185: 593-8.
13. Mazess R, Collick B, Trempe J, Barden H, Hanson J. Performance evaluation of a dual-energy x-ray bone densitometer. Calcif Tissue Int 1989; 44: 228- 32.
14. Habib SS. Body mass index and body fat percentage in assessment of obesi- ty prevalence in Saudi adults. Biomed Environ Sci 2013; 26: 94-9.
15. Lean ME, Han TS, Deurenberg P. Predicting body composition by densi- tometry from simple anthropometric measurements. Am J Clin Nutr 1996;
63: 4-14.
16. Stevens J, Ou FS, Cai J, Heymsfield SB, Truesdale KP. Prediction of percent
body fat measurements in Americans 8 years and older. Int J Obes (Lond) 2016; 40: 587-94.
17. Gómez-Ambrosi J, Silva C, Catalán V, Rodríguez A, Galofré JC, Escalada J, et al. Clinical usefulness of a new equation for estimating body fat. Diabetes Care 2012; 35: 383-8.
18. Chambers AJ, Parise E, McCrory JL, Cham R. A comparison of prediction equations for the estimation of body fat percentage in non-obese and obese older Caucasian adults in the United States. J Nutr Health Aging 2014; 18:
586-90.
19. Woolcott OO, Bergman RN. Relative fat mass (RFM) as a new estimator of whole-body fat percentage - a cross-sectional study in American adult indi- viduals. Sci Rep 2018; 8: 10980.
20. Bland JM, Altman DG. Statistical methods for assessing agreement between two methods of clinical measurement. Lancet 1986; 1: 307-10.
21. Lukaski HC, Siders WA. Validity and accuracy of regional bioelectrical im- pedance devices to determine whole-body fatness. Nutrition 2003; 19: 851- 7.
22. Bolanowski M, Nilsson BE. Assessment of human body composition using dual-energy x-ray absorptiometry and bioelectrical impedance analysis.
Med Sci Monit 2001; 7: 1029-33.
23. Sun G, French CR, Martin GR, Younghusband B, Green RC, Xie YG, et al.
Comparison of multifrequency bioelectrical impedance analysis with dual- energy X-ray absorptiometry for assessment of percentage body fat in a large, healthy population. Am J Clin Nutr 2005; 81: 74-8.
24. Bioelectrical impedance analysis in body composition measurement: Na- tional Institutes of Health Technology Assessment Conference Statement.
Am J Clin Nutr 1996; 64(3 Suppl): 524S-32S.
25. Gallagher D, Visser M, Sepúlveda D, Pierson RN, Harris T, Heymsfield SB.
How useful is body mass index for comparison of body fatness across age, sex, and ethnic groups? Am J Epidemiol 1996; 143: 228-39.
26. ackson AS, Stanforth PR, Gagnon J, Rankinen T, Leon AS, Rao DC, et al. The effect of sex, age and race on estimating percentage body fat from body mass index: the Heritage Family Study. Int J Obes Relat Metab Disord 2002;
26: 789-96.
27. Ho-Pham LT, Campbell LV, Nguyen TV. More on body fat cutoff points.
Mayo Clin Proc 2011; 86: 584; author reply 584-5.
28. Oreopoulos A, Lavie CJ, Snitker S, Romero-Corral A. More on body fat cut- off points-reply-I. Mayo Clin Proc 2011; 86: 584-5.