• 검색 결과가 없습니다.

Performance evaluation of sea water heat exchanger installed in the submerged bottom-structure of floating architecture

N/A
N/A
Protected

Academic year: 2021

Share "Performance evaluation of sea water heat exchanger installed in the submerged bottom-structure of floating architecture"

Copied!
6
0
0

로드 중.... (전체 텍스트 보기)

전체 글

(1)

J. Korean Soc. of Marine Engineering (JKOSME) ISSN 2234-8352 (Online)

http://dx.doi.org/10.5916/jkosme.2015.39.10.1062 Original Paper

†Corresponding Author (ORCID: http://orcid.org/0000-0003-4850-3558): Division of Mechanical Engineering, Korea Maritime and Ocean University, 727, Taejong-ro, Yeongdo-gu, Busan, 49112, Korea, E-mail: [email protected], Tel:051-410-4368

1 Department of Energy Plant Engineering, Graduate School, Korea Maritime and Ocean University, E-mail: [email protected], Tel: 051-410-5030

Performance evaluation of sea water heat exchanger installed in the submerged bottom-structure of floating architecture

Young-Hoon Sim 1 ․ Kwang-Il Hwang

(Received October 30, 2015; Revised December 4, 2015;Accepted December 17, 2015)

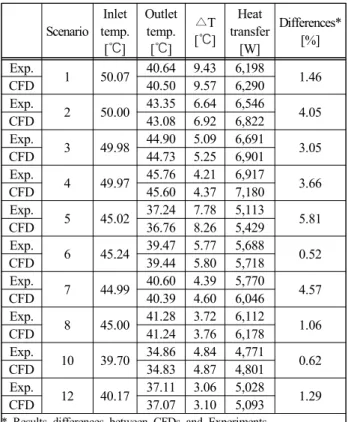
Abstract: Floating architecture is a type of building that is geographically located on a sea or a river. It floats under the influence of buoyancy, and does not have an engine for moving it. Korea is a peninsula surrounded by sea except on the north side, so floating architectures have been mainly focused on two points: solving the issue of small territory and providing various leisure & cultural spaces. Floating architectures are expected to save energy effectively, if they use sea water heat, which is known to be clean energy with infinite reserves. To use sea water heat as the heat source and/or heat sink, this study proposes a model in which a sea water heat exchanger is embedded in the concrete structure in the lower part of the floating architecture that is submerged under the sea. Based on the results of performance evaluations of the sea water heat exchanger using CFD (computational fluid dynamics) analysis and mock-up experiments under various conditions, it is found out that the temperature difference between the inlet and outlet of the heat exchanger is in the range of 3.06~9.57 °C, and that the quantity of heat transfer measured is in the range of 3,812~7,180 W. The CFD evaluation results shows a difference of 5% with respect to the results of mock-up experiment.

Keywords: Floating architecture, Sea water heat exchanger, Energy saving, Computational fluid dynamics, Mock-up experiment

Nomenclature

 : Time [s]

: Mixture density [kg/m³]

: Mass-average velocity [m/s]

 : Pressure [Pa]

: Viscosity of the mixture [Pa-s]

 : Temperature [℃]

 : Acceleration of gravity [m/s²]

 : Body force [N]

 : Number of phases

: Volume fraction of phase k

 : Drift velocity for secondary phase k [m/s]

: Density for phase k [kg/m³]

: Total energy for phase k [J]

 : Effective conductivity [W/m-k]

: Volumetric heat sources [J/m³]

1. Introduction

Floating architectures refer to buildings constructed over floating pontoons [1], and are clearly differentiated from ships, which have motor power for sailing. Floating architectures are recognized worldwide as a very important building type to

solve issues such as rising sea level and coastal floods induced by global warming. Moreover, Korea is a peninsula, because of which the coastline is very long compared to its land area.

Therefore, the marine space and coastal areas have high development potential, and floating architectures have been of interest for decades [2].

Figure 1: Floating Island (Sevit) [1]

To solve the global warming issue, there is a sense of

urgency to develop carbon emission reduction technology. In

the case of floating architectures, because there are various

renewable energies around the floating architectures, it is

(2)

necessary to develop the carbon emission reduction technology based on sea-related renewable energies, such as sea water heat, solar energy, solar heat, and wind power energy. Among them, sea water heat is known to be clean energy with infinite reserves, and can be used for 24 hours continuously, unlike wind power and solar energy, which change according to time and weather conditions. For this reason, if sea water heat is applied to floating architectures as cooling and heating sources for 24-hour loads, it is expected to increase the energy saving effect further.

There are very few fundamental research work [3]-[7] on the use of sea water heat exchanger (hereafter, referred as SWHE) for floating architectures, and most of the conventional SWHEs are installed as piles or structures on the seafloor. However, it is impossible to apply conventional SWHEs to floating architectures, because the floating architectures are basically floating by the sea by buoyancy, and can be moved [8].

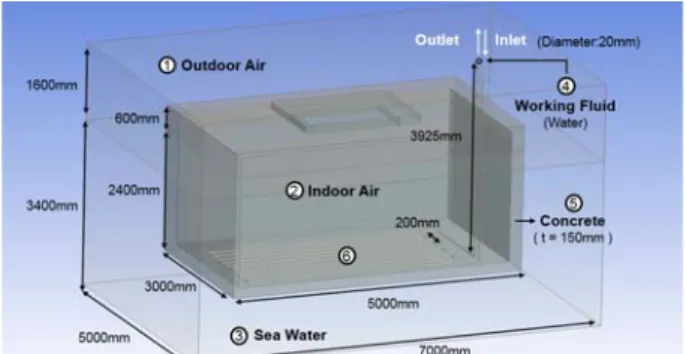
The purpose of this study is to propose a new type of SWHE system to save energy, considering the floating and movable characteristics of floating architectures. To evaluate the performance of the proposed system, CFD analysis and mock-up experiments were conducted in this study, and the results were compared.

2. Numerical Analysis and Result 2.1 Theoretic background

To analyze the heat transfer performance of SWHE, continuity Equation (1), momentum Equation (2), and energy Equation (3) are applied.

1) Continuity equation

 

    ∇∙     (1)

2) Momentum equation

 

      ∇∙       ∇ ∇∙ ∇ 

 ∇ 

        ∇∙         

(2)

3) Energy equation

 

  

   ∇∙        

 ∇∙  ∇    

(3)

2.2 Modeling and boundary conditions

To predict the heat exchange performance of the proposed system, FLUENT [9]-[13], which is a commercial software program for heat transfer analysis, was used. As simulation conditions, k-ε turbulence model and SIMPLE algorithm for momentum equation were applied [14].

Figures 2 and 3 show the structures of the SWHE system proposed in this study. The outline of the numerical analysis model is presented in Table 1. The numerical analysis modeling is categorized into five areas to design the grid system: ①outdoor air, ②indoor air, ③sea water, ④working fluid inside the SWHE, and ⑤concrete in which the SWHE is embedded. The material of the SWHE is copper, and the pipe diameter is set to 20 mm. For reference, the embedding location of the proposed SWHE is area ⑥.

Figure 2: Sea water heat exchanger modeling

Figure 3: Vertical section of modeling

Table 1: Outline of the model

Analysis size [mm] 5,000 × 7,000 × 5,000

Diameter [mm] 20

Mesh Count 4,200,000

Mesh Type Tetra & Prism

Because the sea water around Korea does not freeze in winter, city water is used as the working fluid in the SWHE.

Further, it is assumed that phase change does not occur during

(3)

the process of heat transfer. The flow coming from the inlet of the SWHE is allowed to go out completely to the outlet without any leakage, in order to satisfy the law of conservation of mass in the all the analysis areas.

Table 2 presents the initial conditions for numerical analysis, including the inflow temperature and flow velocity of the working fluid in the SWHE, the temperature and flow velocity of sea water, and the temperature of outdoor air. The parts of the SWHE exposed to outdoor air are assumed to be insulated to minimize heat loss. In addition, the properties of materials used in each area are listed in Table 3.

Table 2: Velocity & temperature conditions on boundary Boundary condition Working fluid

(Water) Sea Air

Inlet temperature [℃] 40, 45, 50 14.0 20.0 Flow velocity [m/s] 0.5, 0.75, 1.00,

1.25 0.1~2.0 -

Table 3: Properties of the material used in the simulation

Water Air Concrete Copper

   998.2 1.225 2,400 8,978

   ∙   4,182 1,006.4 880 381

    ∙   0.6 0.0242 2.5 387.6

2.3 Numerical analysis results

When the inflow temperature of the working fluid coming to the SWHE is set to 50 °C and the flow velocity is set to 0.5 m/s, the outlet temperature is expected to be 40.16 °C. It means that the temperature difference between the inlet and the outlet is 9.84 °C and that the quantity of heat transfer is 5,175 W. Figure 4 shows the temperature distribution obtained from numerical analysis under the previously mentioned conditions. On the other hand, when the inflow temperature of the working fluid is set to 50 °C but the flow velocity set is changed to 1.25 m/s, the outlet temperature is measured as 45.57 °C. It also means that the temperature difference between the inlet and the outlet is 4.43 °C, and that the quantity of heat transfer is 5,818 W.

Including above mentioned results, the results of SWHE’s performance predicted by numerical analysis are displayed in Figure 5, where the solid line represents the temperature difference between the inlet and the outlet, and the dotted line represents the quantity of heat transfer. From these results, it is clear that, if the flow velocity of the working fluid inside the SWHE is higher, the temperature difference between the inlet and the outlet of the SWHE is smaller, and the quantity of heat transfer is higher.

Figure 4: Temperature distribution (50℃, 0.5m/s)

Figure 5: CFD analysis results

3. Mock-up experiment and results 3.1 Overview of mock-up experiment

To build a mock-up, the same size and shape that were used for the numerical analysis described earlier were used.

Figure 6 shows the shape of the mock-up of the SWHE that was embedded on the concrete pontoon floor.

Figure 6: External appearance of pipe & thermocouple

Figure 7 shows the land utility section, which has mainly

two functions: heat load generation and flow control to the

SWHE. The land utility section consists of an electric boiler

that generates heat load for the working fluid, a circulation

pump to circulate the working fluid, an electromagnetic

flowmeter, a computer, a data logger, etc. A thermocouple was

used to measure 15 parameters including the temperatures of

sea water, boiler, inlet and outlet of sea water heat exchanger,

outdoor air, and the flow velocity of the working fluid in the

pipe. The temperature data were obtained every 5 second and

(4)

were programmed for monitoring on the PC through the data acquisition system [15].

Figure 7: External appearance of boiler & control part

The mock-up experiment was conducted as per the conditions listed in Table 4; these are the same conditions that were used in the numerical analysis. In other words, the inflow temperature of the working fluid was set to 40 °C, 45

°C, and 50 °C, and the flow velocity was set to 0.50 m/s, 0.75 m/s, 1.00 m/s, and 1.25 m/s. Therefore, a set of 12 experimental scenarios was prepared for experiments.

Table 4: Experimental scenarios

Scenario Inlet temperature [℃] Flow velocity [m/s]

1

50

0.50

2 0.75

3 1.00

4 1.25

5

45

0.50

6 0.75

7 1.00

8 1.25

9

40

0.50

10 0.75

11 1.00

12 1.25

To ensure the reliability of the experimental results, each scenario was conducted four times for 27 days from April 23 to May 19, 2015.

3.2 Overview of experimental site

Because the floating architectures are normally situated in the marine still water zone [8], the experimental system for this study was installed in a yacht mooring area in Korea Maritime and Ocean University, where the most still sea water flow occurs among the neighboring sea water zones around the university.

Figure 8 shows the installation location of the experimental system.

As displayed in Figure 9, the installed mock-up experiment system had a sea section that was floating on the sea and a

land section that controlled the whole system. The sea section was made of concrete pontoon, and the SWHE was embedded in the lower part of the submerged pontoon.

Figure 8: Location of experimental system (white circle) at campus of KMOU[16]

Figure 9: Mock-up system

3.3 Results of mock-up experiments

To minimize the influence of instantaneously changing values, mean values of every 20 min duration were used to evaluate and analyze the performance. Table 5 and Figure 10 show the measured results in each scenario. In Figure 10, the temperature difference between the inlet and the outlet in each scenario is shown with a solid line, and the quantity of heat transfer is shown with a dotted line. In the experimental period, the temperature of sea water was 14~16 °C, and the temperature of outdoor air was 16~28 °C. Thus, the outdoor air temperature was not stable; however, it is found out that its influence is very small.

Table 5: Experimental results (Average) Scen-ario

Inlet temp.

[℃]

Sea temp.

[℃]

Air temp.

[℃]

Outlet temp.

[℃]

△ T [℃]

Heat transfer

[W]

1 50.07 15.08 18.20 40.64 9.43 4,958

2 50.00 14.34 24.64 43.35 6.64 5,245

3 49.98 15.07 23.30 44.90 5.09 5,342

4 49.97 14.41 22.31 45.76 4.21 5,533

5 45.02 14.83 17.32 37.24 7.78 4,091

6 45.24 15.37 23.08 39.47 5.77 4,551

7 44.99 14.44 22.24 40.60 4.39 4,616

8 45.00 14.36 23.53 41.28 3.72 4,890

10 39.70 14.66 16.88 34.86 4.84 3,579

12 40.17 14.95 22.40 37.11 3.06 4,022

(5)

Figure 10: Experimental results

The maximum temperature difference (9.43 °C) between the inlet and the outlet occurred in scenario (1), as shown in Figure 11, where inflow temperature was 50 °C and the flow velocity in the pipe was 0.5 m/s; the maximum quantity of heat transfer (5,533 W) was obtained in scenario (4) as shown in Figure 12, where the flow velocity in the pipe is increased to 1.25 m/s with the same inflow temperature. The experimental results for the various scenarios show that, for a similar temperature at the inlet, as the flow velocity in pipe is increased, the temperature difference between the inlet and the outlet decreased, but the overall quantity of heat exchange increased. In Table 5, the results of scenario (9) and scenario (11) are not listed, because the data obtained from the repeated experiments were not stable.

Figure 11: Temperature variation for scenario(1) (Working fluid inlet temperature 50 ℃, Inflow velocity 0.5m/s, 30 th April)

Figure 12: Temperature variation for scenario(4) (Working fluid inlet temperature 50 ℃, Inflow velocity 1.25m/s, 25 th April)

3.4 Comparison of results of experiment and CFD analysis

To compare the differences in performance obtained from CFD analysis and experiments, the CFD analysis was conducted again with the actual input conditions that were measured during the experiments under the each scenario. The results of the mock-up experiments and CFD conducted with actual input conditions are summarized in Table 6.

Comparing the results of the experiments and the CFD analysis, it can be seen that the temperature differences are within 0.3 °C, and that the differences in the quantities of heat exchange are within 300 W. It means that the differences in performance between the experiments and the CFD analysis results are mostly within 5%.

Table 6: Compare with experiment results and CFD analysis results

Scenario Inlet temp.

[℃]

Outlet temp.

[℃]

△T [℃]

Heat transfer

[W]

Differences*

[%]

Exp. 1 50.07 40.64 9.43 6,198 1.46

CFD 40.50 9.57 6,290

Exp. 2 50.00 43.35 6.64 6,546

CFD 43.08 6.92 6,822 4.05

Exp. 3 49.98 44.90 5.09 6,691 3.05

CFD 44.73 5.25 6,901

Exp. 4 49.97 45.76 4.21 6,917

CFD 45.60 4.37 7,180 3.66

Exp. 5 45.02 37.24 7.78 5,113 5.81

CFD 36.76 8.26 5,429

Exp. 6 45.24 39.47 5.77 5,688

CFD 39.44 5.80 5,718 0.52

Exp. 7 44.99 40.60 4.39 5,770 4.57

CFD 40.39 4.60 6,046

Exp. 8 45.00 41.28 3.72 6,112

CFD 41.24 3.76 6,178 1.06

Exp. 10 39.70 34.86 4.84 4,771 0.62

CFD 34.83 4.87 4,801

Exp. 12 40.17 37.11 3.06 5,028

CFD 37.07 3.10 5,093 1.29

* Results differences between CFDs and Experiments

5. Conclusions

Floating architecture has been used for decades in Korea,

accompanying with the leisure needs increases near oceans or

rivers where permanent and plenty of reusable energy is

available. Considering the floating and movable characteristics

of floating architectures, an SWHE is proposed; the SWHE is

embedded in the concrete structure in the lower part of the

floating architecture that is submerged under the sea, to use

sea water heat as heat source and/or heat sink. The results are

(6)

summarized as follows.

From the performance experiments which were conducted repeatedly, the temperature differences between the inlet and the outlet of the SWHE were found to be in the range of 3.06~9.57 °C, and the heat transfer quantity was in the range of 3,812~7,180 W depending on the scenario. Further, it is clear that the temperature differences between the inlet and the outlet increases as the flow velocity decreases. However, the quantity of heat transfer is in proportion to the flow velocity of the working fluid inside the SWHE.

Finally, it can be judged that the fundamental design methodology is secured, because the difference in the results between mock-up experiments and CFD analysis are mostly within 5%.

Acknowledgements

This work was supported by the Local technology Renovation Program funded by the Ministry of Land, Transport and Maritime Affairs (No. 10 - local technology renovation - B01).

References

[1] C. H. Moon, “Sailing of research group on floating architecture,” Journal of the Architectural Institute of Korea, vol. 55, no. 09, pp. 14-19, 2011 (in Korean).

[2] H. S. Lee, C. H. Moon, and Y. H. Kang, “An analysis of market situation and industry trend in floating architecture,” Proceedings of the Korean Institute of Navigation and Port Research Conference, pp. 141-144, 2009 (in Korean).

[3] B. Kim, C. H. Lee, J. H. Koo, and K. I. Hwang, “ Performance evaluation of types of sea water heat exchanger for floating architecture,” Proceedings of the Korean Institute of Navigation and Port Research Conference, pp. 287-288, 2013 (in Korean).

[4] K. I. Hwang and Y. H. Sim, “CFD analysis on performance evaluation of sea water heat exchanger in floating architecture,” Proceedings of the Korean Society of Marine Engineering, pp. 211, 2014 (in Korean).

[5] K. C. Kim and S. Lee, “A new method to convert into seawater heat for the indoor air-conditioning resource,” Journal of the Korean Society of Marine Engineering, vol. 29, no. 08, pp. 883-890, 2005 (in Korean).

[6] K. C. Kim, A Study on Heat Gain from Seawater for Cooling of Buildings, Ph.D. Dissertation, Department

of Architectural Engineering, Dong-Eui University, Korea, 2006 (in Korean).

[7] H. J. Kim, H. S. Lee, J. I. Yoon, C. H. Son, and Y, K. Jung, “A numerical study on heat transfer and pressure drop of plate heat exchanger using at seawater air conditioning with the variation of channel spaces,” Journal of the Korean Society of Marine Engineering, vol. 38, no. 06, pp. 704-709, 2014 (in Korean).

[8] Y. W. Lee, Y. Y. Kim, and S. K, Song, “Recent floating buildings and design methods,” Journal of the Wind Engineering Institute of Korea, vol. 16, no. 04, pp. 79-87, 2012 (in Korean).

[9] J. Yang and W. Liu, “Numerical investigation on a novel shell-and-tube heat exchanger with plate baffles and experimental validation,” Journal of the Energy Conversion and Management, vol. 101, pp. 689-696, 2015.

[10] A. N. Asadolahi, R. Gupta, S. S. Y. Leung, D. F.

Fletcher, and B. S. Haynes, “Validation of a CFD model of taylor flow hydrodynamics and heat transfer,” Journal of the Chemical Engineering Science, vol. 69, no. 1, pp. 541-552, 2012.

[11] L. Zhao and J. K. Yoon, “A study on heat transfer and pressure drop characteristics of plain fin-tube heat exchanger using CFD analysis,” Journal of the Korean Society of Marine Engineering, vol. 38, no.

06, pp. 615-624, 2014 (in Korean).

[12] R. R. Hou, H. S. Park, J. K. Yoon, and J. H. Lim,

“Numerical analysis for heat transfer and pressure drop characteristics of “Shell-tube” heat exchanger with various baffle factor,” Journal of the Korean Society of Marine Engineering, vol. 38, no. 04, pp.

367-375, 2014 (in Korean).

[13] S. H. Kwag, “Numerical analysis of turbulent flows in the helically coiled pipes of heat transfer,” Journal of the Korean Society of Marine Engineering, vol.

37, no. 08, pp. 905-910, 2013 (in Korean).

[14] F. Incropera and D. Dewitt, Introduction to Heat Transfer, 4th ed., Wiley, 2001.

[15] Yokogawa Electric Corporation, MX100/MW100 Data Acquisition Unit Installation and Connection Guide, 2005.

[16] Daum, http://map.daum.net, Accessed July 15, 2015.

수치

Figure  1:  Floating  Island  (Sevit)  [1]
Figure  2:  Sea  water  heat  exchanger  modeling
Figure  8:  Location  of  experimental  system  (white  circle)  at  campus  of  KMOU[16]
Figure  11:  Temperature  variation  for  scenario(1)  (Working  fluid  inlet  temperature  50 ℃,  Inflow  velocity  0.5m/s, 30 th   April)

참조

관련 문서

24 Comparison between profiles of acoustic pressure and heat transfer augmentation in case of output power level of 300W.. 25 Comparison between profiles of acoustic pressure

This study the changes in structure and mechanical characteristics by the analysis on mechanical characteristics of the welding part and the post weld

A Study on Heat Dissipation Design and Performance Evaluation of Lithium-ion Battery Pack for Automated Logistics Robot Using Infrared Thermal Imaging

To find out the main features of the heat exchange from the interaction between atmosphere and sea, this thesis covers the meterological property and

S., An Experimental Study on the Cooling and Heating Performance of a Residential Ground Source Heat Pump System, Korean Journal of Air-Conditioning

To visualize the vari- ation in various transport characteristics (the non-dimen- sional axial velocity and temperature distributions, pressure gradient, rate of heat

A PID control with Feedfoward Controller for Controlling Fluid Temperature in Heat Exchanger.. 지도교수

• Heat conduction with a electrical heat source, a nuclear heat source, a viscous heat source, and a chemical heat source.. • Heat conduction