Copyright © 2016 The Korean Society for Bone and Mineral Research
This is an Open Access article distributed under the terms of the Creative Commons Attribution Non-Commercial Li- cense (http://creativecommons.org/licenses/by-nc/3.0/) which permits unrestricted non-commercial use, distribu- tion, and reproduction in any medium, provided the original work is properly cited.
pISSN 2287-6375 eISSN 2287-7029
Relationship between Serum Inflammatory Marker and Bone Mineral Density in Healthy Adults
Hee-Sook Lim1,2, Yoon-Hyung Park1, Soon-Kyung Kim3
1Department of Preventive Medicine, Soonchunhyang University College of Medicine, Cheonan;
2Department of Clinical Nutrition, Soonchunhyang University Bucheon Hospital, Bucheon;
3Department of Food Sciences & Nutrition, Soonchunhyang University, Asan, Korea
Background: Inflammatory markers have been shown to play an important role in bone remodeling. The purpose of this study was to investigate the relationship among serum C-reactive protein (CRP), adiponectin, tumor necrosis factor-alpha (TNF-α) and bone health in healthy adults. Methods: We measured serum levels of CRP, adiponectin, TNF-α as well as lumbar spine and femoral neck bone mineral density (BMD) in 76 adults. An- thropometric measurements and nutrient intake survey of participants were carried out.
The participants were divided into two groups (normal BMD group=40; 52.6%, decreas- ed BMD group=36; 47.4%). Results: The CRP concentration was significantly higher in the decreased BMD group. The adiponectin concentration was lower in the decreased BMD group but the difference was not significant. The TNF-α concentration was higher in the decreased BMD group, the difference was not significant. The participants in the decreas ed BMD group were found to have lower calcium intakes. The sodium intake of the decreased BMD group was significantly higher. The BMD in the decreased BMD group show ed inverse correlations with CRP and dietary sodium intake. Conclusions: Serum CRP and dietary sodium intake is associated with BMD. Further research is needed to confirm the potential role of inflammatory marker to modulate the effects on bone.
Key Words: Adiponectin, Bone Density, C-reactive protein, Nutritional status
INTRODUCTION
Owing to the recent increases in the average human life expectancy, the public interest in health has been increasing and efforts to lead healthy life and prevent diseases. In particular, with the increase in the elderly population, the prevalence rates and costs of treatment of osteoporosis and fracture have greatly increased.
The prevalence of osteoporosis, according to the 2012 Korea National Health and Nutrition Examination Survey, is 34.9% in females and 7.8% in males, and the num- bers have been increasing every year. Moreover, considering that the risk of frac- ture shows a 1.73-fold increase not only in osteoporosis but also in osteopenia, active efforts to prevent osteopenia are required.[1] The highest bone mineral content is formed during the second and third decades of life, and bond loss spon- taneously occurs with aging afterward.[2] Various factors, including hormones, nutritional intake of calcium and protein, physical activities, medication use, and smoking, are known to influence the formation and maintenance of bone.[3]
Corresponding author Soon-Kyung Kim
Department of Food Sciences & Nutrition, Soonchunhyang University,
22 Soonchunhyang-ro, Sinchang-myeon, Asan 31538, Korea
Tel: +82-41-530-1261 Fax: +82-41-530-1264 E-mail: [email protected]
Received: February 9, 2016 Revised: February 17, 2016 Accepted: February 17, 2016
No potential conflict of interest relevant to this article was reported.
This work was supported by the Soonchunhyang University Research Fund.
The authors wish to thank Eun-Ae Jung librarian and Bora Lee biostatistic consultant who assisted in manuscript editing and statistical advice.
Original Article
Moreover, in order to elucidate the mechanism of correla- tion of bone mineral density (BMD) with obesity, body fat mass,[4] diabetes,[5] and metabolic diseases,[6] studies are investigating inflammatory markers.[7]
Previous studies suggest that inflammatory response in- duces the formation of osteoclasts, thereby leading to bone loss. The correlation between bone metabolism and the concentration of C-reactive protein (CRP), which is a typical inflammatory marker, has been observed in immune and inflammatory diseases. High CRP concentration in meno- pausal women with rheumatoid arthritis was found to be related to high bone turnover,[7] and CRP concentration in premenopausal women was found to significantly corre- late with decreases in BMD.[8] Serum adiponectin, which shares structural similarities with tumor necrosis factor-al- pha (TNF-α), a potent regulator of osteoclastogenesis, has been reported to inversely correlate with BMD in diabetic patients.[9] However, studies are still ongoing because the exact mechanism has not been elucidated yet. Only a few Korean studies were conducted in adults. Therefore, this study aimed to investigate the influences of BMD status and systemic asymptomatic inflammatory response, and to analyze their relationship in healthy adults.
METHDOS 1. Participants
The participants of this study included healthy adults who visited the health promotion center of a university hospital in Gyeonggi Province. Before the beginning of the study, all the participants were given explanations on the purpose of the study, and the 80 who signed consent forms to participate in the study were selected as our final partic- ipants. After all the examinations were completed, four participants whose examinations were omitted were ex- cluded, and data analysis was conducted for the remaining 76 participants. The participants were divided into the fol- lowing groups according to the lumbar vertebrae and fe- mur neck T-scores obtained during BMD measurement:
those with T-scores of ≥-1 were classified as the normal BMD group, and those with T-scores <-1 were classified as the decreased BMD group. This study was approved by the Institutional Review Board of Soonchunhyang University Bucheon Hospital.
2. Anthropometric assessment and biochemical measurement
Height, weight, and body composition were analyzed by using a bio-electrical impedance fatness analyzer (InBody 720; Biospace Co., Seoul, Korea). Waist circumference was measured twice in each participant by using a tapeline while the participant was in a comfortable standing position.
The mean of the two values was used. For the blood test, the participants fasted for 12 hr and blood samples were obtained from their brachial veins. Serum that had been centrifuged for 10 min at 2,000 to 4,000 rpm was analyzed by using an automated clinical chemistry analyzer. CRP level was analyzed by using an automated clinical chemis- try analyzer (Fuji Dri-Chem 3500i; Fuji Photo Film Ltd., To- kyo, Japan), and adiponectin and TNF-α concentrations were analyzed by using human enzyme-linked immuno- sorbent assay kits (automatic microplate reader; Molecular Devices, CA, USA). The BMD was measured using the dual- energy X-ray absorptiometry equipment (GE Lunar Prodi- gy; GE Lunar Corp., Madison, WI, USA) on the participant’s lumber spine (LS) and femoral neck (FN).
3. Life habit and nutrient intake survey
The questions on the drinking, smoking and exercise habits were surveyed per individual. Skilled clinical dieti- tian interviewed participants using photographs of food items and a booklet containing eye measurement data as aids for the nutrient intake survey. Data on dietary intake amount were collected using the 24 hr recall method for three days and intakes of nutrients were analyzed with the computer aided nutritional (CAN) program version 3.0 (Ko- rean Nutrition Society, Seoul, Korea).[10] Nutrient density (ND) was calculated by standardizing the nutrient intake per 1,000 kcal based on the individual’s intake amount.
4. Statistical analysis
The mean and standard deviation were calculated using SPSS software program version 18.0 (SPSS Inc., Chicago, IL, USA). All data were reported as mean±standard deviation or as numbers and percentages. Groups comparisons used Chi-square tests for qualitative variables and independent t-test for quantitative variables. The correlation between bone density and its related variables was analyzed using Pearson’s correlation coefficient. All results were considered statistically significant when P<0.05 and the significance
was presented a)(P<0.05), b)(P<0.01), or c)(P<0.001).
RESULTS
1. Clinical characteristics of the participants
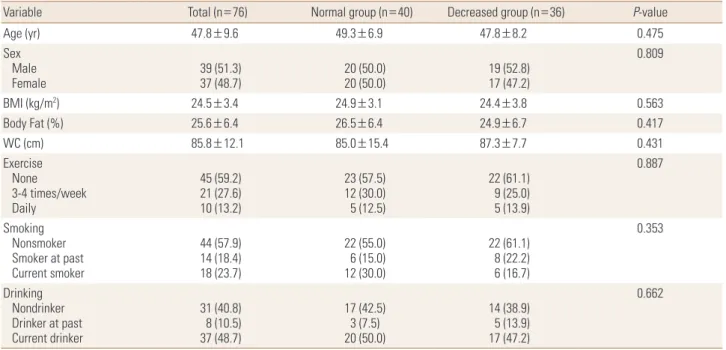
Among the 76 healthy adults, 40 (52.6%) belonged to the normal BMD group and 36 (47.4%) belonged to the decreased BMD group. Among the 36 participants in the decreased BMD group, 31 (86.1%) had osteopenia and five (13.9%) had osteoporosis. The mean age of the participants was 47.8 years. The mean body mass index (BMI), which was 24.5±3.4 kg/m2, was within the overweight range.Similarly, the mean body fat percentage, which was 25.6%
±6.4%, showed that the participants were obese. The mean waist circumference of the participants was 85.8 cm, and the groups did not differ significantly in their anthropomet- ric data. With regard to the participants’ life habits, 27.6%
of them exercised three to four times per week and 13.2%
exercised every day. The mean current smoking rate in all the participants was 23.7%, showing a higher smoking rate in the normal BMD group (30.0%) than in the decreased BMD group (16.7%). The mean current drinking rate in all the participants was 48.7%, 50.0% in the normal BMD group, and 47.2% in the decreased BMD group. Although the two groups did not differ significantly in their life habits, the
decreased BMD group had lower drinking and smoking rates, as well as exercise rate (Table 1).
2. Comparison of biochemical data
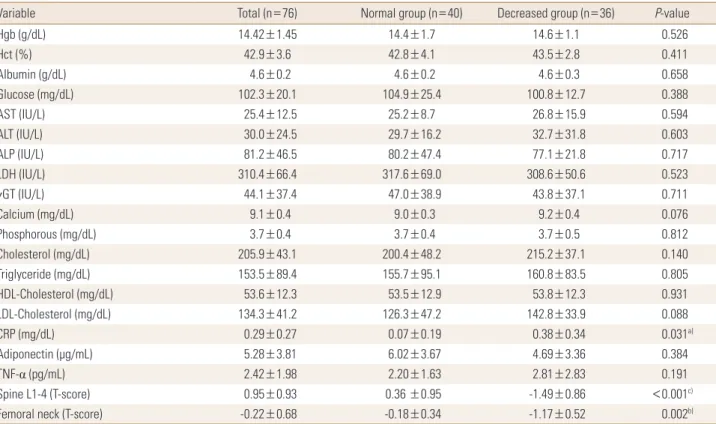
The results of the comparison of the blood test results of the two groups are shown in Table 2. The mean blood test results of all the participants and the two groups were all within the normal ranges. Although all the mean CRP con- centrations were within the normal ranges, the CRP con- centration in the decreased BMD group was significantly higher. The adiponectin concentration was lower in the decreased BMD group but the difference was not signifi- cant. Although the TNF-α concentration was higher in the decreased BMD group, the difference was not significant.
Overall, among the three inflammatory markers assessed in this study, only CRP concentration showed a significant difference between the two groups (Table 2).
3. Nutrient intake status and ND
Table 3 shows the comparison of nutrient intake status between the two groups. The decreased BMD group was found to have slightly higher protein and fat intakes. In part of mineral intake, the mean calcium intakes were 576.3
±231.1, 612.8±256.6, and 563.5±204.9 mg in all the par- ticipants, in the normal BMD group, and in the decreased
Table 1. Anthropometric and life habit data
Variable Total (n=76) Normal group (n=40) Decreased group (n=36) P-value
Age (yr) 47.8±9.6 49.3±6.9 47.8±8.2 0.475
Sex Male
Female 39 (51.3)
37 (48.7) 20 (50.0)
20 (50.0) 19 (52.8)
17 (47.2)
0.809
BMI (kg/m2) 24.5±3.4 24.9±3.1 24.4±3.8 0.563
Body Fat (%) 25.6±6.4 26.5±6.4 24.9±6.7 0.417
WC (cm) 85.8±12.1 85.0±15.4 87.3±7.7 0.431
Exercise None 3-4 times/week Daily
45 (59.2) 21 (27.6) 10 (13.2)
23 (57.5) 12 (30.0) 5 (12.5)
22 (61.1) 9 (25.0) 5 (13.9)
0.887
Smoking Nonsmoker Smoker at past Current smoker
44 (57.9) 14 (18.4) 18 (23.7)
22 (55.0) 6 (15.0) 12 (30.0)
22 (61.1) 8 (22.2) 6 (16.7)
0.353
Drinking Nondrinker Drinker at past Current drinker
31 (40.8) 8 (10.5) 37 (48.7)
17 (42.5) 3 (7.5) 20 (50.0)
14 (38.9) 5 (13.9) 17 (47.2)
0.662
Data was presented as mean and standard deviation, frequency and percentage.
BMI, body mass index; WC, waist circumference.
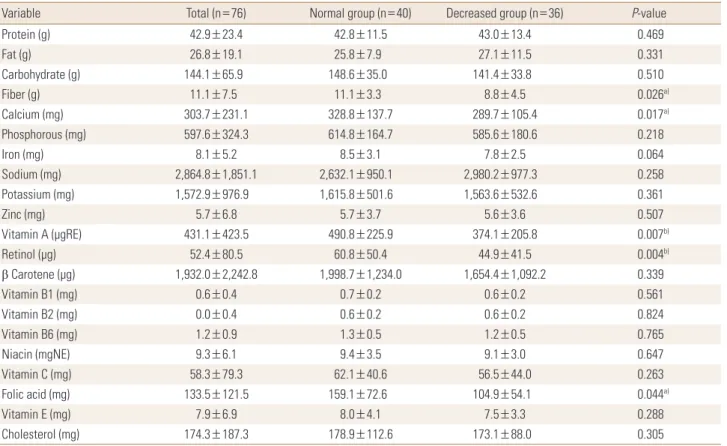
BMD group, respectively. The participants in the decreased BMD group were found to have lower calcium intakes. The sodium intake of the decreased BMD group was significant- ly higher. The mean vitamin A intake was significantly low- er in the decreased BMD group. Although the intakes of vi- tamins B1, B6, C, and E, and folic acid were lower in the de- creased BMD group, the difference was not significant. In the decreased BMD group, the ND of fiber, calcium, vitamin A, retinol, folic acid were significantly lower (Tables 3, 4).
4. The correlation with inflammatory marker and variables according to BMD
In each of the two groups, the correlation between BMD and the following factors was analyzed: inflammatory mark- ers and nutrients that showed significant differences be- tween the groups (sodium and vitamin A). In the normal BMD group, the correlations between BMD and the other factors were not significant. By contrast, the BMD in the decreased BMD group showed inverse correlations with CRP and dietary sodium intake (Table 5).
DISCUSSION
Previous studies conducted in South Korea and other countries suggested that inflammatory cytokines are in- volved in the activation of osteoclasts. Such inflammatory cytokines are known to influence normal bone remodel- ing, which is not related to inflammatory diseases, and typical cytokines include interleukin 1 (IL-1) and TNF.[11]
CRP is a major acute-phase reactant and is considered as a sensitive inflammatory marker. Inflammatory responses strongly stimulate the hepatic CRP production and increase the production of various cytokines such as IL-1, IL-6, and TNF-α, which induce bone resorption by controlling the differentiation and activity of osteoblasts and osteoclasts.
Increased bone resorption subsequently leads to increased bone turnover and decreased BMD.[12] To support such hypothesis, Salamone et al.[13] reported that the produc- tions of IL-1, IL-6, and TNF-α in peripheral blood mononu- clear cells positively correlated with vertebral bone loss in healthy premenopausal women, and Cohen-Solal et al.[14]
Table 2. Biochemical data
Variable Total (n=76) Normal group (n=40) Decreased group (n=36) P-value
Hgb (g/dL) 14.42±1.45 14.4±1.7 14.6±1.1 0.526
Hct (%) 42.9±3.6 42.8±4.1 43.5±2.8 0.411
Albumin (g/dL) 4.6±0.2 4.6±0.2 4.6±0.3 0.658
Glucose (mg/dL) 102.3±20.1 104.9±25.4 100.8±12.7 0.388
AST (IU/L) 25.4±12.5 25.2±8.7 26.8±15.9 0.594
ALT (IU/L) 30.0±24.5 29.7±16.2 32.7±31.8 0.603
ALP (IU/L) 81.2±46.5 80.2±47.4 77.1±21.8 0.717
LDH (IU/L) 310.4±66.4 317.6±69.0 308.6±50.6 0.523
γGT (IU/L) 44.1±37.4 47.0±38.9 43.8±37.1 0.711
Calcium (mg/dL) 9.1±0.4 9.0±0.3 9.2±0.4 0.076
Phosphorous (mg/dL) 3.7±0.4 3.7±0.4 3.7±0.5 0.812
Cholesterol (mg/dL) 205.9±43.1 200.4±48.2 215.2±37.1 0.140
Triglyceride (mg/dL) 153.5±89.4 155.7±95.1 160.8±83.5 0.805
HDL-Cholesterol (mg/dL) 53.6±12.3 53.5±12.9 53.8±12.3 0.931
LDL-Cholesterol (mg/dL) 134.3±41.2 126.3±47.2 142.8±33.9 0.088
CRP (mg/dL) 0.29±0.27 0.07±0.19 0.38±0.34 0.031a)
Adiponectin (μg/mL) 5.28±3.81 6.02±3.67 4.69±3.36 0.384
TNF-α (pg/mL) 2.42±1.98 2.20±1.63 2.81±2.83 0.191
Spine L1-4 (T-score) 0.95±0.93 0.36 ±0.95 -1.49±0.86 <0.001c)
Femoral neck (T-score) -0.22±0.68 -0.18±0.34 -1.17±0.52 0.002b)
Data was presented as mean and standard deviation.
a)P<0.05. b)P<0.01. c)P<0.001.
Hgb, hemoglobin; Hct, hematocrit; AST, aspartate aminotransferase; ALT, alanine aminotransferase; ALP, alkaline phosphatase; LDH, lactate dehydro- nase; γGT, gamma (γ)-glutamyl transferase; HDL, high-density lipoprotein; LDL, low-density lipoprotein; CRP, c-reactive protein; TNF-α, tumor necrosis factor-alpha.
reported that the concentrations of IL-1, IL-6, and TNF-α in mononuclear cell culture supernatant positively correlated with bone resorptive activity in menopausal women. More- over, Scheidt-Nave et al.[15] reported that serum IL-6 con- centration can predict femoral bone loss in healthy meno- pausal women. The aforementioned findings lead us to suspect that inflammatory cytokines are the main mecha- nisms that link CRP concentration and bone metabolism.
Adiponectin, which is a collagenous protein that is specifi- cally expressed in human adipocytes, inversely correlated with obesity.[9] A relatively smaller number of studies have investigated the correlation between serum adiponectin concentration and BMD. An inverse correlation between adiponectin concentration and BMD has been reported in diabetic patients.[16] Adiponectin suppresses the forma- tion of adipocytes by increasing the expression of cycloox- ygenase-2 (COX-2) and the secretion of prostaglandin E2
(PG E2) in bone marrow stromal cells. As COX-2 is also known to be involved in the differentiation of cells to osteoblasts, further studies are required to investigate how adiponec-
tin influences bone metabolism through the COX-2 path- way.[17] In our study, the blood test and inflammatory mar- ker results of the healthy adults were all within the normal ranges. However, CRP concentration was significantly high- er in the decreased BMD group. In a recent large-scale study, CRP concentration was reported to highly correlate with BMD in both males and females, and to be a useful predic- tive factor of the occurrence of fractures.[18] In a study con- ducted with South Korean menopausal women, CRP con- centration was found to correlate with BMD.[19] Napoli et al.[18] reported that adiponectin concentration did not correlate with BMD in males but showed significant differ- ences in females. In a cohort study, CRP concentration was found to correlate with femur neck BMD, while TNF-α con- centration was found to correlate with spine BMD.[20] When the relationship between BMD and various inflammatory markers was analyzed in this study, BMD significantly cor- related only with CRP concentration but did not correlate with other markers.
According to the analysis of the participants’ nutrient in- Table 3. Nutrient intake status
Variable Total (n=76) Normal group (n=40) Decreased group (n=36) P-value
Energy (kcal) 1,897.4±408.4 1,863.5±384.7 1,944.8±439.3 0.395
Protein (g) 81.4±23.4 79.7±21.5 83.7±26.0 0.467
Fat (g) 50.9±19.1 48.1±14.8 52.7±22.4 0.304
Carbohydrate (g) 273.5±65.9 276.9±65.2 275.0±65.8 0.901
Fiber (g) 19.1±7.5 20.7±6.1 17.1±8.8 0.408
Calcium (mg) 576.3±231.1 612.8±256.6 563.5±204.9 0.356
Phosphorous (mg) 1,133.9±324.3 1,145.7±306.9 1,138.9±351.3 0.930
Iron (mg) 15.4±5.2 15.9±5.8 15.2±4.8 0.517
Sodium (mg) 5,435.7±1,851.1 4,904.9±1,770.5 5,795.9±1,900.6 0.026a)
Potassium (mg) 2,984.5±976.9 3,011.0±934.8 3,040.9±1,035.8 0.895
Zinc (mg) 10.9±6.8 10.6±6.9 10.9±7.0 0.825
Vitamin A (μgRE) 817.9±423.5 914.6±421.0 727.6±400.3 0.041a)
Retinol (μg) 99.4±80.5 113.3±94.0 87.3±80.7 0.127
β Carotene (μg) 3,665.7±2,242.8 3,724.5±2,299.6 3,217.5±2,124.2 0.185
Vitamin B1 (mg) 1.18±0.38 1.22±0.44 1.15±0.33 0.416
Vitamin B2 (mg) 1.13±0.40 1.12±0.44 1.15±0.35 0.726
Vitamin B6 (mg) 2.34±0.90 2.46±0.85 2.26±0.97 0.325
Niacin (mgNE) 17.6±6.1 17.54±6.6 17.70±5.8 0.913
Vitamin C (mg) 110.7±79.3 115.8±75.6 109.9±85.5 0.752
Folic acid (mg) 253.3±121.5 296.5±135.3 204.1±105.2 0.129
Vitamin E (mg) 14.9±6.9 15.0±7.6 14.6±6.5 0.793
Cholesterol (mg) 330.7±187.3 333.3±209.9 336.6±171.2 0.941
Data was presented as mean and standard deviation.
a)P<0.05.
Table 4. Comparison of nutrient density
Variable Total (n=76) Normal group (n=40) Decreased group (n=36) P-value
Protein (g) 42.9±23.4 42.8±11.5 43.0±13.4 0.469
Fat (g) 26.8±19.1 25.8±7.9 27.1±11.5 0.331
Carbohydrate (g) 144.1±65.9 148.6±35.0 141.4±33.8 0.510
Fiber (g) 11.1±7.5 11.1±3.3 8.8±4.5 0.026a)
Calcium (mg) 303.7±231.1 328.8±137.7 289.7±105.4 0.017a)
Phosphorous (mg) 597.6±324.3 614.8±164.7 585.6±180.6 0.218
Iron (mg) 8.1±5.2 8.5±3.1 7.8±2.5 0.064
Sodium (mg) 2,864.8±1,851.1 2,632.1±950.1 2,980.2±977.3 0.258
Potassium (mg) 1,572.9±976.9 1,615.8±501.6 1,563.6±532.6 0.361
Zinc (mg) 5.7±6.8 5.7±3.7 5.6±3.6 0.507
Vitamin A (μgRE) 431.1±423.5 490.8±225.9 374.1±205.8 0.007b)
Retinol (μg) 52.4±80.5 60.8±50.4 44.9±41.5 0.004b)
β Carotene (μg) 1,932.0±2,242.8 1,998.7±1,234.0 1,654.4±1,092.2 0.339
Vitamin B1 (mg) 0.6±0.4 0.7±0.2 0.6±0.2 0.561
Vitamin B2 (mg) 0.0±0.4 0.6±0.2 0.6±0.2 0.824
Vitamin B6 (mg) 1.2±0.9 1.3±0.5 1.2±0.5 0.765
Niacin (mgNE) 9.3±6.1 9.4±3.5 9.1±3.0 0.647
Vitamin C (mg) 58.3±79.3 62.1±40.6 56.5±44.0 0.263
Folic acid (mg) 133.5±121.5 159.1±72.6 104.9±54.1 0.044a)
Vitamin E (mg) 7.9±6.9 8.0±4.1 7.5±3.3 0.288
Cholesterol (mg) 174.3±187.3 178.9±112.6 173.1±88.0 0.305
Data was presented as mean and standard deviation.
a)P<0.05. b)P<0.01.
Table 5. Correlation coefficients between bone mineral density and inflammatory markers
CRP Adiponec-
tin TNF-α Sodium Vitamin A Normal group -0.139 0.121 -0.206 -0.282 0.023 Low group -0.356a) 0.190 -0.127 -0.347a) -0.135
a)P<0.05.
CRP, c-reactive protein; TNF-α, tumor necrosis factor-alpha.
take, the participants were taking sufficient amounts of nutrients when compared with the age-matched recom- mended dietary allowance for South Koreans.[21] Howev- er, their intakes of calcium, vitamin B2, and folic acid were insufficient, and their intakes of protein and sodium were excessive. We also analyzed whether nutrient intake dif- fered according to BMD status. In particular, sodium intake was significantly higher and vitamin A intake was signifi- cantly lower in the decreased BMD group than in the nor- mal BMD group. Moreover, a negative correlation was ob- served between BMD and sodium intake was found in the decreased BMD group. As calcium is essential for bone for- mation and maintenance, and sodium can increase the re-
nal calcium excretion, increased calcium intake and less salty diets should be recommended to prevent and treat osteoporosis. In the future, studies could be conducted to investigate whether secondary factors such as nutritional status influence the correlation between inflammatory mark- ers and BMD. This study has several limitations, including its retrospective cross-sectional design, small number of participants, and inclusion of menopausal women as par- ticipants. Nevertheless, this study is significant because no other South Korean study has investigated the relationship of BMD with inflammatory markers and nutrient intake. In the future, large-scale prospective studies are required to investigate the influence of inflammatory markers on BMD.
REFERENCES
1. Korean Society for Bone and Mineral Research. Physician’s guide for diagnosis & treatment of osteoporosis. 2015 [cit- ed by 2016 Feb 1]. Available from: http://www.ksbmr.org/
image/journal/골다공증%20지침서2015_final_1002.pdf 2. Firooznia H, Golimbu C, Rafii M, et al. Quantitative com-
puted tomography assessment of spinal trabecular bone.
I. Age-related regression in normal men and women. J Comput Tomogr 1984;8:91-7.
3. Matkovic V. Calcium intake and peak bone mass. N Engl J Med 1992;327:119-20.
4. Labouesse MA, Gertz ER, Piccolo BD, et al. Associations among endocrine, inflammatory, and bone markers, body composition and weight loss induced bone loss. Bone 2014;
64:138-46.
5. Koroglu BK, Kiris F, Ersoy IH, et al. Relation of leptin, adipo- nectin and insulin resistance to bone mineral density in type 2 diabetic postmenopausal women. Endokrynol Pol 2011;62:429-35.
6. Ornstrup MJ, Kjær TN, Harsløf T, et al. Adipose tissue, es- tradiol levels, and bone health in obese men with meta- bolic syndrome. Eur J Endocrinol 2015;172:205-16.
7. Marhoffer W, Stracke H, Masoud I, et al. Evidence of im- paired cartilage/bone turnover in patients with active an- kylosing spondylitis. Ann Rheum Dis 1995;54:556-9.
8. Koh JM, Khang YH, Jung CH, et al. Higher circulating hsCRP levels are associated with lower bone mineral density in healthy pre- and postmenopausal women: evidence for a link between systemic inflammation and osteoporosis.
Osteoporos Int 2005;16:1263-71.
9. Arita Y, Kihara S, Ouchi N, et al. Paradoxical decrease of an adipose-specific protein, adiponectin, in obesity. Biochem Biophys Res Commun 1999;257:79-83.
10. Lim H, Kim HJ, Hong SJ, et al. Nutrient intake and bone mineral density by nutritional status in patients with in- flammatory bowel disease. J Bone Metab 2014;21:195-203.
11. Lorenzo J. Interactions between immune and bone cells:
new insights with many remaining questions. J Clin Invest 2000;106:749-52.
12. Weinhold B, Rüther U. Interleukin-6-dependent and -in- dependent regulation of the human C-reactive protein gene. Biochem J 1997;327 pt 2:425-9.
13. Salamone LM, Whiteside T, Friberg D, et al. Cytokine pro- duction and bone mineral density at the lumbar spine and femoral neck in premenopausal women. Calcif Tissue Int 1998;63:466-70.
14. Cohen-Solal ME, Graulet AM, Denne MA, et al. Peripheral monocyte culture supernatants of menopausal women can induce bone resorption: involvement of cytokines. J Clin Endocrinol Metab 1993;77:1648-53.
15. Scheidt-Nave C, Bismar H, Leidig-Bruckner G, et al. Serum interleukin 6 is a major predictor of bone loss in women specific to the first decade past menopause. J Clin Endo- crinol Metab 2001;86:2032-42.
16. Lenchik L, Register TC, Hsu FC, et al. Adiponectin as a nov- el determinant of bone mineral density and visceral fat.
Bone 2003;33:646-51.
17. Scherer PE, Williams S, Fogliano M, et al. A novel serum protein similar to C1q, produced exclusively in adipocytes.
J Biol Chem 1995;270:26746-9.
18. Napoli N, Pedone C, Pozzilli P, et al. Adiponectin and bone mass density: the InCHIANTI study. Bone 2010;47:1001-5.
19. Yoon HG, Bok GH, Lee KW, et al. Relationships of serum leptin and adiponectin concentrations with bone mineral density in Korean postmenopausal women. J Bone Metab 2006;13:33-9.
20. Sponholtz TR, Zhang X, Fontes JD, et al. Association be- tween inflammatory biomarkers and bone mineral densi- ty in a community-based cohort of men and women. Ar- thritis Care Res (Hoboken) 2014;66:1233-40.
21. The Korean Nutrition Society. Dietary reference intakes for Koreans. Sejong: Ministry of Health and Welfare; 2015.