Workplace Violence and Gender Equality: Country Level Data in European Countries and Korea
Yeogyeong Yoon , Kyunghee Jung-Choi
Department of Occupational and Environmental Medicine, Ewha Womans University College of Medicine, Seoul, Korea
Article eISSN 2234-2591
Objectives: The purpose of this study was to compare the prevalence of workplace violence in European countries and Korea, and to determine the relationship between the prevalence of workplace violence and gender equality in each country. The level of gender equality was used as a proxy for the sensitivity to and awareness of workplace violence.
Methods: This study included 30,032 Europeans from the 6th European Working Con- ditions Survey and 39,675 Koreans from the 5th Korean Working Conditions Survey.
Workplace violence included verbal abuse, unwanted sexual attention, threats, and humiliating behaviors over the past month and physical violence, sexual harassment, and bullying or harassment over the past year. The prevalence of workplace violence was standardized using the direct standardization method. Spearman’s rank correlation analysis was used to examine the relationship between the prevalence of workplace violence and Gender Gap Index (GGI) adjusted for the Gini coefficient, unemployment rate, and share of temporary employment.
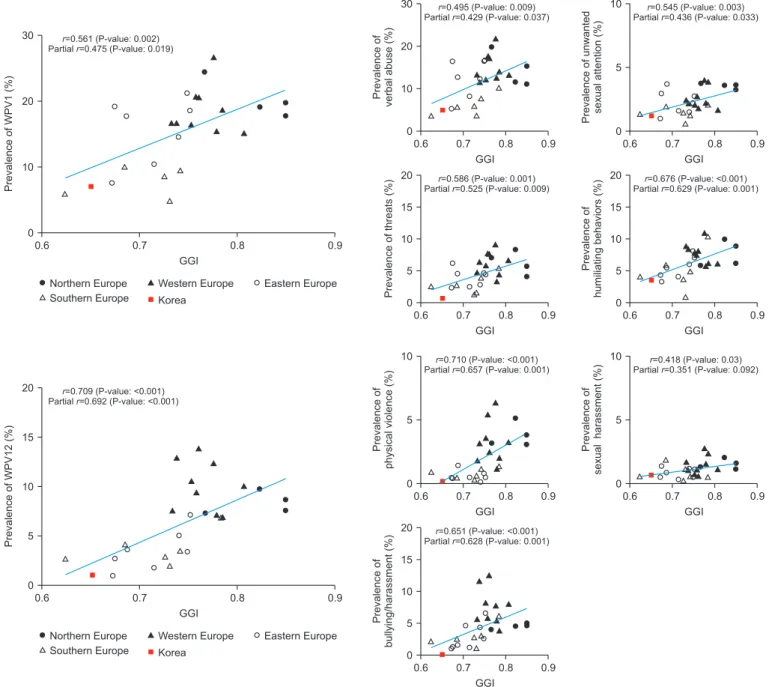
Results: Countries with a high GGI showed a higher prevalence of workplace violence.
Even after adjusting for the Gini coefficient, unemployment rate, and share of tempo- rary employment, the positive correlations between the GGI and workplace violence over the past month (r=0.475, P=0.019) and workplace violence over the past year (r=0.692, P=0.001) were still significant.
Conclusion: This study is significant in that it addressed the issue of underreporting violence despite data limitations. Public intervention should be considered to in- crease sensitivity to workplace violence and prevent workplace violence. (Ewha Med J 2021;44(3):70-79)
Received May 7, 2021 Revised June 15, 2021 Accepted June 21, 2021 Corresponding author Kyunghee Jung-Choi
Department of Occupational and Environmental Medicine, Ewha Womans University College of Medicine, 260 Gonghang-daero, Gangseo-gu, Seoul 07804, Korea
Tel: 82-2-6986-6235, Fax: 82-2-6986-7022 E-mail: [email protected]
Key Words
Workplace violence; Gender Equity;
Ecological study
This is an Open Access article distributed under the terms of the Creative Commons Attribution Non-Commercial License (http://creativecommons.org/licenses/by-nc/4.0) which permits unrestricted non-commercial use, distribution, and reproduction in any medium, provided the original work is properly cited.
Introduction
Workplace violence, as defined by the International Labor Office, refers to “any action, incident or behavior that de- parts from reasonable conduct in which a person is assaulted, threatened, harmed, injured in the course of, or as a direct result of, his or her work” [1]. Mental and physical problems such as insomnia, depression, anxiety, post-traumatic stress disorder,
and cardiovascular disease may occur due to workplace vio- lence [2-4]. In addition, workplace violence can have a nega- tive effect on the organization by increasing turnover intentions and reducing commitment and job satisfaction [5,6]. Therefore, workplace violence is an important public health issue that re- quires active intervention.
Previous studies found that gender, age, race, and mari-
tal status are personal factors related to the risk of workplace
violence, and occupation type, occupational position, work experience, working hours, night shift work, and workloads are occupational factors that can increase the risk of work- place violence [7-9]. In addition, other studies indicated that workers with previous experience of workplace violence and job stress such as high job demands may be more vulnerable to workplace violence [10,11]. Workplace-related factors as interpersonal conflict, low work efficiency, and a poor violence prevention climate and policy-related factors such as business policies also have an effect on workplace violence [9,12].
Similar to other health problems, it is crucial to accurately determine the status of workplace violence to ensure proper intervention. The main approach for understanding the current status of workplace violence is through a survey. The report- ing of workplace violence in a survey depends on individual judgment, which may be influenced by the sociocultural con- text and the level of perception and awareness [13]. European countries with a higher power distance, which indicates a higher tolerance for violence, have been found to show a lower prevalence of self-reported adverse social behaviors. In addi- tion, a patriarchal or masculine culture could contribute to the social acceptance of adverse social behaviors [13]. These public attitudes toward violence seemed to be rooted in gender in- equality in each society [14]. The level of gender equality in the country may influence the reported level of workplace violence depending on the sociocultural context in terms of tolerance for violence and level of sensitivity to and awareness of violence.
However, studies exploring the relationship between gender equality and workplace violence are limited.
The main objective of this study was to compare the preva- lence of workplace violence in European countries and Korea.
In addition, the study aimed to determine the relationship be- tween the prevalence of workplace violence and the level of gender equality using the Gender Gap Index (GGI).
Methods
1. Study subjects
This study used data from the 6th European Working Con- ditions Survey (EWCS) in 2015 and the 5th Korean Working Conditions Survey (KWCS) in 2017. The EWCS has been con- ducted every 4 to 5 years by the European Foundation for the Improvement of Living and Working Conditions (Eurofound)
since 1991, and it has been used as a basis for establishing safe- ty and health policies in European countries. In the most recent 6th EWCS in 2015, 28 European Union countries and seven other European countries were surveyed, 1,000 to 3,300 people per country were recruited, and 43,850 people were surveyed.
The KWCS is conducted by the Korea Occupational Safety and Health Agency from 2006 on sample workers nationwide with the EWCS as benchmark. The target population of the first KWCS was individuals aged 15 to 64 years who were in employment, and the number of samples was 10,000. Fifty thousand two hundred five people were surveyed in 2017. As the sampling framework and questionnaire were created based on the EWCS, the questionnaire is similar except for Korea- specific questions. Therefore, both surveys generate representa- tive statistical data that reflect the working environment based on a sample of workers and are comparable because the same questions are used in the questionnaires [15].
The EWCS and the KWCS recruited subjects aged 15 or older (16 or older in Bulgaria, Norway, Spain, and the United Kingdom) who were in employment. There were differences in the range and proportion of the subject’s age according to the country. In this study, the age range was limited to 20 to 64 years. Unpaid family workers and soldiers were excluded.
As the Organisation for Economic Co-operation and Devel- opment (OECD) unemployment rate and share of temporary employment were used as variables, 9 countries from 35 Euro- pean countries were excluded, and 26 European countries and Korea were included in the final sample. The study included 30,032 individuals (15,052 men and 14,980 women) in Europe, and 39,675 individuals (19,372 men, 20,303 women) in Korea.
The data were obtained from the Eurofound and Korea Oc- cupational Safety and Health Agency. This study was approved by the institutional review board of Ewha Womans University Seoul Hospital (SEUMC 2020-05-022). Consent to partici- pate was not required, because this study did not involve hu- man participant interactions and all data were publicly avail- able and de-identified.
2. Variables
Workplace violence over the past month was identified using
the question, “Over the past month during the course of your
work, have you been subjected to any of the following?”, and
the types of violence were verbal abuse, unwanted sexual at-
tention, threats, and humiliating behaviors. Verbal abuse also included abuse in the form of texts such as emails. Workplace violence in the past 1 year was based on the question, “Over the past 12 months during the course of your work, have you been subjected to any of the following?”, and the types of vio- lence included physical violence, sexual harassment, and bully- ing/harassment with the answers “Yes”, “No”, “Don’t know”, or “Refused to answer” for each of the items.
In this study, workplace violence over the past month (WPV1) included one or more experiences of verbal abuse, un-
wanted sexual attention, threats, or humiliating behaviors over the past month. Workplace violence over 12 months (WPV12) included more than one experience of physical violence, sexual harassment, or bullying/harassment for 12 months. In addition, the prevalence of the specific types of workplace violence was also identified.
Gender equality in the present study was assessed using the GGI in 2015. The GGI is an indicator of gender gaps in eco- nomics, politics, education and health published by the World Economic Forum. The GGI consists of 14 indicators in four
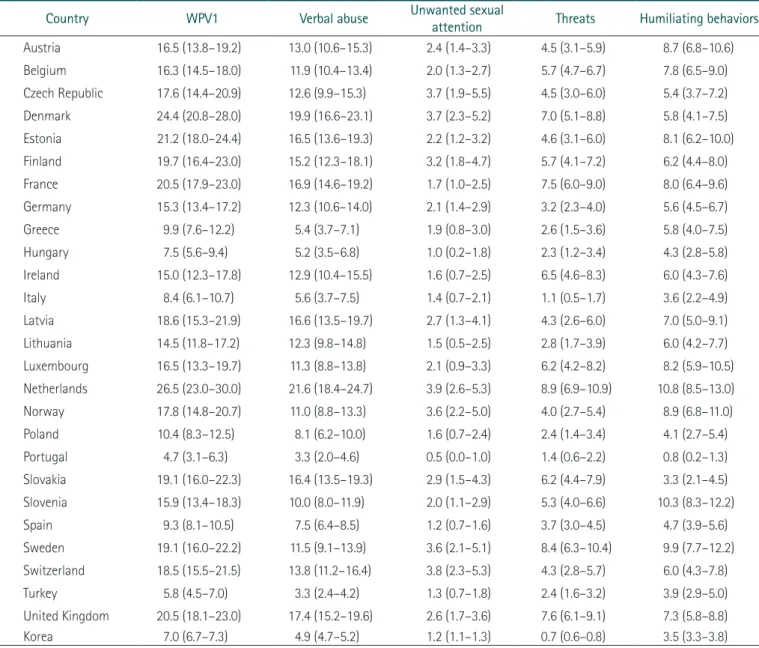
Table 1. Age-standardized prevalence of WPV1 in each country
Country WPV1 Verbal abuse Unwanted sexual
attention Threats Humiliating behaviors
Austria 16.5 (13.8–19.2) 13.0 (10.6–15.3) 2.4 (1.4–3.3) 4.5 (3.1–5.9) 8.7 (6.8–10.6)
Belgium 16.3 (14.5–18.0) 11.9 (10.4–13.4) 2.0 (1.3–2.7) 5.7 (4.7–6.7) 7.8 (6.5–9.0)
Czech Republic 17.6 (14.4–20.9) 12.6 (9.9–15.3) 3.7 (1.9–5.5) 4.5 (3.0–6.0) 5.4 (3.7–7.2)
Denmark 24.4 (20.8–28.0) 19.9 (16.6–23.1) 3.7 (2.3–5.2) 7.0 (5.1–8.8) 5.8 (4.1–7.5)
Estonia 21.2 (18.0–24.4) 16.5 (13.6–19.3) 2.2 (1.2–3.2) 4.6 (3.1–6.0) 8.1 (6.2–10.0)
Finland 19.7 (16.4–23.0) 15.2 (12.3–18.1) 3.2 (1.8–4.7) 5.7 (4.1–7.2) 6.2 (4.4–8.0)
France 20.5 (17.9–23.0) 16.9 (14.6–19.2) 1.7 (1.0–2.5) 7.5 (6.0–9.0) 8.0 (6.4–9.6)
Germany 15.3 (13.4–17.2) 12.3 (10.6–14.0) 2.1 (1.4–2.9) 3.2 (2.3–4.0) 5.6 (4.5–6.7)
Greece 9.9 (7.6–12.2) 5.4 (3.7–7.1) 1.9 (0.8–3.0) 2.6 (1.5–3.6) 5.8 (4.0–7.5)
Hungary 7.5 (5.6–9.4) 5.2 (3.5–6.8) 1.0 (0.2–1.8) 2.3 (1.2–3.4) 4.3 (2.8–5.8)
Ireland 15.0 (12.3–17.8) 12.9 (10.4–15.5) 1.6 (0.7–2.5) 6.5 (4.6–8.3) 6.0 (4.3–7.6)
Italy 8.4 (6.1–10.7) 5.6 (3.7–7.5) 1.4 (0.7–2.1) 1.1 (0.5–1.7) 3.6 (2.2–4.9)
Latvia 18.6 (15.3–21.9) 16.6 (13.5–19.7) 2.7 (1.3–4.1) 4.3 (2.6–6.0) 7.0 (5.0–9.1)
Lithuania 14.5 (11.8–17.2) 12.3 (9.8–14.8) 1.5 (0.5–2.5) 2.8 (1.7–3.9) 6.0 (4.2–7.7)
Luxembourg 16.5 (13.3–19.7) 11.3 (8.8–13.8) 2.1 (0.9–3.3) 6.2 (4.2–8.2) 8.2 (5.9–10.5)
Netherlands 26.5 (23.0–30.0) 21.6 (18.4–24.7) 3.9 (2.6–5.3) 8.9 (6.9–10.9) 10.8 (8.5–13.0)
Norway 17.8 (14.8–20.7) 11.0 (8.8–13.3) 3.6 (2.2–5.0) 4.0 (2.7–5.4) 8.9 (6.8–11.0)
Poland 10.4 (8.3–12.5) 8.1 (6.2–10.0) 1.6 (0.7–2.4) 2.4 (1.4–3.4) 4.1 (2.7–5.4)
Portugal 4.7 (3.1–6.3) 3.3 (2.0–4.6) 0.5 (0.0–1.0) 1.4 (0.6–2.2) 0.8 (0.2–1.3)
Slovakia 19.1 (16.0–22.3) 16.4 (13.5–19.3) 2.9 (1.5–4.3) 6.2 (4.4–7.9) 3.3 (2.1–4.5)
Slovenia 15.9 (13.4–18.3) 10.0 (8.0–11.9) 2.0 (1.1–2.9) 5.3 (4.0–6.6) 10.3 (8.3–12.2)
Spain 9.3 (8.1–10.5) 7.5 (6.4–8.5) 1.2 (0.7–1.6) 3.7 (3.0–4.5) 4.7 (3.9–5.6)
Sweden 19.1 (16.0–22.2) 11.5 (9.1–13.9) 3.6 (2.1–5.1) 8.4 (6.3–10.4) 9.9 (7.7–12.2)
Switzerland 18.5 (15.5–21.5) 13.8 (11.2–16.4) 3.8 (2.3–5.3) 4.3 (2.8–5.7) 6.0 (4.3–7.8)
Turkey 5.8 (4.5–7.0) 3.3 (2.4–4.2) 1.3 (0.7–1.8) 2.4 (1.6–3.2) 3.9 (2.9–5.0)
United Kingdom 20.5 (18.1–23.0) 17.4 (15.2–19.6) 2.6 (1.7–3.6) 7.6 (6.1–9.1) 7.3 (5.8–8.8)
Korea 7.0 (6.7–7.3) 4.9 (4.7–5.2) 1.2 (1.1–1.3) 0.7 (0.6–0.8) 3.5 (3.3–3.8)
Values are presented as percentage with confidence interval.
WPV1, workplace violence over the past month.
sectors, and measures gender equality only based on gender gaps, regardless of the state of development in the country. A score of 1 indicates perfect equality, and a score of 0 indicates perfect inequality [16].
Income inequality, unemployment rate, and share of tempo- rary employment were included as covariates considering that variables at the national level that could increase stress in the labor market and workplace. The Gini coefficient represents the relationship between population distribution and income distribution, with a value of 0 indicating maximal equality and a value of 1 indicating maximal inequality [17]. The Gini coef-
ficient was taken from the 2015 United Nations Development Program Human Development Report [18]. To reflect the country’s labor market situation, the unemployment rate and share of temporary employment in the 2015 OECD statistics were selected as variables [19].
3. Statistical analysis
The 26 countries in Europe were grouped into four regions, and the number of subjects was 3,551 in Northern Europe, 11,460 in Western Europe, 5,986 in Eastern Europe, and 9,035 in Southern Europe (Northern Europe: Denmark, Finland,
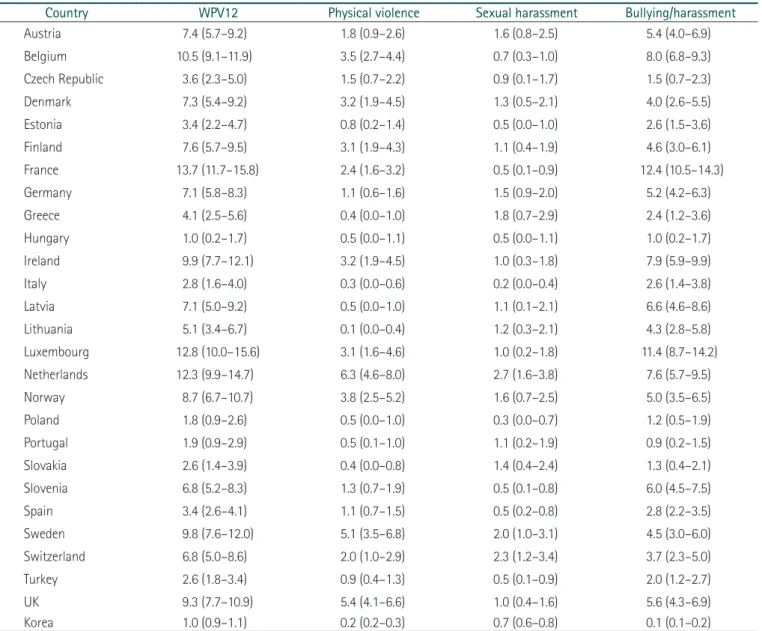
Table 2. Age-standardized prevalence of WPV12 in each country
Country WPV12 Physical violence Sexual harassment Bullying/harassment
Austria 7.4 (5.7–9.2) 1.8 (0.9–2.6) 1.6 (0.8–2.5) 5.4 (4.0–6.9)
Belgium 10.5 (9.1–11.9) 3.5 (2.7–4.4) 0.7 (0.3–1.0) 8.0 (6.8–9.3)
Czech Republic 3.6 (2.3–5.0) 1.5 (0.7–2.2) 0.9 (0.1–1.7) 1.5 (0.7–2.3)
Denmark 7.3 (5.4–9.2) 3.2 (1.9–4.5) 1.3 (0.5–2.1) 4.0 (2.6–5.5)
Estonia 3.4 (2.2–4.7) 0.8 (0.2–1.4) 0.5 (0.0–1.0) 2.6 (1.5–3.6)
Finland 7.6 (5.7–9.5) 3.1 (1.9–4.3) 1.1 (0.4–1.9) 4.6 (3.0–6.1)
France 13.7 (11.7–15.8) 2.4 (1.6–3.2) 0.5 (0.1–0.9) 12.4 (10.5–14.3)
Germany 7.1 (5.8–8.3) 1.1 (0.6–1.6) 1.5 (0.9–2.0) 5.2 (4.2–6.3)
Greece 4.1 (2.5–5.6) 0.4 (0.0–1.0) 1.8 (0.7–2.9) 2.4 (1.2–3.6)
Hungary 1.0 (0.2–1.7) 0.5 (0.0–1.1) 0.5 (0.0–1.1) 1.0 (0.2–1.7)
Ireland 9.9 (7.7–12.1) 3.2 (1.9–4.5) 1.0 (0.3–1.8) 7.9 (5.9–9.9)
Italy 2.8 (1.6–4.0) 0.3 (0.0–0.6) 0.2 (0.0–0.4) 2.6 (1.4–3.8)
Latvia 7.1 (5.0–9.2) 0.5 (0.0–1.0) 1.1 (0.1–2.1) 6.6 (4.6–8.6)
Lithuania 5.1 (3.4–6.7) 0.1 (0.0–0.4) 1.2 (0.3–2.1) 4.3 (2.8–5.8)
Luxembourg 12.8 (10.0–15.6) 3.1 (1.6–4.6) 1.0 (0.2–1.8) 11.4 (8.7–14.2)
Netherlands 12.3 (9.9–14.7) 6.3 (4.6–8.0) 2.7 (1.6–3.8) 7.6 (5.7–9.5)
Norway 8.7 (6.7–10.7) 3.8 (2.5–5.2) 1.6 (0.7–2.5) 5.0 (3.5–6.5)
Poland 1.8 (0.9–2.6) 0.5 (0.0–1.0) 0.3 (0.0–0.7) 1.2 (0.5–1.9)
Portugal 1.9 (0.9–2.9) 0.5 (0.1–1.0) 1.1 (0.2–1.9) 0.9 (0.2–1.5)
Slovakia 2.6 (1.4–3.9) 0.4 (0.0–0.8) 1.4 (0.4–2.4) 1.3 (0.4–2.1)
Slovenia 6.8 (5.2–8.3) 1.3 (0.7–1.9) 0.5 (0.1–0.8) 6.0 (4.5–7.5)
Spain 3.4 (2.6–4.1) 1.1 (0.7–1.5) 0.5 (0.2–0.8) 2.8 (2.2–3.5)
Sweden 9.8 (7.6–12.0) 5.1 (3.5–6.8) 2.0 (1.0–3.1) 4.5 (3.0–6.0)
Switzerland 6.8 (5.0–8.6) 2.0 (1.0–2.9) 2.3 (1.2–3.4) 3.7 (2.3–5.0)
Turkey 2.6 (1.8–3.4) 0.9 (0.4–1.3) 0.5 (0.1–0.9) 2.0 (1.2–2.7)
UK 9.3 (7.7–10.9) 5.4 (4.1–6.6) 1.0 (0.4–1.6) 5.6 (4.3–6.9)
Korea 1.0 (0.9–1.1) 0.2 (0.2–0.3) 0.7 (0.6–0.8) 0.1 (0.1–0.2)
Values are presented as percentage with confidence interval.
WPV12, workplace violence over the 12 months.
Norway, and Sweden; Western Europe: Austria, Belgium, France, Germany, Ireland, Luxembourg, Netherlands, Switzer- land, and United Kingdom; Eastern Europe: Czech Republic, Estonia, Hungary, Latvia, Lithuania, Poland, and Slovakia;
Southern Europe: Greece, Italy, Portugal, Slovenia, Spain, and Turkey.).
The prevalence of workplace violence in 26 European coun- tries and Korea was standardized using the direct standardiza- tion method with grouping of 5 years from 20 to 64 years. The data from the European Statistical Office (Eurostat) were used as the standard population [20].
In this study, data analysis was performed using SAS ver. 9.4 (SAS Institute, Cary, NC, USA) and R ver. 4.0 (R Foundation for Statistical Computing, Vienna, Austria). Spearman’s rank correlation coefficient was used to identify the relationship be- tween workplace violence prevalence and the GGI. The partial correlation coefficient was used to assess the independent asso- ciation between workplace violence and the GGI, with adjust- ment for the Gini coefficient, unemployment rate and share of temporary employment.
Results
Table 1 shows the age-adjusted prevalence and confidence interval of WPV1 according to the country. WPV1 was the
highest in the Netherlands (26.5%), followed by Denmark (24.4%), and Estonia (21.2%). The prevalence in Korea was 7.0%, ranking 25th out of 27 countries. In terms of verbal abuse, unwanted sexual attention, threats and humiliating behaviors, Korea ranked 24th to 27th. The average WPV1 ac- cording to the region was 20.2% in Northern Europe, 18.4% in Western Europe, 15.6% in Eastern Europe, 9.0% in Southern Europe, and 7.0% in Korea.
As shown in Table 2, France (13.7%) had the highest preva- lence of WPV12, followed by Luxembourg (12.8%) and the Netherlands (12.3%). Korea ranked 27
thwith a prevalence of 1.0%. In terms of the types of violence, Korea ranked 18th for sexual harassment, which was higher than the ranks for physi- cal violence (26th) and bullying or harassment (27th). The regional average prevalence of WPV12 was 8.3% in Northern Europe, 10.0% in Western Europe, 3.5% in Eastern Europe, 3.6% in Southern Europe, and 1.0% in Korea. The prevalence of workplace violence was higher in Northern and Western European countries than in Eastern and Southern European countries and Korea.
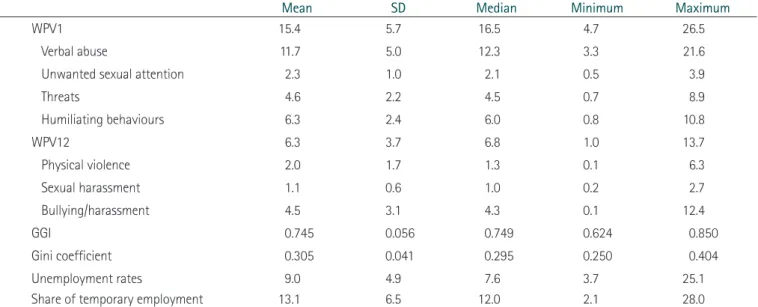
Table 3 shows the descriptive statistics including the mean, standard deviation, median, maximum, and minimum values of the prevalence of workplace violence, GGI, Gini coefficient, unemployment rate, and share of temporary employment in 26 European countries and Korea. The average, maximum, and
Table 3. Descriptive statistics for prevalence of workplace violence, GGI, Gini coefficient, unemployment rate and share of temporary employment in 27 countries (%)
Mean SD Median Minimum Maximum
WPV1 15.4 5.7 16.5 4.7 26.5
Verbal abuse 11.7 5.0 12.3 3.3 21.6
Unwanted sexual attention 2.3 1.0 2.1 0.5 3.9
Threats 4.6 2.2 4.5 0.7 8.9
Humiliating behaviours 6.3 2.4 6.0 0.8 10.8
WPV12 6.3 3.7 6.8 1.0 13.7
Physical violence 2.0 1.7 1.3 0.1 6.3
Sexual harassment 1.1 0.6 1.0 0.2 2.7
Bullying/harassment 4.5 3.1 4.3 0.1 12.4
GGI 0.745 0.056 0.749 0.624 0.850
Gini coefficient 0.305 0.041 0.295 0.250 0.404
Unemployment rates 9.0 4.9 7.6 3.7 25.1
Share of temporary employment 13.1 6.5 12.0 2.1 28.0
GGI, Gender Gap Index; SD, standard deviation; WPV1, workplace violence over the past month; WPV12, workplace violence over the 12 months.
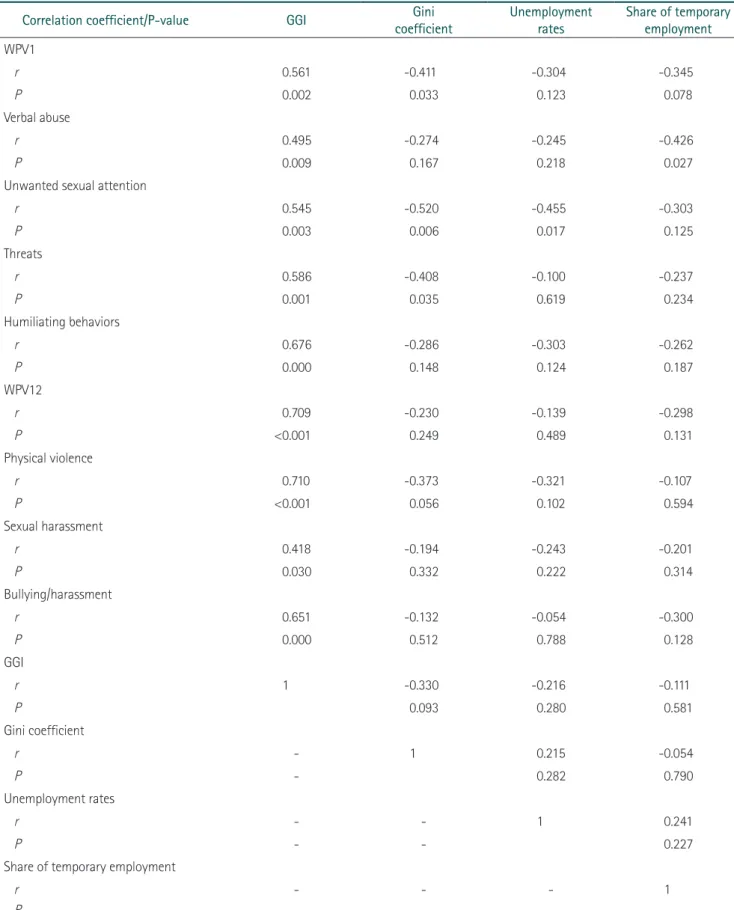
Table 4. Spearman correlation matrix of workplace violence and covariates
Correlation coefficient/P-value GGI Gini
coefficient Unemployment
rates Share of temporary employment WPV1
r 0.561 -0.411 -0.304 -0.345
P 0.002 0.033 0.123 0.078
Verbal abuse
r 0.495 -0.274 -0.245 -0.426
P 0.009 0.167 0.218 0.027
Unwanted sexual attention
r 0.545 -0.520 -0.455 -0.303
P 0.003 0.006 0.017 0.125
Threats
r 0.586 -0.408 -0.100 -0.237
P 0.001 0.035 0.619 0.234
Humiliating behaviors
r 0.676 -0.286 -0.303 -0.262
P 0.000 0.148 0.124 0.187
WPV12
r 0.709 -0.230 -0.139 -0.298
P <0.001 0.249 0.489 0.131
Physical violence
r 0.710 -0.373 -0.321 -0.107
P <0.001 0.056 0.102 0.594
Sexual harassment
r 0.418 -0.194 -0.243 -0.201
P 0.030 0.332 0.222 0.314
Bullying/harassment
r 0.651 -0.132 -0.054 -0.300
P 0.000 0.512 0.788 0.128
GGI
r 1 -0.330 -0.216 -0.111
P 0.093 0.280 0.581
Gini coefficient
r - 1 0.215 -0.054
P - 0.282 0.790
Unemployment rates
r - - 1 0.241
P - - 0.227
Share of temporary employment
r - - - 1
P - - -
GGI, Gender Gap Index; WPV1, workplace violence over the past month; r, rho; P, P-value; WPV12, workplace violence over the 12 months.
minimum values of WPV1 were 15.4%, 26.5%, and 4.7%, re- spectively, and those of WPV12 were 6.3%, 13.7%, and 1.0%, respectively. The average GGI was 0.745. Finland and Norway had the highest gender equality level (0.850), and Turkey had a GGI of 0.624. The average Gini coefficient was 0.305, with the highest (0.404) in Turkey (largest income inequality) and the lowest (0.250) in Slovakia and Slovenia. The average un- employment rate was 9.0%, with the highest (25.1%) in Greece
and the lowest (3.7%) in Korea. The average share of tempo- rary employment was 13.1%, with 28.0% in Poland, and 2.1%
in Lithuania.
Table 4 shows the bivariate correlation matrix from Spear- man’s correlation analysis. The prevalence of workplace vio- lence and GGI showed a statistically significant positive corre- lation. In more gender-equal countries with a higher GGI, the prevalence of workplace violence tended to be higher (WPV1,
0.6 30
20
10
0.9
Prevalenceof verbalabuse(%)GGI 0
0.7 0.8
r=0.495 (P-value: 0.009)r Partial =0.429 (P-value: 0.037)
0.6 20 15
5 10
0.9
Prevalenceofthreats(%)
GGI 0
0.7 0.8
r=0.586 (P-value: 0.001)r Partial =0.525 (P-value: 0.009)
0.6 10
5
0.9
Prevalenceof physicalviolence(%)GGI 0
0.7 0.8
r=0.710 (P-value: <0.001)r Partial =0.657 (P-value: 0.001)
0.6 20 15
5 10
0.9
Prevalenceof bullying/harassment(%)GGI 0
0.7 0.8
r=0.651 (P-value: <0.001) Partial =0.628 (P-value: 0.001)r
0.6 10
5
0.9
Prevalenceofunwanted sexualattention(%)GGI 0
0.7 0.8
r=0.545 (P-value: 0.003)r Partial =0.436 (P-value: 0.033)
0.6 20 15
5 10
0.9
Prevalenceof humiliatingbehaviors(%)GGI 0
0.7 0.8
r=0.676 (P-value: <0.001)r Partial =0.629 (P-value: 0.001)
0.6 10
5
0.9
Prevalenceof sexualharassment(%)GGI 0
0.7 0.8
r=0.418 (P-value: 0.03)r Partial =0.351 (P-value: 0.092)
0.6
30
20
10
0.9
PrevalenceofWPV1(%)
GGI 0
0.7 0.8
r=0.561 (P-value: 0.002) Partial =0.475 (P-value: 0.019)r
0.6 20
15
10
5
0.9
PrevalenceofWPV12(%)
GGI 0
0.7 0.8
Korea Southern Europe
Northern Europe Western Europe Eastern Europe
r=0.709 (P-value: <0.001)rPartial =0.692 (P-value: <0.001)