DOI : 10.3341/jkos.2008.49.5.771
광간섭단층촬영으로 측정한 시신경유두형태 및 망막신경섬유층지표와 시야검사와의 상관관계
성민철1,2․최재완2,3․이주은2․김수현4․이창환2․국문석2
한양대학교 의과대학 구리병원 안과학교실1, 울산대학교 의과대학 서울아산병원 안과학교실2,
한길안과병원3, 강남밝은세상안과의원4
목적 : 광간섭단층촬영기(optical coherence tomography, OCT)로 측정한 시신경 유두형태 관련지표들과 망막신 경섬유층 관련지표들의 녹내장 진단능력을 비교하고, 시야검사 지표와의 상관관계를 알아 보고자 하였다.
대상과 방법 : 녹내장 56안, 정상안 65안에서 시야검사와 OCT를 시행하고, fast optic disc algorithm과 fast RNFL thickness algorithm 지표들의 민감도와 특이도를 Receiver operating characteristic (ROC) 곡선으로 평가하고, 시야검사 지표와의 관계를 선형 및 로그회귀분석으로 분석하였다.
결과 : ROC 곡선 아래 면적값은 fast optic disc algorithm에 의한 지표들의 경우 0.78~0.79, fast RNFL thickness algorithm 지표들의 경우 0.74~0.81의 범위였다. OCT 각 지표들과 시야검사 지표 사이의 상관관계 분석은 선형 및 로그회귀분석에서 모두 통계적으로 유의하였다(p<0.001).
결론 : OCT의 두 algorithm 상의 지표들은 유사한 진단 능력과, 구조 기능 사이의 상관 관계 분석시 유사한 정도의 상관관계를 보였다.
<한안지 49(5):771-777, 2008>
<접수일 : 2007년 5월 29일, 심사통과일 : 2007년 12월 27일>
통신저자 : 국 문 석
서울시 송파구 풍납동 388-1 울산대학교 서울아산병원 안과 Tel: 02-3010-3677, Fax: 02-470-6440 E-mail: [email protected]
* 인도 첸나이에서 2006년 열린 SEAGIG (south east asia glaucoma interest group)에서 포스터로 발표되었음.
녹내장은 시신경과 망막신경섬유층(retinal nerve fiber layer, RNFL)의 선택적이고 국소적인 손상으 로 시작되어 시야 손상으로 이어지는 진행성 질환을 말 한다.1 이러한 녹내장은 비가역적 질환이기 때문에 조 기발견과 조기치료로 손상의 진행을 막는 것이 매우 중 요하다. 시신경유두를 평가하기 위해 전통적으로 사용 되어 온 방법에는 세극등을 통한 시신경 검사, 시신경유 두 입체사진측정법, 그리고 망막신경섬유층 촬영 검사 등 이 있다. 그렇지만 이런 방법들은 해석이 주관적이고 정량 적 계측이 어려워, 최근에는 객관적이고 정량적인 시신경 유두 형태의 측정과 망막신경섬유층 두께 측정을 위해 광 간섭단층촬영(optical coherence tomography, OCT), 주사레이저편광측정계(scanning laser polarimetry,
SLP) 그리고 공초점주사레이저편광계(confocal scanning laser ophthalmoscopy, CSLO) 등이 임상에서 많 이 이용되고 있다. 이 중에서 OCT는 파장 820 nm 근 처의 적외선 계열의 레이저 광선을 이용하여 망막시신 경섬유층의 두께를 10 µm 내외의 우수한 해상력으로 측정할 수 있어 녹내장으로 인한 망막신경섬유층 손상 의 진단에 널리 이용되고 있다.2,3
흔히 녹내장 진단을 위하여 사용되는 OCT의 모드 중에는 fast optic disc algorithm과 fast RNFL thickness algorithm이 있다. 이 중 녹내장의 진단 과 관련한 보고들에서는 fast RNFL thickness algorithm을 사용한 보고가 대부분을 차지하며, fast optic disc algorithm을 사용한 보고는 상대적으로 적은 편이다. 국내에서는 Sim and Park4에 의하여 fast optic disc algorithm에 의하여 측정된 각 지표 들에 의한 진단적 능력에 대한 보고가 있었다.
Manassakorn et al5에 의한 보고에서는 fast optic disc algorithm 역시 fast RNFL thickness algorithm과 비슷한 정도의 진단적 능력을 가지고 있 으며 이 두 가지 모드를 다 사용하는 것이 진단적 능력 을 높일 수 있을 것이라고 하였다.
녹내장으로 인한 구조적 손상과 기능적 손상과의 관
련성에 대한 문제 역시 최근에 많은 관심의 대상이 되 고 있는 부분이다.6,7 기존의 구조 기능적 손상의 연관 성에 대한 논의들은 주로 SLP 및 OCT 등에 의하여 계측된 망막신경섬유층의 두께와 관련한 것이었다.7,8 시신경유두형태의 계측 지표와 시야 검사 지표와의 관 련성에 대한 기존의 논의는 주로 HRT와 관련된 것이 었고, 최근의 한 보고에서 HRT의 시신경유두형태 계 측 지표와 시야 검사 지표 사이에는 SLP와 매우 유사 한 상관관계가 있음이 알려졌다.9 OCT의 경우 fast optic disc algorithm에서 시신경유두형태에 대한 여러 가지 지표들이 있음에도 불구하고, 이러한 지표를 이용하여 구조적 손상과 기능성 손상 사이의 연관성을 분석한 연구는 상대적으로 적은 편이다.
이에 본 연구는 OCT를 이용한 fast optic disc algorithm과 fast RNFL thickness algorithm에 서 측정된 주요한 지표들에 의한 진단적 유용성을 조사 하고, 이러한 변수들과 시야 검사 지표 사이의 상관관 계를 알아 보고자 하였다.
대상과 방법
본 연구는 서울아산병원 안과에서 녹내장으로 진단 받은 56안과 정상안 65안을 대상으로 한 후향적 의무 기록 분석에 의한 단면 연구이다. 모든 환자들은 시행 되는 검사에 대하여 설명을 받고 동의를 하였고, 모든 검사 과정 및 분석은 Declaration of Helsinki에 의 거하여 시행되었다. 각 환자들은 기본적인 세극등을 이 용한 전안부 및 시신경 유두 검사, 골드만 압평안압계 를 이용한 안압 측정, 굴절검사, 각막두께 검사 외에도 Humphrey 자동시야검사계(Carl Zeiss Meditec, Dublin, CA, USA)를 이용한 24-2 full threshold test, 그리고 OCT 검사(Stratus OCTⓇ, Carl Zeiss Meditec, Dublin, CA, USA)를 시행하였다.
녹내장 환자군과 정상 대조군에 대한 포함 기준은 다 음과 같다. 녹내장 환자의 진단 기준은 1) 안압과 상관 없이 시신경유두의 국소 결손 및 증가된 시신경유두 함 몰 등 기존의 알려진 전형적인 녹내장형 시신경유두 모 양을 가지고; 2) 구면렌즈 대응치 값이 ±5 디옵터 이내 이고, 난시가 3 디옵터 이내이면서, 최대 교정시력이 20/30 이상이고; 3) 양안 모두 세극등 검사 및 전방각 경 검사상 정상 소견을 보이는 경우; 4) 시야검사상 (1) Glaucoma Hemifield Test (GHT) 상 outside normal을 보이거나; (2) pattern standard deviation (PSD) 또는 corrected pattern standard deviation (CPSD)가 정상의 5% 이하로 편위된 경우이거나;
(3) pattern deviation probability map에서 인
접한 세 개 이상의 점의 역치가 정상의 5% 미만에서 나타나거나, (4) 두 개 이상의 점의 역치가 2% 미만인 경우; (5) 시야 검사상 지표에서 주시 상실이 20% 미 만이고, 가음성 반응과 가양성 반응이 15% 미만인 경 우로 신뢰할 만한 경우로 정의하였다. 정상 대조군은 녹내장이나 망막 병변, 안구 내 수술력 등 과거력이 없 으며 다음에 열거한 경우에 해당되었다. 1) 안압은 21 mmHg 이하이면서 녹내장성 시신경 유두 손상의 소견 이 없으며; 2) 구면렌즈 대응치값이 ±5 디옵터 이내이 고, 난시가 ±3 디옵터 이내이면서, 최대교정시력이 20/30 이상이고; 3) 양안 모두 세극등 검사 및 전방각 경 검사상 정상 소견을 보이는 경우이고; 4) 시야 검사 소견이 정상이면서 상기에서 언급한 바와 같은 신뢰도 를 가진 경우로 정의하였다.
본 연구 분석에 포함된 OCT 상의 지표들은 시신경 유두형태와 망막신경섬유층과 관련된 지표 중 시신경유 두의 면적이나 폭과 관련된 지표 및 신경섬유층의 두께 를 반영하는 지표들만을 사용하였다. 즉, fast optic disc algorithm에서는 vertical integrated rim area (VIRA), horizontal integrated rim width (HIRW), 그리고 rim area 지표를 포함하였고, fast RNFL thickness algorithm에서는 average RNFL thickness, superior average, 그리고 inferior average 지표를 포함하였다. 이러한 지표들 이 녹내장군과 정상 대조군을 감별하는 능력을 평가하고 자 ROC (receiver‐operating‐characteristic) 곡선을 사용하였고, 이를 이용하여 각 cut-off 값에서 의 민감도와 특이도를 계산하였다. 각 지표에 따른 ROC 곡선 아래의 면적 (Area Under ROC curve, AUROC)을 Medcalc 8.0 프로그램(Medcalc software, Belgium)에 내장되어 있는 comparison of ROC curve 모듈을 이용하여 비교하였다. 또한, 녹 내장군과 정상 대조군을 통합한 군에서 본 연구에서 사 용된 OCT상 주요 지표와 시야 검사 지표(mean deviation [MD], pattern standard deviation [PSD]) 사이의 상관 관계를 선형 (linear) 및 로그 (logarithmic) 회귀분석을 시행하여 분석하였다.
결 과
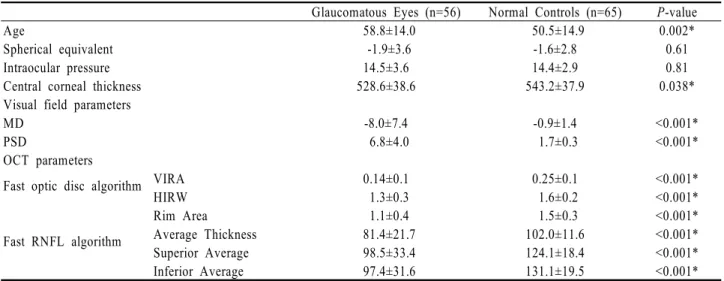
녹내장군의 평균연령은 58.8±14.0세였고, 정상군은 50.5±14.9세였다. 녹내장군과 정상군 사이 굴절력과 안압은 통계적으로 유의한 차이가 없었으나, 중심각막 두께는 녹내장군 528.6±38.6 µm, 정상군 543.2±37.9 µm로 두 군 사이에서 통계적으로 유의한 차이가 있었 다. 시야검사상 MD 값은 녹내장군이 -8.0±7.4, 정상
Glaucomatous Eyes (n=56) Normal Controls (n=65) P-value
Age 58.8±14.0 50.5±14.9 0.002*
Spherical equivalent -1.9±3.6 -1.6±2.8 0.61
Intraocular pressure 14.5±3.6 14.4±2.9 0.81
Central corneal thickness 528.6±38.6 543.2±37.9 0.038*
Visual field parameters
MD -8.0±7.4 -0.9±1.4 <0.001*
PSD 6.8±4.0 1.7±0.3 <0.001*
OCT parameters
Fast optic disc algorithm VIRA 0.14±0.1 0.25±0.1 <0.001*
HIRW 1.3±0.3 1.6±0.2 <0.001*
Rim Area 1.1±0.4 1.5±0.3 <0.001*
Fast RNFL algorithm Average Thickness 81.4±21.7 102.0±11.6 <0.001*
Superior Average 98.5±33.4 124.1±18.4 <0.001*
Inferior Average 97.4±31.6 131.1±19.5 <0.001*
Abbreviations: MD=mean deviation; PSD=pattern standard deviation; OCT=optical coherence tomography; VIRA=vertical integrated rim width; HIRW=horizontal integrated rim width; * P<0.05, independent samples t-test.
Table 1. Descriptive statistics for demographics and clinical characteristics of the study patients
AUROC±SE Sensitivity at Fixed Specificity (95% CI)
80% 90%
Fast optic disc algorithm VIRA 0.79±0.04 69.6 (55.9-81.2) 53.6 (39.7-67.0)
HIRW 0.79±0.04 71.4 (57.8-82.7) 62.5 (48.5-75.1)
Rim Area 0.78±0.04 62.5 (48.5-75.1) 55.4 (41.5-68.7)
Fast RNFL algorithm Average Thickness 0.81±0.04 73.2 (59.7-84.2) 64.3 (50.4-76.6)
Superior Average 0.74±0.05 57.1 (43.2-70.3) 42.9 (29.7-56.8)
Inferior Average 0.81±0.04 75.0 (61.6-85.6) 57.1 (43.2-70.3)
Abbreviations: VIRA=vertical integrated rim width; HIRW=horizontal integrated rim width; RNFL=retinal nerve fiber layer.
Table 2. The area under ROC curve (AUROC) and the sensitivity at 80% and 90% specificity of the parameters from the fast RNFL algorithm and from the fast optic disc algorithm
군이 -0.9±1.4, CPSD는 녹내장군이 6.8±4.0, 정상 군이 1.7±0.3으로 녹내장군과 정상 대조군 사이에서 유의한 통계적 차이가 있었다. 본 연구에서 사용된 OCT 상의 모든 지표들도 두 군 사이에서 유의한 차이 가 관찰되었다(Table 1).
본 연구에서 정의된 녹내장군을 진단하기 위하여 시 행한 ROC 곡선을 이용한 분석 결과는 다음과 같다.
AUROC 값은 VIRA, HIRW, rim area, average RNFL thickness, superior average, 그리고 inferior average 각 지표에 대하여 0.79±0.04, 0.79±0.04, 0.78±0.04, 0.81±0.04, 0.74±0.05, 그 리고 0.81±0.04였으며 각 지표에 따른 AUROC 값 사이에 유의한 차이는 없었다(Table 2, Fig. 1).
VIRA, HIRW, rim area, average RNFL thickness, superior average, 그리고 inferior average 각 지표에 대한 민감도는 다음과 같다. 특이 도를 80%에 고정시킨 경우의 민감도는 69.6%, 71.4%, 62.5%, 73.2%, 57.1%, 그리고 75.0%였으
며, 특이도를 90%에 고정시킨 경우의 민감도는 53.6%, 62.5%, 55.4%, 64.3%, 42.9%, 그리고 57.1%였다.
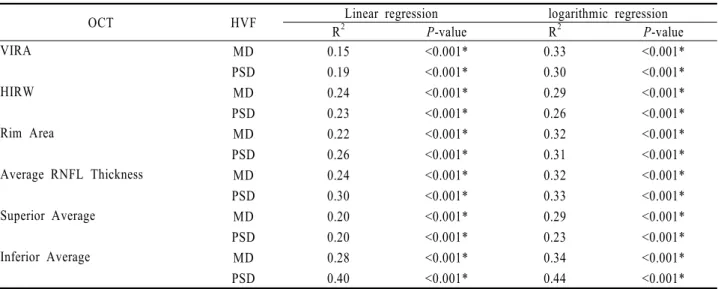
녹내장군과 정상군을 모두 합한 군에서 OCT 상의 지표들과 시야 검사상의 MD, PSD 값 사이의 회귀분 석을 시행한 결과 모든 조합에서 통계적으로 유의한 결 과를 얻을 수 있었다(p<0.001). Fast optic disc algorithm에서 얻어진 VIRA, HIRW, 그리고 rim area는 MD값에 대하여 선형 회귀분석에서 0.15, 0.24, 0.22, 로그 회귀분석에서 0.33, 0.29, 0.32의 R2 값을 나타내었다. 또한 PSD 값에 대하여서는 선형 회귀분석에서 0.19, 0.23, 0.26, 로그 회귀분석에서 0.30, 0.26, 0.31의 R2 값을 나타내었다. Fast RNFL thickness algorithm에서 얻어진 average RNFL thickness, superior average 그리고 inferior average는 MD 값에 대하여 선형 회귀분석 에서는 0.24, 0.20, 0.28, 로그 회귀분석에서 0.32, 0.29, 0.34의 R2 값을 나타내었고, PSD 값에 대하여
OCT HVF Linear regression logarithmic regression
R2 P-value R2 P-value
VIRA MD 0.15 <0.001* 0.33 <0.001*
PSD 0.19 <0.001* 0.30 <0.001*
HIRW MD 0.24 <0.001* 0.29 <0.001*
PSD 0.23 <0.001* 0.26 <0.001*
Rim Area MD 0.22 <0.001* 0.32 <0.001*
PSD 0.26 <0.001* 0.31 <0.001*
Average RNFL Thickness MD 0.24 <0.001* 0.32 <0.001*
PSD 0.30 <0.001* 0.33 <0.001*
Superior Average MD 0.20 <0.001* 0.29 <0.001*
PSD 0.20 <0.001* 0.23 <0.001*
Inferior Average MD 0.28 <0.001* 0.34 <0.001*
PSD 0.40 <0.001* 0.44 <0.001*
Abbreviations: OCT=optical coherence tomography; VIRA=vertical integrated rim width; HIRW=horizontal integrated rim width;
RNFL=retinal nerve fiber layer; * P<0.001, linear or logarithmic regression analysis.
Table 3. Linear and logarithmic regression analysis between the OCT parameters and the Humphrey visual field (HVF) indices in glaucomatous and normal eyes
Figure 1. Receiver operating characteristic curves for the parameters from the fast retinal nerve fiber layer algorithm and from the the fast optic disc algorithm for the detection of glaucoma; Abbreviations: VIRA, vertical integrated rim width; HIRW, horizontal integrated rim width.
서는 선형 회귀분석에서 0.30, 0.20, 0.40, 로그 회귀 분석에서 0.33, 0.23, 0.44의 R2 값을 나타내었다 (Table 3).
고 찰
본 연구는 광간섭단층촬영을 이용한 fast optic
disc algorithm 상의 시신경유두형태 측정 지표들과 fast RNFL thickness algorithm에서 측정된 망막 신경섬유층 측정 지표들에 의한 진단적 능력을 비교하 고, 시야검사 지표와의 상관관계를 알아보고자 하였다.
광간섭단층촬영의 여러 지표들이 녹내장의 진단능력 을 평가한 이전 논문들에서는 하측의 망막신경섬유층 두께가 초기 및 중기 녹내장과 정상안을 감별하는데 가
장 뛰어나다는 보고가 있었다.10-12 Medeiros et al13 은 하측 망막 신경섬유층과 평균망막신경섬유층 두께 측정값이 높은 AUROC 값을 가지고 녹내장안과 정상 안을 감별할 수 있는 능력을 가지고 있다고 하였다. 본 연구에서도 하측 평균망막신경섬유층 두께 측정값이 평 균망막신경섬유층 두께 측정값과 함께 AUROC 값이 가장 컸다. 특이도를 90%로 고정했을 때 민감도는 평 균망막신경섬유층 두께 측정값이 가장 높았다. Fast optic disc algorithm의 VIRA, HIRW, 그리고 Rima area의 AUROC 값은 fast RNFL algorithm 의 측정값과 유사한 높은 값을 보여주었고, 특이도를 80%, 90%로 고정했을 때 민감도도 fast RNFL thickness algorithm의 측정값과 유사한 값을 보여 주어 fast optic disc algorithm의 VIRA, HIRW, Rim area가 녹내장 환자를 진단하는 데 있어 fast RNFL thickness algorithm의 측정값과 유사한 진 단능력을 가지고 있음을 알 수 있었다.
Fast optic disc algorithm 상의 시신경유두형태 지표들과 fast RNFL thickness algorithm의 측정 값들은 모두 Humphrey 시야검사의 MD, PSD 값과 선형 및 로그 회귀분석상에서 유의한 상관관계를 보여 주었다. 이것으로 구조적 손상을 반영하는 광간섭단층 촬영의 결과가 기능적 손상을 반영하는 시야검사의 결 과와 유의한 상관관계를 가짐을 알 수 있었다.
OCT는 해상력이 우수하여 미세한 조직을 측정할 수 있고, 망막의 단층상을 직접 측정할 수 있으므로 기 준면이 필요하지 않으며, 굴절 상태와 안축장에 영향 을 받지 않는 것으로 알려져 있다.14 다양한 OCT algorithm이 시신경과 망막의 평가에 이용되고 있
고,15-17 이중 녹내장의 진단에 사용되는 것으로 fast
RNFL thickness 와 fast optic disc algorithm 이 있다.13,18-20.
OCT와 여러 녹내장 검사를 비교한 연구에서 OCT 가 높은 민감도와 특이도를 가짐이 입증되었지만,10 녹 내장 진단에 사용되는 이 두 가지 algorithm이 녹내장 진단 능력에 관하여 어떠한 차이가 있는가에 대한 연구 는 비교적 적은 편이다.
Medeiros et al13은 녹내장을 진단함에 Fast optic disc algorithm parameter와 fast RNFL thickness algorithm parameter의 AUROC 사이 에 통계적으로 유의한 차이가 없어, 두가지 algorithm 의 parameter를 모두 이용하는 것이 녹내장 진단의 정확성을 향상시킬 수 있을 것이라고 하였고, Wollstein et al18도 optic nerve head (ONH) parameter, peripapillary NFL thickness, macular volume 과 macular thickness의 녹내장 진단능력을 비교한
연구에서 ONH parameter가 peripaillary NFL thickness 와 비슷한 정도의 진단적 능력을 가지고 있 으며 이 두 가지 모드를 다 사용하는 것이 진단적 능력 을 높일 수 있을 것이라고 보고하였고, 이는 본 연구의 결과와 일치하였다.
녹내장의 진행에 있어 시신경축삭의 소실은 시신경 유두의 형태학적 변화나 시야의 변화보다 먼저 발생하
고21,22 이는 망막신경섬유층 두께의 감소로 나타나23 망
막신경섬유층 두께 측정은 녹내장 조기진단을 위한 검 사로서 중요성이 점차 높아지고 있다. 망막신경섬유층 두께의 측정이 많은 임상가들에게 녹내장성 손상의 정 도를 평가함에 많은 정보를 제공하지만 시신경유두의 형태변화의 측정 역시 녹내장 평가에 중요하다. 광간섭 단층촬영의 fast optic disc algorithm은 시신경유 두의 형태에 대한 객관적이고 정량적인 측정값을 제공 한다. 물론 시신경 유두주위 위축등에 의해 fast optic disc algorithm의 시신경유두형태 분석시 오류가 발 생할 수 있지만 시신경 유두주위 위축이 fast optic disc algorithm의 결과에 미치는 영향을 분석했던 Lai et al19의 보고에 의하면 기계에 의해 자동적으로 측정된 fast optic disc algorithm의 측정값들은 상 당히 정확하고, 수동적으로 보정된 방법에 의해 측정된 값들과 높은 상관관계를 나타낸다고 하였다.
결론적으로 광간섭단층촬영으로 측정한 망막신경섬 유층 평균 두께 지표와 fast optic disc algorithm 상에서 측정된 시신경유두형태 지표들은 비슷한 진단적 능력을 보여 주었고, 시야 검사의 지표들과도 모두 유 의한 상관관계를 보여 주어 녹내장의 구조‐기능적인 관계 분석에 있어 유용하게 사용될 수 있을 것으로 생 각된다.
참고문헌
1) Sommer A, Miller NR, Pollack I, et al. The nerve fiber layer in the diagnosis of glaucoma. Arch Ophthalmol 1977;95:
2149-56.
2) Zangwill LM, Williams J, Berry CC, et al. A comparison of optical coherence tomography and retinal nerve fiber layer photography for detection of nerve fiber layer damage in glaucoma. Ophthalmology 2000;107:1309-15.
3) Kim JM, Park KH, Kim TW, Kim DM. Comparison of the results between Heldelberg Retina Tomograph II and Stratus Optical Coherence Tomography in Glaucoma. J Korean Ophthalmol Soc 2006;47:556-62.
4) Sim JO, Park CK. Optic nerve head analysis obtained by optical coherence tomography for the diagnosis of glaucoma in Koreans. J Korean Ophthalmol Soc 2004;45:1885-92.
5) Manassakorn A, Nouri-Mahdavi K, Caprioli J. Comparison of
retinal nerve fiber layer thickness and optic disk algorithms with optical coherence tomography to detect glaucoma. Am J Ophthalmol 2006;141:105-15.
6) Garway-Heath DF, Holder GE, Fitzke FW, Hitchings RA.
Relationship between electrophysiological, psychophysical, and anatomical measurements in glaucoma. Invest Ophthalmol Vis Sci 2002;43:2213-20.
7) Schlottmann PG, De Cilla S, Greenfield DS, et al. Relationship between visual field sensitivity and retinal nerve fiber layer thickness as measured by scanning laser polarimetry. Invest Ophthalmol Vis Sci 2004;45:1823-9.
8) Leung CK, Chong KK, Chan WM, et al. Comparative study of retinal nerve fiber layer measurement by StratusOCT and GDx VCC, II: structure/function regression analysis in glaucoma.
Invest Ophthalmol Vis Sci 2005;46:3702-11.
9) Reus NJ, Lemij HG. Relationships between standard automated perimetry, HRT confocal scanning laser ophthalmoscopy, and GDx VCC scanning laser polarimetry. Invest Ophthalmol Vis Sci 2005;46:4182-8.
10) Zangwill LM, Bowd C, Berry CC, et al. Discriminating between normal and glaucomatous eyes using the Heidelberg retinal tomography, GDx nerve fiber analyzer, and optical coherence tomograph. Arch Ophthalmol 2001;119:985-93.
11) Bowd C, Sangwill LM, Berry CC, et al. Detecting early glaucoma by assessment of retinal nerve fiber layer thickness and visual function. Invest Ophthalmol Vis Sci 2001;42:
1993-2003.
12) Kanamori A, Nakamura M, Escano MF, et al. Evaluation of the glaucomatous damage on retinal nerve fiber layer thickness measured by optical coherence tomography. Am J Ophthalmol 2003;135:513-20.
13) Medeiros FA, Zangwill LM, Bowd C, et al. Evaluation of retinal nerve fiber layer, optic nerve head, and macular
thickness measurements for glaucoma detection using optical coherence tomography. Am J Ophthalmol 2005;139:44-55.
14) Schuman JS, Tamar PK, Hertzmark E, et al. Reproducibility of nerve fiber layer thickness measurements using optical coherence tomography. Ophthalmology 1996;103:1889-98.
15) Schuman JS, Hee MR, Arya AB, et al. Optical coherence tomography: a new tool for glaucoma diagnosis. Curr Opin Ophthalmol 1995;6:89-95.
16) Wang M, Luo R, Liu Y. Optical coherence tomography and its application in ophthalmology. Yan Ke Xue Bao 1998;14:
116-20.
17) Baumal CR. Clinical applications of optical coherence tomography. Curr Opin Ophthalmol 1999;10:182-8.
18) Wollstein G, Ishikawa H, Wang J, et al. Comparison of three optical coherence tomography scanning areas for detection of glaucomatous damage. Am J Ophthalmol 2005;139:39-43.
19) Lai E, Wollstein G, Price LL, et al. Optical coherence tomography disc assessment in optic nerves with peripapillary atrophy. Ophthalmic Surg Lasers Imaging 2003;34:498-504.
20) Schuman JS, Wollstein G, Farra T, et al. Comparison of optic nerve head measurements obtained by optical coherence tomography and confocal scanning laser ophthalmoscopy. Am J Ophthalmol 2003;135:504-12.
21) Quigley HA, Katz J, Derrick RJ, et al. An evaluation of optic disc and nerve fiber layer examinations in monitoring progression of early glaucoma damage. Ophthalmology 1992;99:
19-28.
22) Sommer HA, Quigley HA, Robin AL, et al. Evaluation of nerve fiber layer assessment. Arch Ophthalmol 1984;102:
1766-71.
23) Tuulonen A, Airaksinen PJ. Initial glaucomatous optic disc and retinal nerve fiber layer abnormalities and their progression.
Am J Ophthalmol 1991;111:485-90.
=ABSTRACT=
The Relationship Between Parameters Measured by Optical Coherence Tomography and Visual Field Indices
Min Cheol Seong, M.D.1,2, Jae Wan Choi, M.D.2,3, Joo-Eun Lee, M.D.2, Soo Hyun Kim, M.D.4, Chang Hwan Lee, M.D.2, Michael S. Kook, M.D.2
Department of Ophthalmology, Hanyang University College of Medicine, Guri Hospital1, Gyeonggi, Korea Department of Ophthalmology, Ulsan University, College of Medicine, Asan Medical Center2, Seoul, Korea
Hangil Eye Hospital3, Incheon, Korea Kangnam BS Eye Center4, Seoul, Korea
Purpose: To evaluate the diagnostic ability of optic disc topographic parameters and the retinal nerve fiber layer (RNFL) thickness parameter measured by optical coherence tomography (OCT) and to determine the association of these structural parameters with visual field indices.
Methods: Fifty-six glaucomatous eyes and 65 healthy control eyes were enrolled in this retrospective cross-sectional study. Each subject had a 24-2 full threshold test on a Humphrey visual field analyzer and an optical coherence tomographic evaluation. The parameters from the fast RNFL thickness algorithm and the fast optic disc algorithm were analyzed by an ROC curve, and we sought to determine the association of these parameters with visual field indices by linear and logarithmic regression.
Results: The area under the receiver operating characteristic curve (AUROC) value of the fast optic disc algorithm parameters ranged from 0.78 to 0.79 and that of the fast RNFL thickness algorithm parameters ranged from 0.74 to 0.81. The associations between the parameters from the fast optic disc algorithm and from the fast RNFL thickness algorithm with visual field indices were statistically significant (P<0.001).
Conclusions: The fast optic disc algorithm and the fast RNFL algorithm revealed comparable diagnostic ability in discriminating glaucoma and significant associations with visual field indices.
J Korean Ophthalmol Soc 49(5):771-777, 2008
Key Words: Fast optic disc algorithm, Optical coherence tomography, Retinal nerve fiber layer, Structure‐
function association
Address reprint requests to Michael S. Kook, M.D.
Department of Ophthalmology, Ulsan University, College of Medicine, Asan Medical Center
#388-1 Pungnap-dong, Songpa-gu, Seoul 138-736, Korea
Tel: 82-2-3010-3677, Fax: 82-2-470-6440, E-mail: [email protected]