Diabetes is rapidly increasing worldwide.
According to the International Diabetes Federation, the number of diabetic patients in 2011 was esti- mated to be over 300 million 6 man.1 Asia is a region that has been contributing greatly to this global increase in diabetes, since China and India
are the world’s most populous countries and they also show the most rapid increase of diabetes due to recent economic growth and Westernization.
South Korea, also part of Asia, has also showed an explosive increase in the prevalence rate of diabetes in this context, thus resulting in 6 to 7
Original Article
Obesity and Insulin Resistance According to Age in Newly Diagnosed Type 2 Diabetes Patients in Korea
Ju Won Lee, Nam Kyu Kim, Hyun Joon Park, Jun Yeob Lee, Seon Yoon Choi, Eun Mi Lee, So Young Ock, Su Kyoung Kwon, Young Sik Choi, Bu Kyung Kim
Department of Internal Medicine, College of Medicine, Kosin University, Korea
Objectives: With the rapid increase in the prevalence of diabetes, the age groups of diabetic patients are becoming diversified. This study will examine the degree of obesity, insulin resistance, and insulin secretion ability among patients first diagnosed with diabetes according to age and gender.
Methods: The subjects of this study included 616 patients who were first diagnosed with diabetes during a routine physical examination. This sample was obtained from a total of 28,075 adults aged 19 years and older who received the examination among 33,829 participants in the Korea National Health & Nutrition Examination Survey (KNHANES) from 2007–2010. The subjects were categorized by age into young age (age: 19 – 39 years), middle age (age: 40 – 59 years), and old age (age: 60 years and older). The degree of obesity was categorized according to body mass index (BMI) into normal weight (BMI: 18.5 ~ 22.9), overweight (BMI: 23 ~ 24.9), and obesity (BMI: 25 or above). Insulin resistance was evaluated by homeostatic model assessment of insulin resistance (HOMA-IR).
Results: It was found that 14.1% (n = 87) of a total of 616 subjects (324 men, 292 women) were in the young age group, 43.8% (n = 270) were in the middle age group, and 42.1% (n = 259) were in the old age group.
In addition, 83.3% of men that were overweight or obesity were in the young age group, while 79.2% and 60.5% were in the middle age and old age groups, respectively. A total of 82.2% of women that were overweight or obesity were in the young age group, while 79.5% and 77% were in the middle age and old age groups, respectively. For men, the more obesity they were in all age groups, the higher their HOMA-IR. For women, the more obesity they were in the young age and middle age groups, the higher their HOMA-IR; however, women in the old age group showed the highest HOMA-IR when they were of normal weight.
Conclusion: Among diabetic patients first diagnosed with the disease in Korea, the youth population had the highest obesity rate. Insulin resistance increases as an individual’s weight increases among those patients who are first diagnosed with diabetes; the only exception noted is for elderly women.
Key Words: Diabetes, degree of obesity, insulin resistance
Corresponding Author: Bu Kyung Kim, Department of Internal Medicine Devision of Endocrinology and Metabolism, College of Medicine, Kosin University, 262, Gamcheon-ro, Seo-gu, Busan 49267, Korea Tel: +82-51-990-6532 Fax: +82-51-990-3065 E-mail: [email protected]
Received:
Revised:
Accepted:
Jun. 03, 2015 Nov. 19, 2015 Dec. 10, 2015
times more patients being diagnosed with diabetes in the last 40 years.2,3
According to the Korea National Health &
Nutrition Examination Survey, diabetes preva- lence among the elderly population (those aged 60 years or older) is maintained at a similar level with 15.1 - 19.9% from the first survey in 1998 to the fourth survey in 2007.4 The fact that there is almost no change in the diabetes prevalence rate in relevant age groups, despite the rapid in- crease in the elderly population and the overall increase in diabetes prevalence, indicates that the prevalence rate is increasing among the younger population.5 In fact, according to the 2010 Korea National Health & Nutrition Examination Survey, diabetes prevalence among those aged 30 – 44 is 3.5%.6 Thus, the increase of diabetes in the younger population has contributed greatly to the explosive growth in the prevalence of diabetes in South Korea.
The increase in diabetes among the younger population has ultimately diversified the age groups of diabetic patients, but there is hardly any research on the characteristics of Korean diabetic patients by age group. The clinical characteristics of Korean-type diabetes in the past showed that most of the patients were non-obese, and the main pathological physiology was insulin secretion dis- order due to defects in beta cells rather than in- sulin resistance. However, with the recent increase in diabetes among the younger population, as well as the increase in diabetes caused by obesity, this pathological physiology cannot be limited as a
characteristic of Korean-type diabetes alone. This study will examine the degree of obesity and in- sulin resistance among patients first diagnosed with diabetes according to age and gender.
MATERIALS AND METHODS
1. Subjects
This study analyzed the results of the data ob- tained from 2007 – 2010 based on the raw data from the Korea National Health & Nutrition Examination Survey, which is conducted and na- tionally disclosed by the Ministry of Health and Welfare. The Ministry of Health and Welfare in Korea has been conducting this national nutrition survey since 1970, and the Korea Institute for Health and Social Affairs has been conducting the national health and health awareness/behavior survey since 1989. These two different surveys be- came integrated in 1998, to constitute the Korea National Health & Nutrition Examination Survey, which is classified into a Health Interview, Nutrition Survey, and Health Examination. This study is conducted on adults aged 19 years or older who completed the Health Interview and Health Examination. Among those subjects with diabetes who completed the Health Interview and Health Examination in the Korea National Health &
Nutrition Examination Survey from 2007 – 2010, those who had already been diagnosed with dia- betes were excluded. The diagnostic criteria for diabetic patients include those in treatment for
diabetes, or those who were found to have a fast- ing blood glucose of 126㎎/㎗ or higher during the Health Examination. Newly diagnosed dia- betic patients are those diagnosed with diabetes for the first time during the Health Examination, and they excluded those already receiving treat- ment for diabetes.
2. METHODS
This study classified the subjects into age groups and weight groups (according to each patient’s degree of obesity), and analyzed the character- istics of each group according to gender.
1) Classification by age
Age groups have no standardized criteria for classification and they were thus classified as fol- lows, solely as a matter of convenience: young age, 19 – 39 years; middle age, 40 – 59 years; and old age, 60 years or older.
2) Physical measurements and classification of the degree of obesity
A nurse that received special education pertain- ing to the Korea National Health & Nutrition Examination Survey measured the patients’
heights using SECA 225 and their weights using the digital scale, GL-6000-20. The measurements included waist measurement, body mass index (BMI), blood pressure, fasting blood glucose, fast- ing plasma insulin, glycated hemoglobin, total cholesterol, neutral fat, and high-density lip- oprotein cholesterol.
The degree of obesity was classified as follows, per BMI (body mass index: kg/m²), according to the standards set forth by the Korean Society for the Study of Obesity: normal weight, 18.5 < BMI
< 23; overweight, 23 ≤ BMI < 25; and obese, BMI
≥ 25
3) Measurement of insulin resistance and insulin secretion ability
Insulin resistance and insulin secretion ability were calculated using homeostatic model assess- ment (HOMA).7
3. Statistical analysis
The average of each variable according to age group was compared using analysis of variance (ANOVA), and statistical significance was tested using Scheffé’s method. All measurements are represented in the form of mean ± standard devi- ation, and they were considered statistically sig- nificant when the P - value was < 0.05. Analysis was conducted using SPSS for Windows (version 20.0; SPSS Inc., Chicago, IL, USA).
RESULTS
1. Demographic and clinical characteristics ac- cording to subjects’ age
Among the 33,829 subjects who participated in the fourth (2007 – 2009) Korea National Health
& Nutrition Examination Survey, 28,075 were par- ticipants aged 19 years or older. Furthermore,
2,109 (7.5%) of the 28,075 subjects were diabetic patients, and 620 (29.4%) of those were newly di- agnosed patients; 1,489 patients were already in treatment for diabetes. The subjects of this study were newly diagnosed diabetic patients (616 out of 620), excluding 4 patients who did not have BMI measurements.
The patients’ average age was 35.06 ± 3.92 years for those in the young age group, 50.34 ± 5.64 years for the middle age group, and 70.13
± 6.64 years for the old age group. The subjects’
BMI was 26.89 ± 4.70 ㎏/㎡ for the young age group, 25.59 ± 3.25 ㎏/㎡ for the middle age
group, and 24.60 ± 3.30 ㎏/㎡ for the old age group, and there was a statistically significant dif- ference among the three groups. The HOMA-IR was 5.00 ± 4.05 for those in the young age group, 4.70 ± 3.53 for the middle age group, and 4.89
± 4.71 for the old age group, and there were no statistically significant differences among the three groups. HOMA β-cells were highest in the young age group at 87.94 ± 77.40 and lowest in the middle age group at 58.13 ± 40.92, and there was a significant difference among the three groups (Table 1).
Young age 19 ~ 39 yrs (n = 87, 14.1%)
Middle age 40 ~ 59 yrs (n = 270, 43.8%)
Old age 60 ~ yrs (n = 259, 42.1%)
P - value
Age (yr) 35.06 ± 3.92 50.34 ± 5.64 70.13 ± 6.64 0.000 a,b,c
Height (cm) 164.72 ± 9.36 163.47 ± 8.32 157.75 ± 9.49 0.000 b,c
Weight (Kg) 73.09 ± 14.47 68.65 ± 11.58 61.35 ± 10.29 0.000 a,b,c
AC (cm) 88.11 ± 11.38 87.31 ± 8.87 86.90 ± 9.47 0.590
BMI (kg/㎡) 26.89 ± 4.70 25.59 ± 3.25 24.60 ± 3.30 0.000 a,b,c
FBS (mg/dL) 145.4 ± 56.65 153.53 ± 42.52 139.64 ± 35.29 0.001 c
HbA1c (%A1c) 7.20 ± 2.02 7.38 ± 1.74 6.95 ± 1.33 0.015 c
Systolic BP (mmHg) 119.03 ± 16.54 125.81 ± 16.61 133.23 ± 18.84 0.000 a,b,c Diastolic BP (mmHg) 80.60 ± 12.96 83.15 ± 10.09 77.85 ± 10.34 0.000 c Total cholesterol (mg/dL) 202.14 ± 33.73 205.70 ± 38.87 199.18 ± 41.04 0.162
HDL (mg/dL) 47.55 ± 10.51 47.71 ± 11.44 47.47 ± 12.38 0.972
Triglyceride (mg/dL) 188.5 ± 147.82 213.12 ± 167.75 172.91 ± 132.78 0.009 c
HOMA-IR 5.00 ± 4.05 4.70 ± 3.53 4.89 ± 4.71 0.797
HOMA β-cell 87.94 ± 77.40 58.13 ± 40.92 70.67 ± 47.05 0.000 a,b,c Data are mean ± standard deviation.
AC, abdominal circumference; FBS, fasting plasma sugar; HbA1C, hemoglobin A1c; HOMA-IR, [Fasting insulin (IU/mL) × fasting plasma glucose (mmol/L)] / 22.5; HOMA β-cell, [20 × fasting plasma insulin (IU/mL)] / [fasting plasma glucose (mmol/L) - 3.5];
a, young age group and middle age group, P < 0.05;
b, young age group and old age group, P < 0.05;
c, middle age group and old age group, P < 0.05 Table 1. Baseline characteristics according to age group
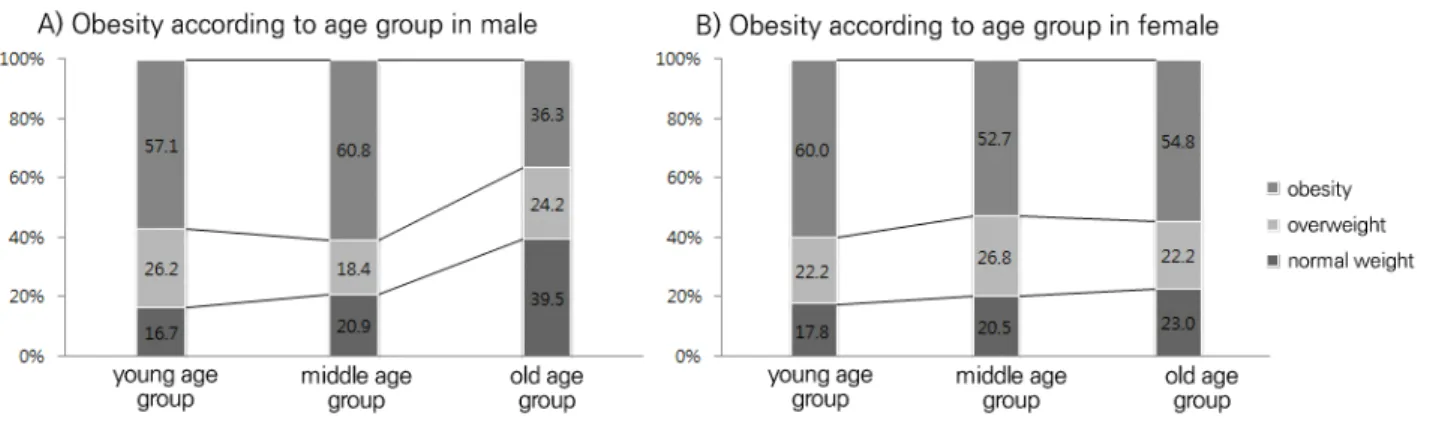
2. Obesity rate according to gender and age The 616 research subjects were divided accord- ing to gender (324 men and 292 women) to analyze the degree of obesity. The obesity rate of each generation of male diabetic patients was as fol- lows: normal weight (n = 7; 16.6%), overweight (n = 11; 26.2%), and obesity (n = 24; 57.2%) in the young age group (n = 42); normal weight (n
= 33; 20.9%), overweight (n = 29; 18.4%), and obe- sity (n = 96; 60.7%) in the middle age group (n
= 158); and normal weight (n = 49; 39.5%), over- weight (n = 30; 24.2%), and obesity (n = 45; 36.3%) in the old age group (n = 124). The obesity rate of each generation of female diabetic patients was as follows: normal weight (n = 8; 17.8%), over- weight (n = 10; 22.2%), and obesity (n = 27; 60.0%) in the young age group (n = 45); normal weight (n = 23; 20.5%), overweight (n = 30; 26.8%), and obesity (n = 59; 52.7%) in the middle age group (n = 112); and normal weight (n = 31; 23.0%), over- weight (n = 30; 22.2%), and obesity (n = 74; 54.8%) in the old age group (n = 135).
In both men and women, higher age was asso- ciated with a higher ratio of normal weight and
a lower ratio of overweight or obesity. The obesity rate was highest in the middle age group of men, while it was highest in the young age group for women (Fig. 1).
3. Insulin resistance according to gender, age, and degree of obesity
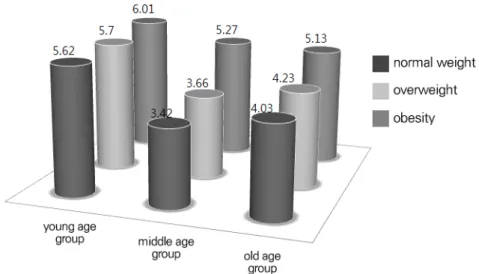
For men, the more obesity they were (in all age groups), the higher their insulin resistance.
HOMA-IR in the young age group was 5.62 among those of normal weight, and 6.01 among those who were considered obese; HOMA-IR in the middle age group was 3.42 among those of normal weight, and 5.27 among those who were considered obese;
and HOMA-IR in the old age group was 4.03 among those of normal weight, and 5.1 among those who were considered obesity (Fig. 2).
For women, the more obesity they were in the young age and middle age groups, the higher their insulin resistance (normal weight, 2.91 and 3.28;
overweight, 4.02 and 3.76; and obesity, 4.64 and 6.04, respectively). However, in the old age group, insulin resistance was highest among those of normal weight (normal weight, 7.06; overweight,
Fig. 1. Obesity according to age group in male and female.
4.42; and obese, 3.58) (Fig. 3).
4. Relationship between insulin resistance and insulin secretion ability according to gender, age, and degree of obesity
Men first diagnosed with diabetes tended to show an increase in insulin secretion as a reward for the increase of insulin resistance in all age groups. Only those in the young age group and with normal weight showed a decrease in insulin
secretion ability despite the increase in insulin resistance (Fig. 4).
For women, insulin secretion ability was highest in the young age group, regardless of insulin re- sistance among all BMI groups (normal weight, overweight, and obese), while it was lowest in the old age group (Fig. 5).
DISCUSSION
Fig. 2. HOMA-IR according to age group in male.
Fig. 3. HOMA-IR according to age group in female.
The prevalence rate of diabetes has been rap- idly increasing in the last 30 years. Diabetes prev- alence in Korea, as first surveyed in 1971, was merely 1.5% in adults aged 30 years or older.8 However, the results of the fourth Korea National Health & Nutrition Examination Survey showed that diabetes prevalence in adults aged 30 years or older increased from 9.9% in 2007–2009 to 12.4% in 2011, which proves that the number of diabetic patients in Korea increased by a magni- tude of 6 – 7 times in the last 30 years.2,5-7 A total of 14.1% (n = 87) of newly diagnosed diabetic pa- tients in this study were in the young age group, which is considerably high when compared to the report that only 2.6% of all diabetic patients are in their 30s.2 The diabetes prevalence among those in the young age group was high because
the subjects of this study were newly diagnosed patients who did not know they had diabetes prior to completing the survey. According to data rleased in 2012 by the Korean Diabetes Association, the diabetes recognition rate of peo- ple aged 30 – 44 years is 54.4%, indicating that about half (45.6%) of them were unaware that they had diabetes.6 Therefore, the ratio of those in the young age group may have been higher in this study than in the actual diabetic population.
The overweight and obesity rates among those with a BMI of 23 ㎏/㎡ or higher were 83.3%, 79.2%, and 60.5% for those in the young age, middle age, and old age groups for men, and 82.2%, 79.5%, and 77.0% in the same groups for women, re- spectively, showing that it was highest in the young age group for both men and women. These Fig. 4. Relationship between insulin resistance and insulin secretory function according to obesity and age group in male.
Y-N : young normal, Y-OW : young overweight, Y-O : young obesity M-N : middle normal, M-OW : middle overweight, M-O : middle obesity O-N : old normal, O-OW : old overweight, O-O : old obesity
figures are higher than the overweight and obesity rate (70.2%) announced by Song et al.,9 in 2007.
The more interesting thing is that in the study by Song et al.,10 the obesity rate among those with a BMI of 25 ㎏/㎡ or higher was 42.5%, but in this study, the rate was similar in old age (60 years or older), as highlighted by an obesity rate of 36.3% for men; this rate increased rapidly to 57.1%
among men and 60.0% among women in the young age group.
Insulin resistance increased in all ages of men if they were more obesity. Insulin resistance in the same weight group was highest in the young age group. According to Rhee et al.,11 diabetic patients who present with metabolic syndrome show a clear decrease in their insulin secretion
ability and an increase in their insulin resistance;
however, those not accompanied by metabolic syndrome showed only a decrease in insulin se- cretion ability without an increase in insulin resistance. This suggests that, assuming the obese group is more likely to be accompanied by meta- bolic syndrome, patients that are more obese tend to show increased insulin resistance.
Interestingly, insulin resistance was highest for women of normal weight in the old age group in this study. This result implies that if diabetes is newly developed in women of older ages, even if these individuals are of normal weight, they are more likely to present with underlying diseases that may increase insulin resistance. One example may be that these women use steroids to treat Fig. 5. Relationship between insulin resistance and insulin secretory function according to obesity and age group in female.
Y-N : young normal, Y-OW : young overweight, Y-O : young obesity M-N : middle normal, M-OW : middle overweight, M-O : middle obesity O-N : old normal, O-OW : old overweight, O-O : old obesity
arthritis or malignant diseases, which sub- sequently increases their insulin resistance.
An outbreak of type 2 diabetes is caused by an increase in insulin resistance followed by a de- crease in insulin secretion ability.12 If insulin re- sistance continues, β-cells are exhausted by glu- cose toxicity, fat toxicity, and a disorder of proin- sulin biosynthesis, and if the insulin secretion in- crease is not enough to make up for the increase in insulin resistance, it leads to diabetes.9,13,14 Therefore, if insulin resistance is high or if the β-cells’ ability is not high, diabetes is likely to occur. One of the causes for this explosive growth of diabetes in Asian countries, which are rela- tively non-obese, can be explained by the thrift phenotype hypothesis. The thrift phenotype hy- pothesis states that when there is a nutrient defi- ciency during the fetal stage (when β-cell differ- entiation is active), it renders pancreas differ- entiation insufficient. As the child becomes an adult, and he or she falls into an environment that results in insulin resistance, he or she cannot discharge enough insulin, thus resulting in diabetes.15
South Korea is a country that has achieved eco- nomic growth at the world’s most rapid speed.
It had remained one of the world’s least devel- oped countries until the 1970s, but as it devel- oped into an advanced society starting from 1990, only very few people were exposed to extreme poverty. Thus, diabetes occurring in old age can be explained by the thrift phenotype hypothesis, in which the amount of β-cells is insufficient,
while unlike the above, diabetes occurring in young age is likely to be caused by insulin resist- ance due to obesity. This assumption was proven in women. For men, they showed an increase in insulin resistance if they were obese regardless of age (Fig. 4), while for women, insulin secretion ability decreased from young age to middle age, and then in old age regardless of weight (Fig. 5).
The limitation of this study is that it only com- pared insulin resistance with fragmentary HOMA-IR. Moreover, the HOMA method is an in- dex that reflects insulin resistance in a relatively accurate manner, but it is not as accurate as in- sulin clamp or intravenous glucose load. None- theless, this study holds significance, as it showed that the degrees of obesity and insulin resistance vary according to gender and age in patients first diagnosed with diabetes in Korea. Moreover, this study used the data of the Korea National Health
& Nutrition Examination Survey, and thus the representativeness of these data is reliable, and the results can be analyzed as characteristics of all diabetic patients in Korea.
As diabetes prevalence increases in younger ages in Korea, the demographic characteristics of diabetic patients are becoming more diverse.
Therefore, it is important to clarify diabetes characteristics according to patients’ gender, age, and degree of obesity. It is also essential that the most suitable treatments for individual pa- tients are established accordingly. It is necessary to secure additional information on the patho- logical physiology of diabetes, as well as on any
suitable drugs, according to patients’ demographic characteristics through further investigations.
REFFRENCES
1. Lam DW, LeRoith D. The worldwide diabetes epidemic. Curr Opin Endocrinol Diabetes Obes 2012;19:93-6.
2. Kim DJ. The epidemiology of diabetes in Korea.
Diabetes Metab J 2011;35:303-8.
3. Kim JH, Kim DJ, Jang HC, Choi SH. Epidemiology of micro- and macrovascular complications of type 2 diabetes in Korea. Diabetes Metab J 2011;35:571-7.
4. The Korea Centers for Disease Control and Prevention. Korean National Health and Nutrition Examination Survey. 2009.
5. Kim SG, Choi DS. Epidemiology and current status of diabetes in Korea. Hanyang Medical Rev 2009;29:122-9.
6. Korean diabetes association. Diabetes fact sheet in Korea. 2012.
7. Matthews DR, Hosker JP, Rudenski AS, Naylor BA, Treacher DF, Turner RC. Homeostasis model assessment: insulin resistance and beta-cell function from fasting plasma glucose and insulin concentrations in man. Diabetologia 1985;28:
412-9.
8. Kim KS, Choi CH, Lee DY, Kim EJ. Epidemiological study on diabetes mellitus among rural Korean.
J Korean Diabetes Assoc 1972;1:17-24.
9. Leahy JL. Natural history of beta-cell dysfunction in NIDDM. Diabetes Care 1990;13:992-1010.
10. Song KE, Kim DJ, Park JW, Cho HK, Lee KW, Hub KB. Clinical Characteristics of Korean Type 2 Diabetic Patients According to Insulin Secretion and Insulin Resistance. J Korean Diabetes Assoc 2007;31:123-9.
11. Rhee SY, Chon S, Oh S, Kim SW, Kim JW, Kim YS, et al. Insulin secretion and insulin resistance in newly diagnosed, drug naive prediabetes and type 2 diabetes patients with/without metabolic syndrome. Diabetes Res Clin Pract 2007;76:
397-403.
12. DeFronzo RA. Pathogenesis of type 2 diabetes mellitus. Med Clin North Am 2004;88:787-835, ix.
13. Kahn SE. Clinical review 135. The importance of beta-cell failure in the development and pro- gression of type 2 diabetes. J Clin Endocrinol Metab 2001;86:4047-58.
14. Rhee SY, Kwon MK, Park BJ, Chon S, Jeong IK, Oh ST, et al. Differences in insulin sensitivity and secretory capacity based on OGTT in sub- jects with impaired glucose regulation. Korean J Intern Med 2007;22:270-4.
15. Hales CN, Barker DJ. Type 2 (non-in- sulin-dependent) diabetes mellitus: the thrifty phenotype hypothesis. Diabetologia 1992;35:
595-601.