pISSN 2383-899X eISSN 2234-7631
Introduction
In Korea, the obesity rate among children and adolescents is 15.3%
and is steadily increasing.1 Twenty-five percent of boys are over- weight, which exceeds the Organization for Economic Cooperation and Development average of 23%.2 These phenomena are largely at- tributed to westernized dietary habits and insufficient exercise. Par- ticular attention is required because 60% of obese children and ado- lescents will exhibit adult obesity and because obesity has negative effects such as a psychological loss of self-esteem.3 In addition, ac- cording to the 2012 citizen health statistics data, 7.3% of children aged 6–11 years and 17.0% of adolescents aged 12–18 years suffered from insufficient nutrient intake in Korea, and 8.4% and 7.4% of in-
dividuals in the same age groups, respectively, had excessive energy and fat intakes; as a consequence, 15.7% of kindergarteners and younger elementary school students and 24.4% of older elementary school students suffered from defective or excessive nutrient intake.4
Because obesity in children should not be treated or managed with medication, in contrast to adults, exercise practice, dietary habits, and lifestyles must be changed, and parental interests and efforts are essential to this process. Obese children exhibit characteristic eating behaviors such as irregular meals, overeating, increased intake of processed and instant foods, and rapid eating speeds.5 During child- hood, systematic nutritional management via an accurate eating be- havior analysis can promote the acquisition of nutrient-related knowledge and quickly and effectively promote positive attitudes to-
Evaluation of Eating Behavior and Nutritional Status Using the Nutrition Quotient in Obese Children
Hee-Sook Lim1,2,*, Soon-Kyung Kim3, Yoon-Hyung Park1, Young-Lim Shin4
1Department of Preventive Medicine, Soonchunhyang University College of Medicine, Cheonan; 2Department of Clinical Nutrition, Soonchunhyang University Bucheon Hospital, Bucheon; 3Department of Food Sciences & Nutrition, Soonchunhyang University, Asan; 4Department of Pediatrics, Soonchunhyang University College of Medicine, Soonchunhyang University Bucheon Hospital, Bucheon, Korea
Background: The increasing incidence of pediatric obesity has recently emerged as a social problem, and children’s eating behaviors and nutri- tional statuses directly affect health. Obesity prevention and treatment must involve dietary life management. Despite the importance of special- ized, accurate eating behavior and nutritional status evaluations of obese children, available study tools in Korea are lack.
Methods: Obesity index, blood parameters, and nutrient intake were evaluated in 64 obese children (29 boys, 35 girls) at a university hospital childhood and adolescent obesity clinic; eating behaviors and nutritional statuses were evaluated using a recently developed and validated Korean nutrient quotient (NQ) for children.
Results: The subjects’ mean age was 9.7±1.8 years, and the mean obesity index was 132.8%±17.2%. Moderate or severe obesity (P<0.001) was significantly more frequent among girls. Nutrient intake analyses revealed insufficient intakes of fiber, calcium, potassium, vitamin A, and folic acid relative to recommendation. Protein and carbohydrate intakes were significantly elevated among boys and girls, respectively (P=0.001 and 0.004, respectively). The overall mean nutrition quotient score was 59.6±15.3. Diversity and practice scores were below average, and girls had significantly higher scores only in regularity (P=0.037). Severely obese children had significantly lower moderation (P=0.032), practice (P=0.005), and mean total scores (P=0.019) relative to normal weight children.
Conclusion: Specialized nutrition evaluation and mediation are essential for child obesity management. The nutrition quotient might allow more efficient evaluation of obese children.
Key words: Child obesity, Diet, Nutritional status, Eating behavior
*Corresponding author Hee-Sook Lim http://orcid.org/0000-0003-0745-8906 Department of Preventive Medicine, Soonchunhyang University College of Medicine, 31 Suncheonhyang 6-gil, Dongnam-gu, Cheonan 31151, Korea
Tel +82-32-621-5762 Fax +82-32-621-5584 E-mail [email protected] Received Nov. 2, 2015 Reviewed Dec. 3, 2015 Accepted Feb. 12, 2016
Copyright © 2016 Korean Society for the Study of Obesity
This is an Open Access article distributed under the terms of the Creative Commons Attribution Non-Commercial License (http://creativecommons.org/licenses/by-nc/4.0/) which permits unrestricted non-commercial use, distribution, and reproduction in any medium, provided the original work is properly cited.
ward dietary habits. Studies of the dietary habits and eating behav- iors of obese children have been conducted continuously. However, the results of these studies have differed somewhat because of the di- verse range of methods used to evaluate the quality of meals and nu- tritional statuses of individuals. To supplement these methods, a more convenient nutrient quotient (NQ) for children, which incor- porates the types of foods mainly consumed by children, was recent- ly developed in Korea6, and studies are attempting to incorporate this NQ. However, studies involving obese children are very insufficient.
In this study, the NQ for children was applied to obese children re- quiring aggressive nutritional mediation to determine dietary life- styles and nutritional statuses, examine the usefulness of the NQ for this population, and analyze characteristics.
Methods
1. Study subjects
Seventy-five children aged 7–12 years who visited the childhood and adolescent obesity clinic at Soonchunhyang University Bucheon Hospital, for growth evaluation, obesity examination, and requested nutritional consultation were selected as subjects. The goals and con- tents of the study and assurances of autonomy and anonymity were explained to the children and their parents. Written consent was re- ceived accordingly, and approval was received from the clinical test institute of Soonchunhyang University. Eleven children who ex- pressed intentions of refusal during the survey were excluded; as a re- sult, data for 64 children were used in the final analyses. All subjects were classified according to sex for comparison (29 boys, 35 girls).
2. Study contents and methods
1) General characteristics and obesity index
Bone age was measured to compare children’s ages and bone mat- uration. Bone age was measured using X-ray images of the left hands and carpal bones, and differences between the real and bone ages were compared. Regarding body measurements, X-SCAN PLUS II (Jawon Medical Co., Ltd, Gyeongsan, Korea) was used to measure the children’s heights, weights, body mass indices, body fat amounts, and body fat percentages; a tape measure was used to measure their waist and hip, which were subsequently used to calculate waist-hip ratio. With reference to Korean childhood and adolescent standard growth charts7, the degree of obesity was classified as mild obesity, or
20–29% according to standard weights by sex and height; moderate obesity, or 30–49%; and severe obesity, or ≥50%.
2) Blood tests
Although various blood tests were performed, only the values of 16 parameters (hemoglobin, hematocrit, serum albumin, glucose, blood urea nitrogen, creatinine, aspartate aminotransferase, alanine aminotransferase, alkaline phosphatase, lactate dehydrogenase, uric acid, cholesterol, neutral fat, high-density cholesterol, calcium, and phosphorus) were collected from medical records and used for the study survey.
3) Nutrient intake status analysis
The nutrient intake status was analyzed using a specialized nutri- ent intake analysis program (CAN-Pro 3.0; the Korean Nutrition So- ciety) after surveying 3-day meal intakes via a 24-hour recall method that involved face-to face interviews with a clinical dietitian before starting nutritional education. In addition, the energy ratios of the three major nutrients, including energy, vitamins and minerals, were calculated.
4) Evaluation of the nutrient quotient for children
The NQ for children was developed by the Korean Nutrition Soci- ety in 2012, and its validity has been verified. The quality and nutri- tional status of each meal associated with a child’s eating behavior is evaluated and scored. The NQ for children comprehensively evalu- ates whether children are consuming sufficient nutrients required for growth and development and whether they exhibit appropriate eat- ing behaviors. The NQ for children comprises five areas: balance in dietary life (five questions), diversity (three questions), moderation (five questions), regularity (three questions), and practice (three ques- tions). The scores for these five areas were converted and summed to yield overall mean scores. Based on a 100-point range, an NQ score of ≥90 is graded as “highest”, 75–89 as “high”, 25–74 as “moderate”, 10–24 as “low”, and <10 as “lowest”.8
3. Statistical analysis
All data collected for this survey were statistically processed and analyzed using SPSS for Windows, version 18.0 (SPSS, Chicago, IL, USA). The analytical results regarding the subjects’ body measure- ments, obesity indices, blood tests, nutrient intake, and NQ for chil-
dren scores are shown as means and standard deviations. Indepen- dent t-test or Mann-Whitney U test was used to compare the charac- teristics of boys with those of girls, and an one-way analysis of vari- ance (ANOVA) or Kruskal-Wallis test was used to compare the char- acteristics among the degrees of obesity according to the normality test results. The degrees of obesity are shown as numbers and per- centages of subjects and analyzed by chi-square test or Fisher’s exact test according to ratios of cells with expected frequencies <5. For all analyses, a P value <0.05 was indicative of statistical significance.
Results
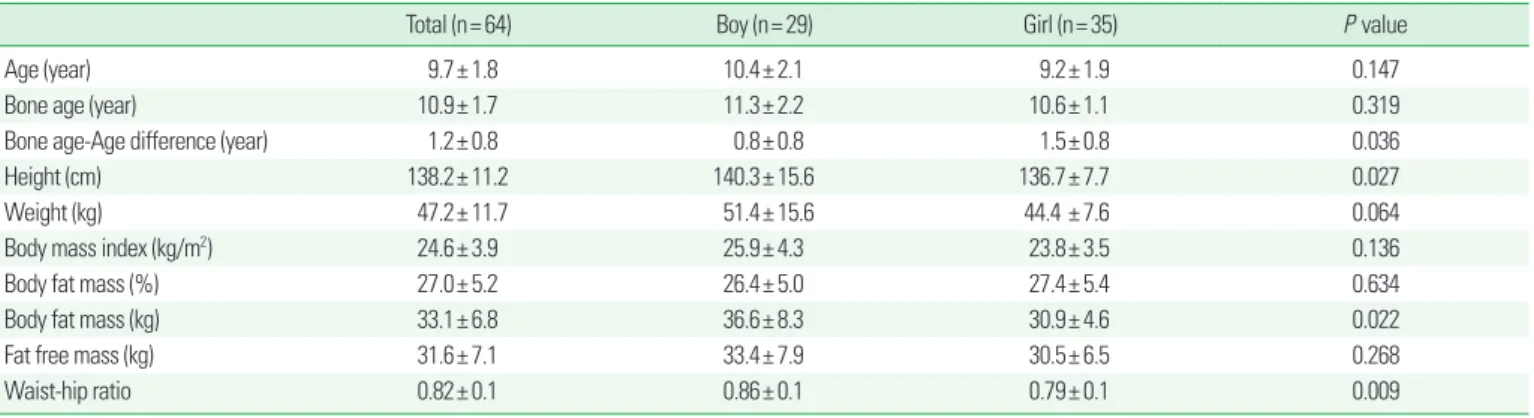
1. Evaluation of the degree of obesity among study subjects The mean age of the subjects was 9.7±1.8 years. The mean ages of boys and girls were 10.4±2.1 and 9.2±1.9 years, respectively, and this difference was not significant. The mean bone age was 10.9±1.7 years, or higher than the mean real age, and again boys and girls did not differ significantly in this aspect. The overall mean difference be- tween the bone and real ages was 1.2±0.8 years, with subgroup dif- ferences of 0.8±0.8 years for boys and 1.5±0.8 years for girls; notably, the girls had a significantly greater difference in bone age (P= 0.036).
No differences in the body mass index, body fat amount, or total
weight without fat were observed between the groups. The body fat weights of boys and girls were 36.6±8.3 and 30.9±4.6 kg, respective- ly, and this difference was significant (P= 0.022). Boys also had a higher mean waist-hip ratio (0.86±0.1) than did girls (0.79±0.1), in- dicating that boys exhibited significantly more severe abdominal obesity (P= 0.009). The mean obesity index was 132.8±17.2%, and there were no differences between boys and girls. However, when the degrees of obesity were determined, boys and girls had mild obesity rates of 44.8% and 28.6%, respectively, moderate obesity rates of 44.8% and 57.1%, respectively, and severe obesity rates of 10.4% and 14.3%, respectively, indicating that girls had significantly higher moderate and severe obesity rates (P<0.001; Tables 1 and 2).
2. Biochemical test results
When the blood test results of the total subject group, boys and girls, and subjects with varying degrees of obesity were evaluated, most results were found to be within normal ranges. However, in the case of alanine aminotransferase (ALT), the level among boys was 66.7±111.8 IU/L, or higher than the normal range (0–40 IU/L) and significantly higher than the level recorded for girls (P= 0.003). Re- garding uric acid (P= 0.030), although boys had a significantly high- er level relative to girls, the two groups remained within the normal
Table 1. General and anthropometric data of the subjects
Total (n= 64) Boy (n= 29) Girl (n= 35) P value
Age (year) 9.7± 1.8 10.4± 2.1 9.2± 1.9 0.147
Bone age (year) 10.9± 1.7 11.3± 2.2 10.6± 1.1 0.319
Bone age-Age difference (year) 1.2± 0.8 0.8± 0.8 1.5± 0.8 0.036
Height (cm) 138.2± 11.2 140.3± 15.6 136.7± 7.7 0.027
Weight (kg) 47.2± 11.7 51.4± 15.6 44.4 ± 7.6 0.064
Body mass index (kg/m2) 24.6± 3.9 25.9± 4.3 23.8± 3.5 0.136
Body fat mass (%) 27.0± 5.2 26.4± 5.0 27.4± 5.4 0.634
Body fat mass (kg) 33.1± 6.8 36.6± 8.3 30.9± 4.6 0.022
Fat free mass (kg) 31.6± 7.1 33.4± 7.9 30.5± 6.5 0.268
Waist-hip ratio 0.82± 0.1 0.86± 0.1 0.79± 0.1 0.009
All data are expressed as means± standard deviations.
P values were determined using an independent t-test.
Table 2. Obesity assessment
Total (n= 64) Boy (n= 29) Girl (n= 35) P value
Obesity index (%)* 132.8± 17.2 133.4 ± 15.4 132.4± 15.1 0.447‡
Mild obesity† 23 (35.9) 13 (44.8) 10 (28.6) 0.000§
Moderate obesity 33 (51.6) 13 (44.8) 20 (57.1)
Severe obesity 8 (12.5) 3 (10.4) 5 (14.3)
*Data are expressed as means± standard deviations; †Data are expressed as frequencies and percentages; ‡P values were determined using an independent t-test and Fisher’s ex- act test; §P values were determined using Fisher’s exact test.
range. Further analysis according to the degree of obesity revealed significantly higher ALT levels in the severe obesity group (P= 0.015;
Table 3).
3. Comparison of nutrient intake status
The overall subjects’ mean energy intake was 1,957.7±547.1 kcal, with values of 2,046.9±746.1 kcal for boys and 1851.6±348.0 kcal for girls, indicate that boys had a significantly higher intake (P= 0.014).
The protein intake values were 79.4±35.9 g for boys and 63.0±18.3 g for the girls, and again, the boys’ intake was significantly higher (P=
0.028). The carbohydrate intake values were 266.0±80.9 g for boys and 291.9±65.1 g for the girls, and here, girls had a significantly higher intake (P= 0.039). Furthermore, when compared with girls, boys had significantly higher intakes of phosphorus (P= 0.019), iron (P= 0.011), vitamin B6 (P= 0.022), niacin (P= 0.034), and cholesterol (P= 0.018). The overall mean sodium intake was 3,964.9±1,128.5 mg, with values of 4,049.4±1,240.6 mg for boys and 3,575.3±1,039.9 mg for girls; this intergroup difference was not significant. When the energy intake ratios (%) were calculated according to the intakes of carbohydrate, protein, and fat, which contribute to energy, the overall carbohydrate:protein:fat ratio was 60.4:20.9:19.9, with ratios of 57.2:
24.6:20.1 for boys and 62.8:16.9:21.3 for girls; in other words, boys had a significantly higher protein intake (P= 0.004), whereas girls had a
significantly higher carbohydrate intake (P= 0.001).
When subjects were classified according to the degree of obesity, those with severe obesity were found to have higher intakes of pro- tein, fat, fiber, calcium, iron, sodium, zinc, vitamin A, vitamin B1, vi- tamin B6, niacin, folic acid, vitamin E, and cholesterol in compari- son to the other two groups; however, only the intakes of protein (P= 0.011), fat (P= 0.023), niacin (P= 0.034), and cholesterol (P=
0.031) differed significantly. Regarding energy intake ratios, the se- vere obesity group had significantly higher protein intake ratios than did the other groups (P= 0.042; Table 4).
4. Evaluation of eating behavior using the nutrient quotient for children
Each item of the NQ for children was analyzed and compared in Table 5, and the total score distributions of the overall subjects, boys, and girls on a 100-point scale are expressed in figures for clarity. The overall subject group received a mean balance score of 62.7±15.6 points, mean diversity score of 58.4±17.7 points, mean moderation score of 64.2±11.8, mean regularity score of 61.6±19.2, and mean practice score of 57.2±18.4 points; in other words, they received rela- tively low scores for diversity and practice. In an intergroup compar- ison, boys received slightly higher scores for balance, diversity, mod- eration, and practice, whereas girls received a higher score for regu- Table 3. Biochemical data of the subjects
Total (n= 64) Sex Obesity status
Boy (n= 29) Girl ( n= 35) P value* Mild (n= 23) Moderate (n= 33) Severe (n= 8) P value†
Hemoglobin (g/dL) 130.0± 0.8 13.2± 0.9 12.9± 0.7 0.247 12.9± 0.6 13.1± 1.3 13.5± 0.9 0.499
Hematocrit (%) 37.6± 2.1 38.0± 2.4 38.2± 1.9 0.166 36.8± 1.6 38.0± 3.2 39.2± 2.2 0.141
Albumin (g/dL) 4.5± 0.2 4.5± 0.2 4.6± 0.2 0.592 4.4± 0.3 4.5± 0.1 4.6± 0.2 0.297
Glucose (mg/dL) 100.3± 10.2 101.9± 13.3 99.2± 7.7 0.095 102.2± 14.3 100.1± 9.6 102.3± 10.2 0.216
BUN (mg/dL) 12.4± 2.3 12.8± 2.2 12.2± 2.5 0.858 11.9± 2.3 12.4± 2.4 12.5± 2.1 0.752
Creatinine (mg/dL) 0.69± 0.1 0.7± 0.1 0.7± 0.1 0.663 0.7± 0.1 0.6± 0.1 0.7± 0.2 0.552
AST (IU/L) 28.9± 25.9 38.8± 39.7 22.3± 2.6 0.003 29.3± 18.9 34.9± 37.1 30.9± 37.4 0.334
ALT (IU/L) 37.4± 73.2 66.7± 111.8 18.0± 6.4 0.003 32.6± 30.7 37.4± 73.1 49.3± 106.7 0.015
ALP (IU/L) 306.7± 72.7 289.9± 79.0 317.9± 68.1 0.796 291.7± 96.1 301.6± 68.7 310.5± 81.1 0.455
LDH (IU/L) 432.0± 79.5 438.7± 95.5 447.5± 65.2 0.419 395.1± 98.8 452.7± 88.1 462.8± 66.7 0.512
Uric acid (mg/dL) 5.3± 1.2 5.7± 1.6 5.0± 0.8 0.030 5.4± 1.0 5.5± 0.9 5.7± 1.6 0.326
Cholesterol (mg/dL) 191.5± 39.3 199.6± 47.4 186.1± 33.3 0.219 188.2± 38.6 190.2± 42.6 202.3± 39.6 0.327
Triglyceride (mg/dL) 192.4± 122.8 178.9± 113.3 201.4± 131.2 0.511 184.6± 113.1 195.3± 113.1 202.8± 144.5 0.393 LDL-cholesterol (mg/dL) 128.6± 36.6 137.0± 39.4 123.1± 34.5 0.557 118.0± 39.1 125.3± 36.6 134.3± 34.1 0.214
Calcium (mg/dL) 9.5± 0.4 9.6± 0.4 9.4± 0.3 0.587 9.4± 0.4 10.0± 0.2 10.1± 0.5 0.391
Phosphorous (mmol/L) 4.9± 0.5 4.9± 0.5 4.8± 0.5 0.962 4.9± 0.5 4.9± 0.4 5.2± 0.3 0.507
All data are expressed as means± standard deviations.
*P values were determined using an independent t-test; †P values were determined using an ANCOVA adjusted for sex.
AST, aspartate aminotransferase; ALT, alanine aminotransferase; ALP, alkaline phosphatase; LDH, lactate dehydrogenase; LDL, low-density lipoprotein.
larity. Notably, the girls’ scores were only significantly higher in the regularity part (P= 0.037). The overall mean total NQ score, after summing all the items, was 59.6±15.3 points; the scores of 58.8±
13.1 points for boys and 60.2±13.7 points for girls did not differ sig- nificantly. In an analysis according to obesity degree, the severe obe- sity group received significantly lower moderation (P= 0.032), regu- larity (P= 0.003) and mean total scores (P= 0.019) relative to the oth- er two groups (Table 5 and Fig. 1).
Discussion
In recent years, the dietary lifestyles of children have undergone rapid changes, which have exacerbated the related problems of nutri- tional imbalance and obesity in this population.9 In addition, man- agement of environmental factors, such as eating habits or exercise, has been identified as more important than immutable genetic fac- tors.10 Therefore, pediatric obesity treatment should preferably pro- Table 4. Nutrient intake statuses of the subjects
Total (n= 64) Sex Obesity status
Boy (n= 29) Girl (n= 35) P value* Mild (n= 23) Moderate (n= 33) Severe (n= 8) P value† Energy (kcal) 1,957.7± 547.1 2,046.9± 764.1 1,851.6± 348.0 0.014 1,856.6± 307.7 2,057.9± 765.3 2,013.2± 553.9 0.394
Protein (g) 67.2± 26.3 79.4± 35.9 63.0± 18.3 0.028 68.9± 8.8 77.1± 23.5 85.1± 34.3 0.011
Fat (g) 52.7± 23.7 57.9± 31.4 50.7± 17.6 0.079 53.6± 15.0 60.7± 22.9 70.5± 28.4 0.023
Carbohydrate (g) 287.5± 85.9 266.0± 80.9 291.9± 65.1 0.039 253.9± 59.1 296.3± 126.8 262.0 ± 74.6 0.433
Fiber (g) 13.9± 5.0 14.8± 5.9 13.4± 4.5 0.447 13.3± 3.8 15.4± 6.8 15.6 ± 2.1 0.315
Calcium (mg) 474.5± 85.9 514.3± 235.9 448.1± 159.9 0.366 462.9± 126.4 439.4± 270.3 524.3± 72.6 0.623
Phosphorous (mg) 1,010.6± 347.3 1,085.6± 495.7 960.0± 200.3 0.019 987.8± 110.3 1,103.0± 88.5 1,001.6± 207.7 0.079
Iron (mg) 12.2± 4.6 13.8± 3.4 11.2± 2.8 0.011 12.0± 2.5 13.0± 6.1 13.1± 4.7 0.447
Sodium (mg) 3,964.9± 1128.5 4,049.4± 1,240.6 3,575.3± 1,039.9 0.267 3,405.2± 939.0 4,216.4± 1193.4 4,512.6± 298.8 0.161 Potassium (mg) 2,056.1± 665.1 2,187.7± 834.1 2,068.5± 532.9 0.386 1,798.0± 470.3 2,249.2± 746.5 2,135.3± 420.3 0.363
Zinc (mg) 8.6± 3.5 9.9± 4.3 8.4± 2.9 0.049 8.9± 1.3 9.3± 3.7 9.7 ± 0.3 0.517
Vitamin A (μgRE) 649.0± 291.3 617.6± 304.6 630.3± 281.4 0.301 543.6± 201.7 601.9± 327.9 694.1± 307.9 0.199
Vitamin B1 (mg) 1.7± 0.4 1.7± 0.2 1.6± 0.5 0.548 1.6± 0.6 1.5± 0.7 1.7± 0.5 0.635
Vitamin B2 (mg) 1.3± 0.6 1.4± 0.9 1.1± 0.3 0.096 1.0± 0.1 1.6± 1.0 1.4 ± 0.4 0.357
Vitamin B6 (mg) 1.9± 0.82 2.1± 1.1 1.8± 0.6 0.022 1.7± 0.4 1.9± 0.7 2.1 ± 0.9 0.159
Niacin (mgNE) 17.9± 7.9 19.6± 8.4 16.7± 4.3 0.034 16.1 ± 2.8 18.0± 8.9 20.5± 9.5 0.034
Vitamin C (mg) 79.1± 22.1 74.4± 23.5 85.6± 21.2 0.296 78.7± 15.8 85.9 ± 20.9 77.6± 25.8 0.407
Folic acid (mg) 201.3± 45.2 208.9± 23.4 216.2± 67.2 0.656 205.9± 86.8 185.6± 75.1 215.6± 75.4 0.308
Vitamin E (mg) 16.1± 8.1 16.8± 9.5 15.7± 7.1 0.720 17.3± 6.4 16.2± 5.5 18.6± 1.3 0.526
Cholesterol (mg) 301.3± 149.2 366.7± 136.8 298.7± 121.9 0.018 279.1± 79.3 357.8± 120.1 443.2± 175.3 0.031
Energy distribution
% Carbohydrate 60.4± 7.7 57.2± 8.2 62.8± 5.3 0.001 58.3± 6.3 59.6± 7.1 55.4± 8.5 0.435
% Protein 20.9± 3.0 24.6± 3.1 16.9± 2.5 0.004 16.9± 4.2 18.0± 2.8 22.9± 3.0 0.042
% Fat 19.9± 5.1 20.1± 6.7 21.3± 4.5 0.512 23.7± 3.8 22.4± 4.5 21.7± 6.1 0.389
All data are expressed as means± standard deviations.
*P values were determined using an independent t-test; †P values were determined using an ANCOVA adjusted for sex.
Table 5. Comparison of nutrition quotient (NQ) scores
Total (n= 64) Sex Obesity status
Boy (n= 29) Girl (n= 35) P value* Mild (n= 23) Moderate (n= 33) Severe (n= 8) P value†
Balance 62.7± 15.6 64.8± 17.6 61.5± 14.1 0.324 62.2± 12.3 57.7± 11.4 59.1± 20.7 0.387
Diversity 58.4± 17.7 59.5± 19.1 58.4± 18.4 0.123 59.8± 14.5 58.6± 21.7 59.2± 16.9 0.481
Moderation 64.2± 11.8 63.4± 14.4 62.6± 15.3 0.414 67.8± 21.1 64.1± 13.2 57.4± 12.7 0.032
Regularity 61.6± 19.2 54.7± 18.5 62.7± 16.7 0.037 62.8± 26.4 59.9± 23.6 53.0± 16.9 0.003
Practice 57.2± 18.4 57.3± 21.2 58.0± 16.8 0.469 61.2± 14.7 58.6± 15.6 56.7± 23.0 0.176
Nutrition Quotient 59.6± 15.3 58.8± 13.1 60.2± 13.7 0.145 63.6± 15.6 59.2± 14.7 57.4± 15.2 0.019
All data are expressed as means± standard deviations.
*P values were determined using the independent t-test; †P values were determined using an ANCOVA adjusted for sex.
mote growth and development along with balanced nutritional in- take and the use of physical activity to consume excessive energy, while taking growth periods into consideration.11 This study strived to apply the NQ for children to obese children in order to examine the appropriateness of eating behaviors and nutritional intake sta- tuses in this population relative to existing study results. First, when the degrees of obesity of subjects in this study were evaluated using mean body mass index results, boys and girls were found to be obese and overweight, respectively. The present subjects’ body mass index values were found to be higher than those reported for both obese boys and girls who participated in an obesity management program in a study by Kim et al.12 However, although both boys and girls were classified as obese when body fat percentages were compared, girls had slightly higher body fat percentages and higher frequencies of moderate or severe obesity according to the obesity index. These re- sults somewhat contrast the results of the 2013 citizen health nutri- tion survey in Korea, which reported higher obesity rates for boys than girls13; however, it must be noted that the sex-related obesity characteristics in this study were different from those of other stud- ies because the subjects of this study and their parents visited the hospital for a specific purpose.
According to the biochemical test results, the levels of ALT and uric acid were significantly higher in boys than in girls. Very likely, increased serum hepatic enzyme levels in obese children are caused by nonalcoholic fatty liver disease.14 In some previous studies, an in- crease in ALT consequent to fat accumulation in hepatic cells is
caused by insulin resistance and is known to be a very important factor related to an increased risk of metabolic syndrome.15,16 In ad- dition, triglyceride is a representative parameter associated with hy- perlipidemia and cardiovascular disorders, and the levels of this pa- rameter among the subjects of this study were slightly higher than the cutoff level of 150 mL/dL. Kim et al.17 observed similar results when comparing the blood properties of overweight or obese chil- dren and adolescents. In obese children, lipid and liver function tests should be monitored continuously, and more aggressive mediation may be required according to the diagnostic state.
The overall nutrient intake status was analyzed according to sex.
Overall intake values, including energy, were higher among boys than among girls, and boys had significantly higher intakes of pro- tein, phosphorus, iron, zinc, vitamin B6, niacin, and cholesterol. In contrast, girls consumed significantly more sugar than did boys. En- ergy was compared with the estimated requirement according to Korean nutrient intake standards18; the intakes of protein, calcium, phosphorus, iron, sodium, potassium, zinc, vitamin A, vitamin B1, vitamin B2, vitamin B6, niacin, vitamin C, and folic acid were com- pared with the recommended intakes; and the intakes of fiber and vitamin E were compared with sufficient intakes. Both boys and girls were found to consume more energy, protein, phosphorus, iron, so- dium, zinc, vitamin B1, vitamin B2, vitamin B6, niacin, vitamin C, and vitamin E than the standards for the corresponding age groups, whereas their intakes of fiber, calcium, potassium, vitamin A, and folic acid were insufficient. In particular, the nutrients with insuffi- cient intake were similar to those reported in studies by Kim et al.19 and Park et al.20 Regarding obese children, a balanced overall nutri- tional intake should be emphasized because nutritional excesses re- lated to irregular meals, frequent dining out, increased intakes of processed food and carbonated drinks, and insufficient vegetable in- take raise concerns that the intakes of minerals and vitamins essen- tial for growth and development might be insufficient. In addition, the relatively high carbohydrate intake rate among girls in this study suggests a correlation between excessive sugar intake and obesity and indicates that education about the allowable intakes of foods with high sugar contents is needed to prevent obesity. An evaluation of nutrition intake statuses according to the degree of obesity, which compensated for differences in sex, found significantly higher in- takes of protein, fat, niacin, cholesterol, and protein in the severe obesity group, indicating that intake patterns differ according to the Figure 1. Comparison between this study and NQ modeling.
Boy Balance
100 90 80 70 60 50 40 30 20 10 0
Diversity 61.5*
58.4*
62.6*
62.7*
58.0*
57.3 59.5
54.7 63.4
64.8
Practice
Regularity Moderation
Girl*
degrees of obesity.
Analysis of the NQ for children results revealed that the overall mean total scores were generally low, with no great differences be- tween boys and girls. Among the five areas, boys received higher scores for balance, diversity and moderation, whereas girls received slightly higher scores for regularity and practice. However, boys and girls both received low scores, and the only significant difference was observed for regularity. When compared with the results of the NQ for children obtained for elementary school students in the study by Lee et al.21, the mean score of the subjects of this study was lower than the previously reported mean score of 66.2±13.2 points, and the subjects of the present study received lower scores on all items except balance. When compared with the obese group included in the community child center study by Kim et al.4, the mean score of the subjects in the present study was slightly lower than the mean score of 59.1±14.6 points in the earlier study, although the present subjects received higher scores in the areas of balance, regularity, and moderation. An analysis according to the degree of obesity re- vealed that the moderation, practice, and total scores were signifi- cantly lower in the severe obesity group. The NQ for children scores were also lower in both the underweight and obese groups relative to the normal weight group in a study by Kim et al.4 In particular, the low practice scores same with the results of the previous study. Fur- thermore, the total score among of subjects in the present study was similar to the corresponding score in a previous study4 that analyzed the NQ according to the degree of obesity in a cohort of 152 children;
however, the subjects of the present study received relatively lower scores in the areas of moderation and regularity. Because studies in- volving the NQ for children remain in preliminary stages and few have involved obese children, it is difficult to make accurate com- parisons. However, a comprehensive evaluation of several studies re- vealed consistent trends; specifically, obese children received lower NQ for children scores than did children with normal weights, and the former also received lower practice scores. Therefore, it is very important to provide nutritional mediation with individualized im- provement goals and methods that can be continuously practiced during weight management.
In this study, the influences of various items on obesity induction, including the NQ for children, were not analyzed; this is a limitation of a retrospective study in which generalization is difficult because of the small number of subjects. However, the above results demon-
strate that the NQ for children was very helpful in providing clients with an explanation of the analytical results regarding dietary life- styles and in identifying problems that must be solved to allow obese children who require treatment-level management to stay healthy, form appropriate eating habits, and achieve a balanced nutritional intake. In addition, the significance of this study lies in the fact that its methods were actually used in a clinical field for which no stan- dardized tools were previously available. The findings of this study are expected to serve as baseline data for studies of the eating habits of obese children and should be extended to other age groups and diseases in future studies in order to lay a foundation for utilization of the NQ for children.
Conflicts of Interest
The author has no conflicts of interest to declare.
Acknowledgments
This work was supported by the Soonchunhyang University Re- search Fund.
The authors wish to thank Eun-Ae Jung librarian and Bora Lee biostatistic consultant who assisted in manuscript editing and statis- tical advice.
References
1. Ministry of Education. School health [serial online] 2015 [accessed 2014 Sep 7]; Available from: URL: http://www.moe.go.kr/web/110 501/ko/board/view.do?bbsId=348&boardSeq=60946c
2. Ministry of Health & Welfare, Korea Institute for Health and So- cial Affairs. OECD health data [serial online] 2014 [accessed 2014 Dec 26]; Available from: URL: http://stat.mohw.go.kr/front/statDa- ta/publicationView.jsp?menuId=43&topSelect=B00009&bbsSeq=9
&nttSeq=21422&searchKey=&searchWord=&nPage=1
3. Gurnani M, Birken C, Hamilton J. Childhood obesity: causes, consequences, and management. Pediatr Clin North Am 2015;62:
821-40.
4. Kim NH, Lee IS. Assessment of nutritional status of children in community child center by nutrition quotient (NQ) -Gyeongju-. J East Asian Soc Dietary Life 2015;25:73-86.
5. Kang MH, Yoon KS. Elementary school students’ amounts of sugar, sodium, and fats exposure through intake of processed food. J Korean Soc Food Sci Nutr 2009;38:52-61.
6. Kang MH, Lee JS, Kim HY, Kwon S, Choi YS, Chung HR, et al.
Selecting items of a food behavior checklist for the development of Nutrition Quotient (NQ) for children. Korean J Nutr 2012;45:
372-89.
7. Korea Centers for Disease Control and Prevention. 2007 Physical growth of children’s and adolescents in Korea [serial online] 2007 [accessed 2014 Sep 15]; Available from: URL: http://cdc.go.kr/
CDC/notice/CdcKrTogether0302.jsp?menuIds=HOME001- MNU1154-MNU0005-MNU0088&cid=9838
8. Kim HY, Kwon S, Lee JS, Choi YS, Chung HR, Kwak TK, et al.
Development of a nutrition quotient (NQ) equation modeling for children and the evaluation of its construct validity. Korean J Nutr 2012;45:390-9.
9. Kim JH, Jung YH. Evaluation of food behavior and nutritional status of preschool children in Nowon-gu of Seoul by using nutri- tion quotient (NQ). Korean J Community Nutr 2014;19:1-11.
10. Karnik S, Kanekar A. Childhood obesity: a global public health crisis. Int J Prev Med 2012;3:1-7.
11. Zhang J, Wang H, Wang Y, Xue H, Wang Z, Du W, et al. Dietary patterns and their associations with childhood obesity in China.
Br J Nutr 2015;113:1978-84.
12. Kim HG, Lim GW, Kim HS, Hong YM. Effects of a 12-week, school-based obesity management program on obese primary school children. Korean J Pediatr 2010;53:335-40.
13. Ministry of Health & Welfare, Korea Centers for Disease Control
& Prevention. Korea health statistics 2013: Korea national health
and nutrition examination survey (KNHANES VI-1). Sejong:
Ministry of Health & Welfare; 2014.
14. Calcaterra V, Muratori T, Klersy C, Albertini R, Caramagna C, Brizzi V, et al. Early-onset metabolic syndrome in prepubertal obese children and the possible role of alanine aminotransferase as marker of metabolic syndrome. Ann Nutr Metab 2011;58:307- 14.
15. Angelico F, Del Ben M, Conti R, Francioso S, Feole K, Fiorello S, et al. Insulin resistance, the metabolic syndrome, and nonalcoholic fatty liver disease. J Clin Endocrinol Metab 2005;90:1578-82.
16. Bugianesi E, Gastaldelli A, Vanni E, Gambino R, Cassader M, Baldi S, et al. Insulin resistance in non-diabetic patients with non- alcoholic fatty liver disease: sites and mechanisms. Diabetologia 2005;48:634-42.
17. Kim JH, Kim EK. The relationship among insulin resistance, blood profiles and nutrient intake in overweight or obese children and adolescents. Korean J Community Nutr 2012;17:530-42.
18. The Korean Nutrition Society. Dietary reference intakes for Kore- ans 2010 [serial online] 2010 [accessed 2015 Sep 10]; Available from: URL: http://www.kns.or.kr/Download/2010KDRIs_open_fi- nal.pdf
19. Kim JY, Han YS, Bae HS, Ahn HS. Dietary intakes and serum lip- ids and iron indices in obese children. Korean J Community Nutr 2006;11:575-86.
20. Park JK, Ahn HS, Lee DH. Dietary intakes and serum minerals composition in obese children. Korean J Obes 2001;10:156-64.
21. Lee SJ, Kim Y. Evaluation of the diet and nutritional states of ele- mentary and middle school students in the Daegu area by using nutrition quotient for children. J Nutr Health 2013;46:440-6.