© 2014 The Korean Academy of Medical Sciences.
This is an Open Access article distributed under the terms of the Creative Commons Attribution Non-Commercial License (http://creativecommons.org/licenses/by-nc/3.0) which permits unrestricted non-commercial use, distribution, and reproduction in any medium, provided the original work is properly cited.
pISSN 1011-8934 eISSN 1598-6357
Estimation of Daily Salt Intake through a 24-Hour Urine Collection in Pohang, Korea
There is an established relationship between a high salt diet and public health problems, especially hypertension and cardiovascular disease. We estimated daily salt intake in a group of adults and assessed its association with related variables in Pohang, Korea. We conducted a cross-sectional survey in 2013 with 242 adults. Urine was collected for 24 hr to estimate daily salt intake, and questionnaires about salt preference were administered.
The mean daily salt intake was 9.9 ± 4.6 g. There was no difference in salt intake between high systolic blood pressure (SBP) participants and normal SBP participants (10.5 ± 4.7 g/d vs. 9.6 ± 4.3 g/d, P = 0.339), but high diastolic blood pressure (DBP) participants reported more salt intake than normal DBP participants (10.4 ± 4.9 g/d vs. 9.7 ± 4.1 g/d, P = 0.049).
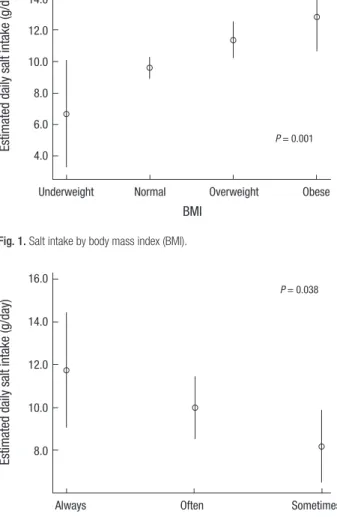
Salt intake and body mass index demonstrated a positive correlation (P = 0.001).
A preference for Korean soup or stew was associated with high salt intake (P = 0.038).
Dietary salt intake in Korean adults is still higher than the recommendation from the World Health Organization. More efforts should be made to reduce the salt consumption of Korean adults.
Keywords: Salt Intake; 24-hr Urine Collection; Hypertension; Public Health Yong Chul Kim,1 Ho Seok Koo,2
Suhnggwon Kim,3 and Ho Jun Chin4,5,6
1Department of Internal Medicine, Armed Forces Capital Hospital, Seongnam; 2Department of Internal Medicine, Seoul Paik Hospital, Inje University College of Medicine, Seoul; 3Research institute of Salt and Health, Seoul K-clinic, Seoul;
4Department of Internal Medicine, Seoul National University, Seoul; 5Department of Internal Medicine, Seoul National University Bundang Hospital, Seongnam; 6Kidney Research Institute, Seoul National University, Seoul, Korea
Received: 8 May 2014 Accepted: 7 July 2014 Address for Correspondence:
Ho Jun Chin, MD
Department of Internal Medicine, Seoul National University Bundang Hospital, 82 Gumi-ro 173beon-gil, Bundang-gu, Seongnam 463-707, Korea
Tel: +82.31-787-7025, Fax: +82.31-787-4052 E-mail: [email protected]
Funding: This study was partly supported by the research fund of the Pohang Nam-gu Health Center, Pohang, Korea.
http://dx.doi.org/10.3346/jkms.2014.29.S2.S87 • J Korean Med Sci 2014; 29: S87-90
INTRODUCTION
While sodium is an essential nutrient for humans, a high salt diet is associated with hypertension and cardiovascular disease (CVD) (1-4). Furthermore, it may be a risk factor of kidney dis- ease, osteoporosis, and even stomach cancer (5, 6). Since these diseases are a major cause of morbidity and mortality in Korea and worldwide, reductions in dietary salt intake could substan- tially reduce medical costs, and should be a public health prior- ity (7). Recent data on salt intake show that populations around the world are consuming much more salt than is physiological- ly necessary. In many cases, they are consuming much more salt than the recommendation from the World Health Organi- zation (WHO), which is 5 g salt/day (the equivalent of 2 g sodi- um/day) (8).
Salt intake can be estimated indirectly from food consump- tion data or a questionnaire as well as directly by measuring urine sodium. Due to problems with dietary surveys such as the underestimation of sodium intake, assessing 24-hr urinary sodium excretion has become the “gold standard” method of obtaining salt intake data for population surveys (9, 10).
The aim of this study was to estimate the salt intake in adults from Pohang, Korea and to compare the findings with previous
data in Korea and other countries. In addition, we analyzed whe- ther there is a correlation between daily salt intake and a prefer- ence for salty foods (11-15).
MATERIALS AND METHODS Study subjects
The baseline survey was conducted from August to December 2013. The study included 104 men and 138 women (total 242;
age range, 20-88 yr). The selected subjects comprised a repre- sentative sample of Pohang, a city in Korea that has a population of 508,736.
Assessment of salt intake
After obtaining written consent, participants were asked to col- lect all urine during a 24-hr period starting from the second urine sample on the morning of the collection day and ending with the first urine sample from the following morning. The purpose of salt intake estimation from the collected samples was not mentioned to the participants. Participants were asked to report whether the 24-hr collection was complete or not and to provide information regarding whether the urine collection day was unusual for them. At the survey site, a well-trained health ORIGINAL ARTICLE
Kim YC, et al. • Daily Salt Intake in Pohang, Korea
S88 http://jkms.org http://dx.doi.org/10.3346/jkms.2014.29.S2.S87 worker measured the total volume. Urine aliquots were stored
at -20°C before being transported to the certified laboratory.
The completeness of 24-hr urine collection was assessed by self-reported urine loss and the 24-hr urine creatinine-based method. The 24-hr urine sample was unacceptable if a partici- pant reported urine loss more than one time or if the creatinine index ([24-hr urine creatinine (mg/dL)]/[21 × body weight (kg)]) was lower than 0.7 (16).
Urinary sodium and potassium were measured by using an ion-selective electrode method (Modular DPE chemistry; Roche Diagnostics, Germany). Creatinine was measured by using the Jaffe reaction (Kinetic colorimetric assay; Roche Diagnostics, Germany).
All participants were asked to fill out a questionnaire in order to evaluate their dietary salt habits. The questions referred to whether they prefer salty foods, whether they add extra salt be- fore eating, how many times they have Korean soup or stew in one week, how many times they have processed foods, etc. We compared whether the eating habits were correlated with the actual sodium intake.
All analyses were performed by using SPSS statistics, version 20 (SPSS Inc., New York, USA).
Ethics statement
Study approval was obtained from the institutional review board (IRB) of Seoul National University Hospital (IRB No. H-1205- 121-411) and all of the participants provided written informed consent.
RESULTS
Demographic characteristics are given in Table 1. Among the 242 participants, 104 (43%) were male and the mean age was
54.8 ± 13.2 yr. Mean body mass index (BMI) was 23.5 ± 3.1 kg/m2 and among the men, 64 (26.4%) were overweight (BMI: 25.0- 29.99) and 6 (2.5%) were obese (BMI ≥ 30). Fifty-three partici- pants (21.9%) had hypertension, and the mean systolic blood pressure (SBP) and diastolic blood pressure (DBP) were 126.7 ± 15.7 mmHg and 77.4 ± 9.4 mmHg, respectively (hypertension:
SBP ≥ 130 mmHg or DBP ≥ 80 mmHg).
The average urine volume was 1,726.7 ± 621.1 mL. Urinary sodium and potassium excretion in the whole group was 170.2
± 75.9 mM/day and 68.0 ± 28.3 mM/day, respectively. The 24- hr urine sodium to potassium ratio was 2.68 ± 1.16.
The distribution of the participants and the Pohang city pop- ulation by age is given in Table 2. There seemed to be more par- ticipants over the age of 50 compared with general population distribution even though we selected a representative sample of the Pohang city population, and this sample was statistically significant (P < 0.001).
Estimated salt intake in the Pohang city population was 9.9
± 4.6 g/day. Salt intake in men (10.3 ± 4.7 g/day) was higher than that in women (9.6 ± 4.2 g/day). Overall, 87.6% of the par- ticipants (87.5% of the men and 87.7% of the women) had more salt intake than the WHO recommendation (5 g/day).
There was no difference in salt intake between high SBP par- ticipants and normal SBP participants (10.5 ± 4.7 g/d vs. 9.6 ± 4.3 g/d, P = 0.339), but high DBP participants had more salt in- take than normal DBP participants (10.4 ± 4.9 g/d vs. 9.7 ± 4.1 g/d, P = 0.049) (Table 3).
Salt intake increased as BMI increased (underweight: 6.7 ± 4.7 g/d, normal BMI: 9.6 ± 4.2 g/d, overweight: 11.7 ± 4.5 g/d, obese: 12.8 ± 2.0 g/d, P = 0.001) (Fig. 1). Participants who re- ported that they prefer a high salt diet seemed to have a higher salt intake (11.0 ± 5.1 g/day) than those who do not prefer a high salt diet (9.7 ± 4.2 g/day). This finding demonstrated mar- Table 1. Baseline characteristics of the study participants
Parameters Mean ± SD
Age (yr) 54.8 ± 13.2
Sex, male (n, %) 104 (43%)
Height (cm) 162.9 ± 7.6
Weight (kg) 62.3 ± 9.9
Body mass index (kg/m2)
Overwight (BMI: 25.0-29.99) (n, %) Obese (BMI ≥ 30) (n, %)
23.5 ± 3.1 64 (26.4%) 6 (2.5%) Hypertension (n, %)*
Systolic blood pressure (mmHg) Diastolic Blood pressure (mmHg)
53 (21.9%) 126.7 ± 15.7
77.4 ± 9.4 24 hr urine
Volume (mL) Sodium (mM/day) Potassium (mM/day) Sodium/potassium Salt (g/day) Creatinine (mg/day)
1,726.7 ± 621.1 170.2 ± 75.9
68.0 ± 28.3 2.68 ± 1.16 9.94 ± 4.56 1,271.9 ± 0.6 Data are presented as percentage, mean ± standard deviation (SD).
*Hypertension: SBP ≥ 130 mmHg or DBP ≥ 80 mmHg.
Table 2. Distribution of the participants and population of Pohang by age Sex, age Participants distribution (n, %) Population distribution* (n, %) Gender
Men Women Total
104 (43.8) 138 (57.0) 242 (100.0)
258,710 (50.9) 250,026 (49.1) 508,736 (100.0) Age (yr)
20-29 30-39 40-49 50-59 60-69
≥ 70
10 (4.1) 19 (7.9) 47 (19.4) 75 (31.0) 63 (26.0) 28 (11.6)
64,304 (12.6) 75,942 (14.9) 91,575 (18.0) 82,597 (16.2) 42,168 (8.3) 31,303 (6.2) Age (yr)
20-29 30-39 40-49 50-59 60-69
≥ 70
Men 7 (2.9) 8 (3.3) 16 (7.4) 29 (12.0) 30 (12.4) 14 (5.8)
Women 3 (1.2) 11 (4.5) 31 (12.8) 46 (19.0) 33 (13.6) 14 (5.8)
Men 36,322 (7.1) 38,583 (7.6) 45,983 (9.0) 41,612 (8.2) 20,958 (4.1) 11,674 (2.3)
Women 27,982 (5.5) 37,359 (7.3) 45,637 (9.0) 40,985 (8.1) 21,210 (4.2) 19,629 (3.9)
*Population and Housing Census 2010, Korea.
Kim YC, et al. • Daily Salt Intake in Pohang, Korea
http://jkms.org S89
http://dx.doi.org/10.3346/jkms.2014.29.S2.S87
ginal significance (P = 0.055) (Table 3). Furthermore, partici- pants who reported that they frequently consume Korean soup or stew seemed to have a high dietary salt intake (always: 11.8
± 5.4 g/day, often: 10.0 ± 4.4 g/day, sometimes: 8.2 ± 3.8 g/day, P = 0.038) (Fig. 2).
DISCUSSION
In this study, the estimated daily salt intake through 24-hr uri- nary collection among adults in Pohang was 9.9 ± 4.6 g/day (so- dium 170.2 ± 75.9 mM/day). It is almost 2-times higher than the WHO recommendation. There have been few studies on salt intake by collecting 24-hr urine. In the INTERSALT study (1988) (13), estimated daily salt intake was 12.2 ± 4.2 g among the Busan population in 1988. Furthermore, Jeong et al. (12) re- ported that daily salt intake in a representative sample of the Korean population (n = 215) was 12.7 ± 3.9 g/day. In a more re- cent study, Kim et al. (11) reported 9.7 ± 0.3 g/day as the mean salt intake of 368 subjects in Goyang city, which is similar to the results of this study. It appears that there has been a reduction in the daily salt intake in the Korean population, but it is still a
higher than that in other countries such as the US (8.2 ± 0.2 g/d, 2010, New York) (14) and the UK (8.1 ± 5.8 g/d, 2011, nation- wide) (15) (Table 4).
In Korea, salt intake is higher than that in western countries because there is a tradition of adding excessive salt to foods and consuming salty sauces. In previous studies, more than 70% of the sodium intake in Koreans was from Kimchi, Korean soup or stew, and soy sauce (12, 17, 18). In this study, a correlation was demonstrated between participants who enjoy consuming Ko- rean soup or stew and a high salt intake (Fig. 2).
The strong positive correlation between 24-hr sodium excre- tion and systolic and diastolic blood pressure is well established in many studies (13, 19). However, in this study, only DBP show- ed a positive correlation with salt intake; perhaps the number of participants was too small.
In the present study significantly higher 24-hr urinary sodi- um excretion was observed in obese participants in compari- son to normal-weight or overweight participants (Fig. 1). The high sodium intake that was observed in conjunction with high Table 3. Daily salt intake with related variables
Variables Salt intake (g/day) P
BP SBP ≥ 130 SBP < 130 DBP ≥ 80 DBP < 80
10.5 ± 4.7 9.6 ± 4.3 10.4 ± 4.9 9.7 ± 4.1
0.339 0.049 BMI
< 18.5 (underweight) 18.5-24.99 (normal weight) 25.0-29.99 (overweight)
≥ 30 (obese)
6.6 ± 4.7 9.6 ± 4.2 11.4 ± 4.5 12.8 ± 2.0
0.001
Eating habit High salt diet
Low salt diet 11.0 ± 5.1
9.7 ± 4.2
0.055
Preference with Korean soup/stew Always
Often Sometimes
11.8 ± 5.4 10.0 ± 4.4 8.2 ± 3.8
0.038
Estimated daily salt intake (g/day)
BMI
Underweight Normal Overweight Obese
16.0 14.0 12.0 10.0 8.0 6.0 4.0
P = 0.001
Fig. 1. Salt intake by body mass index (BMI).
Estimated daily salt intake (g/day)
Preference of Korean soup or stew
Always Often Sometimes
16.0
14.0
12.0
10.0
8.0
P = 0.038
Fig. 2. Salt intake by the taste preference of Korean soup or stew.
Table 4. Estimated daily salt intake in various countries
Localities Study
year Partici- pants (n)
Salt intake (g)
Total Men Women
Korea Pohang Goyang (11) Metropolitan area (12) Chungcheong-do (12) Jeolla-do (12) Gueongsang-do (12) Busan (13)
2013 2011 2005 2005 2005 2005 1988
244 368 63 40 65 37 198
9.9 ± 4.6 9.7 ± 0.3 12.1 ± 3.5 12.5 ± 4.1 13.2 ± 3.7 13.1 ± 4.7 12.2 ± 4.2
10.3 ± 4.7 10.6 ± 0.5
- - - - 13.6 ± 4.3
9.6 ± 4.2 8.9 ± 0.3
- - - - 10.8 ± 4.1 USA, New York (14) 2010 1,656 8.2 ± 0.2 9.1 ± 0.2 7.5 ± 0.3
UK (15) 2011 547 8.1 ± 5.8 9.3 ± 5.8 6.8 ± 3.6
China, Yanti (23) 2014 191 11.8 ± 4.5 12.8 ± 4.8 10.8 ± 4.1 Salt intake was calculated using the equation: 17.1 mM of sodium = 1 g of salt.
Kim YC, et al. • Daily Salt Intake in Pohang, Korea
S90 http://jkms.org http://dx.doi.org/10.3346/jkms.2014.29.S2.S87 urinary excretion in obese subjects has also been described in
many other studies (20, 21). However, several mechanisms could explain the association between sodium excretion and an in- crease in body fat. One explanation could be that a high intake of salt is the result of consuming large amounts of high-energy foods with a high salt content, which could consequently in- crease the total energy intake. Similarly, studies have shown that a high intake of salt is associated with consuming a large number of soft drinks (22).
Dietary salt intake in Korean adults is still higher than the recommendation of the WHO. Given the health concerns such as hypertension, CVD, obesity, and kidney disease that are as- sociated with excessive salt intake, it would appear that public health initiatives are needed to reduce salt consumption. The aim is to achieve an overall reduction in the Korean population’s salt intake by working directly with the food industry to reduce the amount of salt in processed foods. Indeed, campaigns are underway in many countries, such as the US National Salt Re- duction Initiative, World Action on Salt and Health (WASH, UK), and the eat low sat campaign (KFDA, Korea). Moreover, a na- tionwide survey with a 24-hr urine collection is needed to ac- curately estimate the daily salt intake in Korea.
DISCLOSURE
The authors declare that they have no conflicts of interest to disclose.
ORCID
Yong Chul Kim http://orcid.org/0000-0003-3215-8681 Ho Seok Koo http://orcid.org/0000-0001-7856-8083 Suhnggwon Kim http://orcid.org/0000-0001-6904-9126 Ho Jun Chin http://orcid.org/0000-0003-1185-2631 REFERENCES
1. Stamler J. The INTERSALT Study: background, methods, findings, and implications. Am J Clin Nutr 1997; 65: 626s-42s.
2. Sacks FM, Svetkey LP, Vollmer WM, Appel LJ, Bray GA, Harsha D, Obar- zanek E, Conlin PR, Miller ER 3rd, Simons-Morton DG, et al. Effects on blood pressure of reduced dietary sodium and the Dietary Approaches to Stop Hypertension (DASH) diet. DASH-Sodium Collaborative Research Group. N Engl J Med 2001; 344: 3-10.
3. He FJ, MacGregor GA. Effect of modest salt reduction on blood pressure:
a meta-analysis of randomized trials. Implications for public health. J Hum Hypertens 2002; 16: 761-70.
4. Cook NR, Cutler JA, Obarzanek E, Buring JE, Rexrode KM, Kumanyika SK, Appel LJ, Whelton PK. Long term effects of dietary sodium reduction on cardiovascular disease outcomes: observational follow-up of the tri- als of hypertension prevention (TOHP). BMJ 2007; 334: 885-8.
5. He FJ, MacGregor GA. A comprehensive review on salt and health and
current experience of worldwide salt reduction programmes. J Hum Hy- pertens 2009; 23: 363-84.
6. Joossens JV, Hill MJ, Elliott P, Stamler R, Lesaffre E, Dyer A, Nichols R, Kesteloot H. Dietary salt, nitrate and stomach cancer mortality in 24 countries. European Cancer Prevention (ECP) and the INTERSALT Co- operative Research Group. Int J Epidemiol 1996; 25: 494-504.
7. Brown IJ, Tzoulaki I, Candeias V, Elliott P. Salt intakes around the world:
implications for public health. Int J Epidemiol 2009; 38: 791-813.
8. Diet, nutrition and the prevention of chronic diseases. World Health Organ Tech Rep Ser 2003; 916: i-viii, 1-149, backcover.
9. Bingham SA, Williams R, Cole TJ, Price CP, Cummings JH. Reference values for analytes of 24-h urine collections known to be complete. Ann Clin Biochem 1988; 25(Pt 6): 610-9.
10. van Dam RM, Hunter D. Biochemical indicators of dietary intake. In:
Willett W, editor. Nutritional epidemiology. New York: Oxford Universi- ty Press, 1998, p174-243.
11. Rhee MY, Shin SJ, Park SH, Kim SW. Sodium intake of a city population in Korea estimated by 24-h urine collection method. Eur J Clin Nutr 2013;
67: 875-80.
12. Son SM, Park YS, Lim HJ, Kim SB, Jeong YS. Sodium Intakes of Korean Adults with 24-hour Urine Analysis and Dish Frequency Questionnaire and Comparison of Sodium Intakes According to the Regional Area and Dish Group. Korean J Community Nutr 2007; 12: 545-58.
13. Intersalt: an international study of electrolyte excretion and blood pres- sure. Results for 24 hour urinary sodium and potassium excretion. Inter- salt Cooperative Research Group. BMJ 1988; 297: 319-28.
14. Angell SY, Yi S, Eisenhower D, Kerker BD, Curtis CJ, Bartley K, Silver LD, Farley TA. Sodium Intake in a Cross-Sectional, Representative Sample of New York City Adults. Am J Public Health 2014.
15. Sadler K, Nicholson S, Steer T, Gill V, Bates B, Tipping S, Cox L, Lennox A, Prentice A. National diet and nutrition survey: assessment of dietary so- dium in adults (aged 19 to 64 yr) in England, 2011. Department of Health, London, 2012 .
16. Murakami K, Sasaki S, Takahashi Y, Uenishi K, Watanabe T, Kohri T, Ya- masaki M, Watanabe R, Baba K, Shibata K, et al. Sensitivity and speci- ficity of published strategies using urinary creatinine to identify incom- plete 24-h urine collection. Nutrition 2008; 24: 16-22.
17. Kim YS, Paik HY. Measurement of Na intake in Korean adult females.
Korean J Nutr 1987; 20: 341-9.
18. Nam HW, Lee KY. A study on the sodium and potassium intakes and their metabolism of the pregnant women in Korea. Korean J Nutr 1985;
18: 194-200.
19. O’Donnell MJ, Yusuf S, Mente A, Gao P, Mann JF, Teo K, McQueen M, Sleight P, Sharma AM, Dans A, et al. Urinary sodium and potassium ex- cretion and risk of cardiovascular events. JAMA 2011; 306: 2229-38.
20. Hoffmann IS, Cubeddu LX. Salt and the metabolic syndrome. Nutr Metab Cardiovasc Dis 2009; 19: 123-8.
21. Taylor EN, Curhan GC. Body size and 24-hour urine composition. Am J Kidney Dis 2006; 48: 905-15.
22. He FJ, Marrero NM, MacGregor GA. Salt intake is related to soft drink consumption in children and adolescents: a link to obesity? Hyperten- sion 2008; 51: 629-34.
23. Xu J, Wang M, Chen Y, Zhen B, Li J, Luan W, Ning F, Liu H, Ma J, Ma G.
Estimation of salt intake by 24-hour urinary sodium excretion: a cross- sectional study in Yantai, China. BMC Public Health 2014; 14: 136.