Onodera’s Prognostic Nutritional Index as a Risk Factor for Mortality in Peritoneal Dialysis Patients
The aim of this study was to evaluate the clinical relevance and usefulness of the Onodera’s prognostic nutritional index (OPNI) as a prognostic and nutritional indicator in peritoneal dialysis (PD) patients. Patients were divided into 3 groups based on the initial OPNI score:
group A (n = 186, < 40), group B (n = 150, 40-45), and group C (n = 186, > 45). Group A was associated with a higher grade according to the Davies risk index than the other groups. Serum creatinine and albumin levels, total lymphocyte count, and fat mass increased with an increase in OPNI. According to the edema index, the correlation coefficient for OPNI was -0.284 and for serum albumin was -0.322. Similarly, according to the C-reactive protein (CRP), the correlation coefficient for OPNI was -0.117 and for serum albumin was -0.169. Multivariate analysis adjusted for age, Davies risk index, CRP, and edema index revealed that the hazard ratios for low OPNI, serum albumin, and CRP were 1.672 (P = 0.003), 1.308 (P = 0.130), and 1.349 (P = 0.083), respectively. Our results demonstrate that the OPNI is a simple method that can be used for predicting the nutritional status and clinical outcome in PD patients.
Key Words: Onodera’s Prognostic Nutritional Index; Peritoneal Dialysis; Nutrition;
Mortality; Albumin; Edema index Seok Hui Kang, Kyu Hyang Cho,
Jong Won Park, Kyung Woo Yoon, and Jun Young Do
Division of Nephrology, Department of Internal Medicine, Yeungnam University Hospital, Daegu, Korea
Received: 3 June 2012 Accepted: 27 August 2012 Address for Correspondence:
Jun-Young Do, MD
Department of Internal Medicine, Yeungnam University Hospital, 170 Hyeonchung-ro, Nam-gu, Daegu 705-717, Korea Tel: +82.53-680-3844, Fax: +82.53-654-8386 E-mail: [email protected]
http://dx.doi.org/10.3346/jkms.2012.27.11.1354 • J Korean Med Sci 2012; 27: 1354-1358
INTRODUCTION
Malnutrition is a common unfavorable complication prevalent in peritoneal dialysis (PD) patients and is associated with mor- bidity and mortality in these patients (1-5). The Kidney Disease Outcomes Quality Initiative (K/DOQI) guideline recommends various parameters for monitoring the nutritional status, such as serum albumin, subjective global assessment, anthropometry, and body composition (2). However, a standard method for the assessment of the nutritional status in PD patients does not exist.
The ideal nutritional index would provide an accurate prog- nosis, be associated with nutritional status, and be simple. Many nutritional indices such as the Malnutrition inflammation score, Mini nutritional assessment, Nutritional risk screening 2002, and Malnutrition universal screening tool have been established as a single predictor of mortality in malnourished patients (6, 7).
These require many indicators such as serum albumin, ques- tionnaire, weight loss, and body mass index (BMI), and are com- plex.
Onodera et al. (8) first reported the validity of the Onodera’s prognostic nutritional index (OPNI) to predict the prognosis in 189 gastrointestinal surgical patients. The OPNI is composed of serum albumin and total lymphocyte count within the equa- tion. A simpler tool may involve common measures and can be
applied rapidly in a large number of patients. Validation of OPNI has been applied for patients with end-stage liver disease, ac- tive tuberculosis, and gastrointestinal malignancy (8-14). The aim of this study was to evaluate the clinical usefulness of the OPNI as a prognostic and nutritional indicator in PD patients.
MATERIALS AND METHODS Selection of patients
We reviewed medical records at the Yeungnam University Hos- pital in Korea and identified all adults (aged > 18 yr) who re- ceived PD between April 1996 and March 2011. Among these patients, those without the information about the nutritional status evaluation or the OPNI were excluded. A total of 522 pa- tients were included in this study. As described previously, pa- tients were divided into 3 groups based on the initial OPNI score:
group A (n = 186, < 40), group B (n = 150, 40-45), and group C (n = 186, > 45) (8, 12).
Clinical information
Clinical and laboratory data collected 1 month after the initia- tion of PD included age, gender, and underlying disease of end- stage renal disease, comorbidities, BMI (kg/m2), serum creati- nine (mg/dL), normalized protein equivalent of nitrogen ap-
pearance (g/kg/day), C-reactive protein (CRP; mg/dL), serum albumin (g/dL), total cholesterol (mg/dL), residual renal func- tion (RRF; mL/min/1.73 m2), edema index, PD modality, and fat mass (kg). If the patients exhibited signs of infection, labora- tory findings from 2 months after the initiation of PD were sub- stituted. Total lymphocyte counts were calculated by multiply- ing the percentage of lymphocytes with the total white blood cell count. Serum albumin and CRP levels were detected using an Olympus AU4500 automatic chemical analyzer; bromocre- sol green was used for the detection of albumin. Comorbidities were graded according to the Davies risk index and included ischemic heart disease, peripheral vascular disease, left ventric- ular dysfunction, diabetes mellitus, systemic collagen vascular disease, and other significant pathologies (15). Comorbidities graded by the Davies risk index were categorized as low risk (score 0), intermediate risk (score 1-2), or high risk (score ≥ 3).
Furthermore, the presence of liver or spleen diseases, which are associated with changes in lymphocyte count, was identified.
RRF was calculated from the collection of 24-hr urine samples as the average of the renal creatinine and urea clearances. The OPNI was calculated based on the serum albumin and total lymphocyte count, using the following equation: OPNI = 10 × serum albumin (g/dL) + 0.005 × total lymphocyte count (/mL) (8). The edema index was measured by bioimpedance analysis (Inbody 4.0 Body Composition Analyzer; Biospace, Seoul, Korea).
This was defined as the ratio of the extracellular water to total body water. Fat mass was measured using a dual-energy X-ray absorptiometry (Hologic, Bedford, MA, USA).
Statistical analysis
The data were analyzed using SPSS version 19 (SPSS, Chicago, IL, USA). The distribution of continuous variables was evaluat- ed using the Kolmogorov-Smirnov test. Normally distributed variables were expressed as mean ± standard deviation and compared using t-test or one-way analysis of variance (ANOVA).
Non-parametric variables were expressed as median (range) and were compared using the Mann-Whitney or Kruskal-Wallis test. One-way ANOVA or Kruskal-Wallis test was followed by post-hoc Tukey comparison or Bonferroni correction. Categori- cal variables were expressed as counts and percentages. Pear- son’s chi-squared test or Fisher’s exact test was used to analyze categorical variables. The strength of the relationship between the two variables was examined using Pearson’s method of bi- variate correlation. The survival estimates were calculated ac- cording to the Kaplan-Meier and Cox-regression analyses. P <
0.05 were considered statistically significant.
Ethics statement
The protocol was approved by the institutional review board of the Yeungnam University Hospital (YUH-12-0376-O41). The board waived the need for informed consent.
RESULTS
Clinical characteristics at the time of PD initiation
The mean age of patients was 56.2 ± 13.2 yr in group A, 54.1 ± 13.5 yr in group B, and 49.6 ± 14.4 yr in group C (P < 0.001) (Table 1). The median follow-up duration was 34.2 (1-173) months in
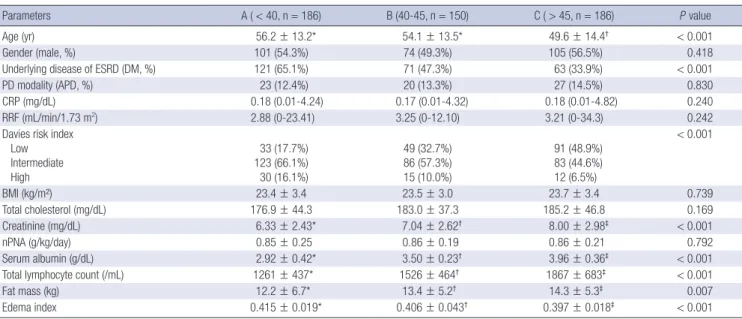
Table 1. Comparison of clinical characteristics according to Onodera’s prognostic nutritional index score at the time of peritoneal dialysis initiation
Parameters A ( < 40, n = 186) B (40-45, n = 150) C ( > 45, n = 186) P value
Age (yr) 56.2 ± 13.2* 54.1 ± 13.5* 49.6 ± 14.4† < 0.001
Gender (male, %) 101 (54.3%) 74 (49.3%) 105 (56.5%) 0.418
Underlying disease of ESRD (DM, %) 121 (65.1%) 71 (47.3%) 63 (33.9%) < 0.001
PD modality (APD, %) 23 (12.4%) 20 (13.3%) 27 (14.5%) 0.830
CRP (mg/dL) 0.18 (0.01-4.24) 0.17 (0.01-4.32) 0.18 (0.01-4.82) 0.240
RRF (mL/min/1.73 m2) 2.88 (0-23.41) 3.25 (0-12.10) 3.21 (0-34.3) 0.242
Davies risk index Low Intermediate High
33 (17.7%) 123 (66.1%) 30 (16.1%)
49 (32.7%) 86 (57.3%) 15 (10.0%)
91 (48.9%) 83 (44.6%) 12 (6.5%)
< 0.001
BMI (kg/m²) 23.4 ± 3.4 23.5 ± 3.0 23.7 ± 3.4 0.739
Total cholesterol (mg/dL) 176.9 ± 44.3 183.0 ± 37.3 185.2 ± 46.8 0.169
Creatinine (mg/dL) 6.33 ± 2.43* 7.04 ± 2.62† 8.00 ± 2.98‡ < 0.001
nPNA (g/kg/day) 0.85 ± 0.25 0.86 ± 0.19 0.86 ± 0.21 0.792
Serum albumin (g/dL) 2.92 ± 0.42* 3.50 ± 0.23† 3.96 ± 0.36‡ < 0.001
Total lymphocyte count (/mL) 1261 ± 437* 1526 ± 464† 1867 ± 683‡ < 0.001
Fat mass (kg) 12.2 ± 6.7* 13.4 ± 5.2† 14.3 ± 5.3‡ 0.007
Edema index 0.415 ± 0.019* 0.406 ± 0.043† 0.397 ± 0.018‡ < 0.001
Data are expressed as numbers (percentages) for categorical variables and median (range) or mean ± standard deviation for continuous variables. Statistical significance was tested using one-way analysis of variance or Kruskal-Wallis test for continuous variables and Pearson’s chi-squared test or Fisher’s exact test for the categorical variables.
Superscripts (*, †, ‡) indicate significant differences based on post-hoc Tukey comparison or Bonferroni correction. PD, peritoneal dialysis; ESRD, end-stage renal disease; DM, diabetes mellitus; APD, automated peritoneal dialysis; CRP, C-reactive protein; RRF, residual renal function; BMI, body mass index; nPNA, normalized protein equivalent of nitro- gen appearance.
group A, 41.9 (1-181) months in group B, and 37.6 (1-174) months in group C. Twenty-seven patients (5.2%) had liver or spleen diseases. Group A was associated with a higher incidence of di- abetes, old age, and higher grade according to the Davies risk index than the other groups. Serum creatinine and albumin lev- els, total lymphocyte count, and fat mass increased with an in- crease in OPNI score. Edema index was 0.415 ± 0.019 in group A, 0.406 ± 0.043 in group B, 0.397 ± 0.018 in group C (P < 0.001).
Edema index increased with a decrease in OPNI score. There were no significant differences in PD modality, CRP, RRF, BMI, and total cholesterol between 3 groups.
The OPNI and serum albumin were negatively correlated with CRP and the edema index (Table 2). According to the ede- ma index, the correlation coefficient for OPNI was -0.284 and for serum albumin was -0.322. Similarly, according to CRP, the correlation coefficient for OPNI was -0.117 and for serum albu- min was -0.169. The correlation coefficients for both variables were lower than those for serum albumin.
Survival analysis
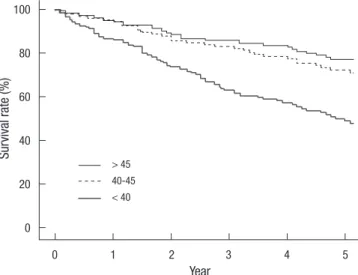
The cumulative 5-yr survival rate was 48.8%, 72.2%, and 77.1%
in group A, group B, and group C, respectively (Fig. 1) (P < 0.001).
Initial OPNI was associated with mortality in PD patients. Uni- variate analysis showed that old age (≥ 65 yr), high grade accord- ing to the Davies risk index, low OPNI (group A), hypoalbumin- emia (< 3.5 g/dL), high CRP (> 0.5 mg/dL), and high edema in- dex tertile (> 0.410) were associated with mortality in PD pa- tients (Table 3). Multivariate analysis adjusted for age, Davies
risk index, CRP, and edema index revealed that the hazard ratio for low OPNI was 1.672 (P = 0.003). Hypoalbuminemia was not associated with mortality in PD patients (hazard ratio, 1.308;
P = 0.130).
DISCUSSION
This study demonstrates that the OPNI is associated with the nutrition status and comorbidities. This index was less correlat- ed to inflammation or the edema index than the serum albu- min. Univariate and multivariate analyses showed that the ini- tial low OPNI was associated with mortality in PD patients.
This study shows that the edema index and CRP are negatively correlated with serum albumin. Serum albumin has been well documented as a risk factor for mortality in dialysis patients (1, 2, 4). Canada-USA Peritoneal Dialysis Study Group (CANUSA) results showed that 1 g/L increase in serum albumin is associ- ated with 6% decrease in mortality (16). However, serum albu- min in patients with comorbidities may be more associated with
Table 3. Univariate and multivariate Cox’s proportional hazard analysis of variables for mortality in peritoneal dialysis patients
Variables Univariate Multivariate
HR (CI) P value HR (CI) P value*
Age ( ≥ 65 yr) 3.684 (2.722-4.987) < 0.001 3.271 (2.337-4.579) < 0.001
Davies risk index (intermediate or high) 3.807 (2.564-5.654) < 0.001 2.808 (1.831-4.306) < 0.001
Total lymphocyte count (low tertile)† 1.337 (0.994-1.798) 0.055 - -
OPNI ( < 40) 2.300 (1.726-3.066) < 0.001 1.672 (1.190-2.349) 0.003
CRP ( > 0.5 mg/dL) 1.771 (1.290-2.431) < 0.001 1.349 (0.962-1.894) 0.083
Serum albumin ( < 3.5 g/dL) 2.018 (1.502-2.711) < 0.001 1.308 (0.924-1.853) 0.130
Edema index (high tertile)† 2.095 (1.569-2.798) < 0.001 1.636 (1.165-2.297) 0.004
*Covariates for serum albumin included age, Davies risk index, CRP, and edema index. Covariates for all other variables included age, Davies risk index, OPNI, CRP, and edema index; †High edema index tertile was defined as an extracellular water/total body water > 0.410 and low total lymphocyte tertile was defined as < 1,275 /mL. HR, hazard ratio;
CI, confidence interval; OPNI, Onodera’s prognostic nutritional index; CRP, C-reactive protein.
Table 2. Correlation between variable markers and edema index or C-reactive protein Variables Pearson’s correlation coefficient P value For edema index
Total lymphocyte count (/mL) OPNI
Serum albumin (g/dL)
-0.019 -0.284 -0.322
0.678
< 0.001
< 0.001 For CRP
Total lymphocyte count (/mL) OPNI
Serum albumin (g/dL)
0.056 -0.117 -0.169
0.214 0.010
< 0.001 CRP, C-reactive protein; OPNI, Onodera’s prognostic nutritional index.
Fig. 1. Kaplan-Meier survival curve according to Onodera’s prognostic nutritional in- dex group (5-yr survival rate, 48.8% for < 40, 72.2% for 40-45, 77.1% for > 45;
P < 0.001).
Survival rate (%)
Year
0 1 2 3 4 5
100
80
60
40
20
0
> 45 40-45
< 40
inflammation or hydration than the nutritional status. While hypoalbuminemia from malnutrition alone is uncommon, mal- nutrition combined with hydration status or inflammation play a role in causing hypoalbuminemia in dialysis patients (17).
Therefore, serum albumin in patients during the early dialysis period may be less effective as a nutritional marker than that in stable dialysis patients. Multivariate analysis adjusted for the edema index shows that serum albumin is not associated with mortality in PD patients. We found that that the correlation co- efficient of OPNI for the CRP and edema index was lower than that in serum albumin. Additionally, OPNI was associated with mortality in PD patients after multivariate adjustment for the edema index and CRP. OPNI may be an independent prognos- tic factor, regardless of inflammation and hydration status.
Total lymphocyte count has been proposed as a prognostic factor (18). Increased total white blood cell count has been found to correlate with mortality in elderly men or after myocardial infarction (19, 20). Increased neutrophil counts have been im- plicated as a biomarker of atherosclerosis and/or inflammation (21). Malnutrition can induce a decrease in total lymphocyte count and suppression of cellular immunity including delayed hypersensitivity reaction (22). Immunologic changes occur ear- ly in the course of nutritional depletion (18). Reddan et al. (23) showed that the lymphocyte count was associated with the nu- tritional status and mortality in dialysis patients. This study shows that total lymphocyte count is an independent marker for the edema index or CRP. Although there was no statistical signifi- cance, low total lymphocyte tertile results in a hazard ratio of 1.337 for mortality. In our study, a total of 27 patients had liver or spleen diseases, which were associated with changes in the total lymphocyte count. The number of patients with 2 condi- tions was low, and the mortality risk of OPNI after adjusting the comorbidity index, including liver disease, was significant. These show that the clinical significance for OPNI may be valuable after correcting for these effects.
This study shows that a low OPNI score is associated with mortality in PD patients. This variable is less correlated to the edema index and CRP than serum albumin. This may be asso- ciated with addition of total lymphocyte count as an indepen- dent factor for edema index and CRP within the OPNI equation.
The association between the OPNI, serum albumin, and total lymphocyte count may be due to inclusion of two variables with- in the OPNI equation. However, low OPNI was also associated with old age, high grade of the Davies risk index, low serum cre- atinine, and fat mass.
An ideal nutritional marker should be simple, have associa- tion with the nutritional status, and predict mortality. Many nu- tritional indices have been introduced in dialysis patients (6, 7).
While these methods have been validated, using the OPNI is a simpler and easier method than previously reported indices.
This index only includes complete blood count with differential
count and serum albumin. This does not require additional lab- oratory findings or subjective questionnaires. This method has been validated in patients with malignancy or postoperative patients, who are expected to have the malnutrition in combi- nation with inflammation, edema, or comorbidities (8-14). This study shows that the OPNI can be clinically relevant in PD pa- tients, who are expected to have the combination of inflamma- tion or edema.
Validation studies for OPNI were limited to Japanese subjects.
There have been 4 reports examining the prognosis in patients with gastrointestinal malignancy, active tuberculosis, or end- stage liver disease (8, 10, 13, 14). There has been a report regard- ing the association with nutritional status alone and two reports regarding postoperative complications in patients with gastro- intestinal malignancy or active tuberculosis (9, 11, 12). OPNI validation has not been widely studied in chronic kidney dis- ease patients. This may be due to several limitations such as the application of widely known serum albumin levels and total lymphocyte count as variables for OPNI and changes in OPNI based on variable conditions. Moreover, it is not known if the results can be applicable to other populations.
There are a few limitations to this study. This was a retrospec- tive, single-center study. Although measurements using OPNI calculation were measured 1 or 2 months after the initiating PD and patients had no definite signs of infection, OPNI was calcu- lated using a single measurement of the total lymphocyte count.
A time-averaged value may be a more precise method for pre- dicting mortality than a single value alone. Additionally, we were unable to evaluate the lymphocyte subset. Malnutrition is asso- ciated with a decreased CD4:CD8 ratio as well as the appear- ance of peripheral immature T cells (24, 25). Evaluating the lym- phocyte subset will help to differentiate the independent effect of malnutrition from variable conditions associated with lym- phopenia, such as sepsis, malignancy, and steroid treatment (18). Decreased lymphocyte type is typically associated with a specific nutrient, e.g., the known association between β-carotene and CD19 (26). Understanding these relationships may be valu- able for identifying the insufficient nutrient. Further investiga- tion involving a more accurate lymphocyte count or subset is necessary.
In summary, our results demonstrate that the OPNI is less related to inflammation and edema than serum albumin per se.
An initial low OPNI is associated with poor nutritional status and high mortality in PD patients. The OPNI is a simple method that can be used for predicting the nutritional status and clini- cal outcome in PD patients.
REFERENCES
1. Avram MM, Goldwasser P, Erroa M, Fein PA. Predictors of survival in continuous ambulatory peritoneal dialysis patients: the importance of
prealbumin and other nutritional and metabolic parameters. Am J Kid- ney Dis 1994; 23: 91-8.
2. National Kidney Foundation. K/DOQI Clinical practice guidelines for nutrition in chornic renal failure. Am J Kidney Dis 2000; 35: S1-140.
3. Stenvinkel P, Heimbürger O, Lindholm B, Kaysen GA, Bergström J. Are there two types of malnutrition in chronic renal failure? Evidence for re- lationships between malnutrition, inflammation and atherosclerosis (MIA syndrome). Nephrol Dial Transplant 2000; 15: 953-60.
4. Combe C, McCullough KP, Asano Y, Ginsberg N, Maroni BJ, Pifer TB.
Kidney Disease Outcomes Quality Initiative (K/DOQI) and the Dialysis Outcomes and Practice Patterns Study (DOPPS): nutrition guidelines, indicators, and practices. Am J Kidney Dis 2004; 44: 39-46.
5. Park JS, Jung HH, Yang WS, Kim HH, Kim SB, Park SK, Hong CD. Protein intake and the nutritional status in patients with pre-dialysis chronic re- nal failure on unrestricted diet. Korean J Intern Med 1997; 12: 115-21.
6. Kondrup J, Allison SP, Elia M, Vellas B, Plauth M; Educational and Clin- ical Practice Committee, European Society of Parenteral and Enteral Nutrition (ESPEN). ESPEN guidelines for nutrition screening 2002. Clin Nutr 2003; 22: 415-21.
7. Kalantar-Zadeh K, Kopple JD, Block G, Humphreys MH. A malnutri- tion-inflammation score is correlated with morbidity and mortality in maintenance hemodialysis patients. Am J Kidney Dis 2001; 38: 1251-63.
8. Onodera T, Goseki N, Nosaki G. Prognostic nutritional index in gastro- intestinal surgery of malnourished cancer patients. Nihon Geka Gakkai Zasshi 1984; 85: 1001-5.
9. Goseki N, Okamoto A, Onodera T. Postoperative nutritional assessment in gastric and colorectal cancer. Nihon Geka Gakkai Zasshi 1986; 87:
853-8.
10. Yagi T, Yamagishi F, Sasaki Y, Mizutani F, Wada A, Kuroda F. Clinical re- view of pneumothorax cases complicated with active pulmonary tuber- culosis. Kekkaku 2002; 77: 395-9.
11. Yagi T, Yamagishi F, Sasaki Y, Itakura M, Fujikawa A, Kuga M, Ishimaru G.
A study on cases developed pulmonary tuberculosis after receiving gas- trectomy. Kekkaku 2004; 79: 355-9.
12. Sagawa M, Katsube T, Konno S, Murayama M, Yamaguchi K, Isohata N, Yoshimatsu K, Shiozawa S, Shimakawa T, Naritaka Y, et al. The signifi- cance of Onodera’s prognostic nutritional index for the treatment of gas- trointestinal cancer. Gan To Kagaku Ryoho 2008; 35: 2253-5.
13. Fukushima K, Ueno Y, Kawagishi N, Kondo Y, Inoue J, Kakazu E, Ninomi-
ya M, Wakui Y, Saito N, Satomi S, et al. The nutritional index ‘COUNT’ is useful for predicting long-term prognosis of patients with end-stage liver disease. Tohoku J Exp Med 2011; 224: 215-9.
14. Okada I, Shirahata A, Soda H, Saitou M, Kigawa G, Nemoto H, Sanada Y, Hibi K. Significance of Onodera’s prognostic nutritional index for treat- ing unresectable or recurrent colorectal cancer with chemotherapy. Gan To Kagaku Ryoho 2012; 39: 231-5.
15. Davies SJ, Phillips L, Naish PF, Russell GI. Quantifying comorbidity in peritoneal dialysis patients and its relationship to other predictors of survival. Nephrol Dial Transplant 2002; 17: 1085-92.
16. CANADA-USA (CANUSA) Peritoneal Dialysis Study Group. Adequacy of dialysis and nutrition in continuous peritoneal dialysis: association with clinical outcomes. J Am Soc Nephrol 1996; 7: 198-207.
17. Kaysen GA. Biological basis of hypoalbuminemia in ESRD. J Am Soc Nephrol 1998; 9: 2368-76.
18. Omran ML, Morley JE. Assessment of protein energy malnutrition in old- er persons, Part II: Laboratory evaluation. Nutrition 2000; 16: 131-40.
19. Weijenberg MP, Feskens EJ, Kromhout D. White blood cell count and the risk of coronary heart disease and all-cause mortality in elderly men.
Arterioscler Thromb Vasc Biol 1996; 16: 499-503.
20. Furman MI, Becker RC, Yarzebski J, Savegeau J, Gore JM, Goldberg RJ.
Effect of elevated leukocyte count on in-hospital mortality following acute myocardial infarction. Am J Cardiol 1996; 78: 945-8.
21. Ernst E, Hammerschmidt DE, Bagge U, Matrai A, Dormandy JA. Leuko- cytes and the risk of ischemic diseases. JAMA 1987; 257: 2318-24.
22. Bistrian BR, Blackburn GL, Scrimshaw NS, Flatt JP. Cellular immunity in semistarved states in hospitalized adults. Am J Clin Nutr 1975; 28:
1148-55.
23. Reddan DN, Klassen PS, Szczech LA, Coladonato JA, O’Shea S, Owen WF Jr, Lowrie EG. White blood cells as a novel mortality predictor in haemodialysis patients. Nephrol Dial Transplant 2003; 18: 1167-73.
24. Kaiser FE, Morley JE. Idiopathic CD4+ T lymphopenia in older persons.
J Am Geriatr Soc 1994; 42: 1291-5.
25. Schaible UE, Kaufmann SH. Malnutrition and infection: complex mech- anisms and global impacts. PLoS Med 2007; 4: e115.
26. Grzegorzewska AE, Leander M. Total lymphocyte count and subpopu- lation lymphocyte counts in relation to dietary intake and nutritional status of peritoneal dialysis. Adv Perit Dial 2005; 21: 35-40.