1. Introduction
The centrifugal pumps are prevalent for different industrial applications, so total amount of energy consumed by them is very considerable, and, therefore, improving the efficiency of such equipments is an essential in energy saving. One important factor in the centrifugal pump efficiency is the hydraulic performance, which is directly dependent upon the presence of cavitation. Generally, the cavitation bubbles block the flow of working fluid inside the pump. In addition, if gas bubbles are attached to the pump surface, the detachment process generates noise and vibration and reduces pump performance. Owing to the importance of cavitation for centrifugal pumps, this issue has been investigated by different scholars from various
aspects. Penger and Chen[1] simulated cavitation using a CFD code and predicted the cavitation phenomenon over surface of guide vane. Kim et al.[2] analyzed cavitation phenomenon occurring in a pump and studied flow properties inside the pump. Sano et al.[3] showed that the clearance between impeller and diffuser affects the diffuser pressure performance. Shi and Tsukamoto[4] investigated pressure fluctuations due to the interaction between impeller and diffuser vanes. Guleren and Pinarbasi[5]
studied the stalled flow inside a vanned centrifugal pump and reported that the separation of flow from the diffuser vane causes stall onset. They also simulated a cavitation model. Delgosha et al.[6] investigated a test pump with two-dimensional-curvature blade geometry in cavitating and noncavitating conditions using different experimental techniques. They also simulated a three-dimensional numerical model in order to study cavitating cases.
Alexander et al.[7] performed numerical and experimental investigations of unsteady cavitating flow in a vortex pump.
Following the above research works, this paper
CAVITATION ANALYSIS IN A CENTRIFUGAL PUMP USING VOF METHOD
W.J. Lee,1 J.H. Lee,1 N. Hur*1 and I.S. Yoon2
1Dept. of Mechanical Engineering, Sogang University
2Dooch Pump Co., R&D Center
VOF기법을 이용한 원심펌프 내의 공동현상에 관한 유동해석
이 원 주,1 이 정 현,1 허 남 건,*1 윤 인 식2
1서강대학교 기계공학과
2(주)Dooch 펌프 연구소
Centrifugal pumps consume considerable amount of energy in various industrial applications. Therefore, improvement of the efficiency of these machines has become a major challenge. Cavitation is a phenomenon which decreases the pump efficiency and even causes structural demage. Hence, the goal of this paper is to investigate the cavitation problem in the single-stage and double-stage centrifugal pumps. The Volume of Fraction (VOF) method has been used for the numerical simulations together with Rayliegh-Plesset model for the gas-liquid two-phase flow inside the pump. In order to capture the turbulent phenomena, the standard k-ε turbulence model has been adopted, and the simulations have been done as unsteady cases. In addition, the motion of the rotating parts has been simulated using Multi Reference Frame(MRF) method. The results are presented and compared in terms of hydraulic head and NPSH for both the single-stage and double-stage pumps. The H-Q curves show the effects of cavitation on decreasing the pumps performances.
Key Words : Centrifugal pump, Cavitation, CFD(Computational Fluid Dynamic), VOF(Volume of Fraction)
Received: May 29, 2015, Revised: December 31, 2015, Accepted: December 31, 2015.
* Corresponding author, E-mail: [email protected] DOI http://dx.doi.org/10.6112/kscfe.2015.20.4.001
Ⓒ KSCFE 2015
(1)
The momentum conservation equation is:
(2)
where the quantity is the source term. For simulating flow inside the pump, the standard k-ε turbulence model is adopted. The transport equation of kinetic energy and dissipation rate are:
(3)
(4)
where
Also, Multiple Reference Frame(MRF) method is used for simulation of impeller rotation. This method uses centrifugal force of fluid. For incompressible NS equations in moving reference frame with relative velocity we have:
the simulation of cavitation. The mathematical equation of Rayleigh-Plesset model is:
∞
(6)
where the , , , , ∞ and are radius of bubble, surface tension coefficient, liquid density of fluid, pressure of saturated water vapor, pressure of the surrounding liquid and liquid viscosity, respectively.
In order to simulate the presence of air bubbles, flow inside the pump is assumed as a mixture of water and air. Hence, the pump is simulated using the VOF method, which is appropriate for simulation of flows with immiscible fluids, and resolves the interface between different phases of the mixture. The method assumes that all fluid phases which exist inside a control volume share velocity, pressure, and temperature fields. Hence, the same set of basic governing equations describing the momentum, mass, and energy transport in a single-phase flow is used.
Overall, the VOF method works based on the volumetric ratio of different phases.
3. Geometry of models and mesh arrangements The dimensions of the single-stage and double-stage pumps are shown in Fig. 1 and listed in Table 1. The impeller and diffuser have six and ten blades, respectively.
The impeller position is 100 mm from the bottom of pump and gap between impeller and diffuser is about 3.3 mm.
Polyhedral mesh are used for the computations, and the
D1 D2 D3 D4
52 mm 52 mm 52 mm 105 mm
Table 1 Dimensions of pump
(a) Single-stage centrifugal pump
(b) Double-stage centrifugal pump Fig. 1 Geometry of centrifugal pump
total number of cells in the single-stage and double-stage model are approximately 1,300,000 and 3,000,000, respectively(Fig. 2(a),(b)). The result of mesh sensitivity analysis shown in Fig. 2(c) demonstrate the adequacy of the selected mesh resolution and obviously show that when the cell number is over 2,500,000 the head of the pump has very small discrepancy. Hence, the model with 3,000,000 cells is chosen for the CFD simulations of the double-stage pump. It should be noted that the same mesh resolution is also applies to single-stage pump. In addition, for the simulation of flow near the wall, three prism layers are placed near the solid surfaces, with the total thickness and expanding ratio of 0.3 mm and 1.3, respectively. Also, the CFL(Courant, Friedrichs-Lewy) number has been set as 0.2. Furthermore, in order to increase the accuracy of the results, a finer mesh is used around each impeller.
4. Results
The input values of inlet flow rate in a single-stage
(a) Single-stage mesh arrangement
(b) Double-stage mesh arrangement
(c) Double-stage mesh sensitivity analysis Fig. 2 Mesh and boundary condition
pump are set as 20, 24, 28 and 34 m3/hr, for both the single-phase flow simulation(without cavitation) and two-phase flow(with cavitation). The outlet is considered as pressure outlet at the atmospheric condition and rotation speed is fixed by 3,550 rpm. For the cavitation simulation in double-stage pump, the inlet is assumed as pressure
(a) Without cavitation
(single-phase ) (c) With cavitation (two-phase flow)
(b) Without cavitation
(single-phase flow) (d) With cavitation (two-phase flow) Fig. 3 Comparison between results of flow with/without cavitation
for the inlet mass flow rate of 20 m3/hr in solution time 0.1(s)(single-phase and two-phase flow)
values of 20, 25, 30, 35 and 40 kPa, and outlet boundary is set up as pressure outlet. The rotation speed is same with the single-stage pump.
4.1 Single-stage pump
The single-phase flow simulation and cavitation simulation have been compared for a single-stage pump.
For the single-phase flow simulation, the working fluid is water and inlet mass condition is set as 20 m3/hr. The flow enters the inlet, and streams through the impeller, diffuser and reaches to the top of the pump. Then, it flows down along the pump casing and finally drains into the outlet. In order to increase the convergence speed and accuracy of the simulations of the cavitation, the simulations have been started from the results of single-phase flow with the same initial condition. The results of the pressure and velocity are shown in Fig.
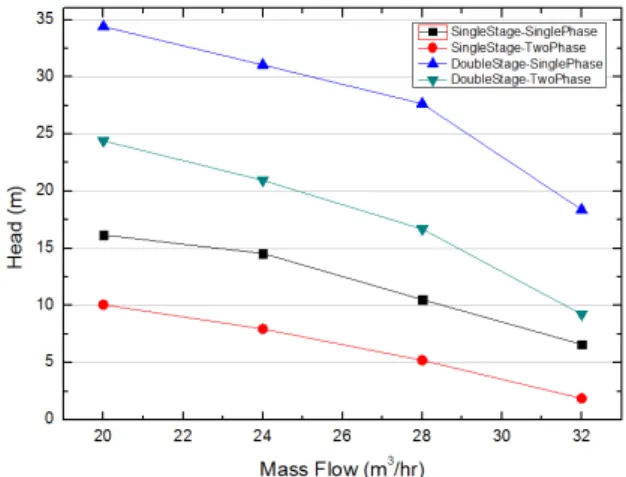
Fig. 4 H-Q curves of single-stage and Double-stages, comparison between single-phase and two-phase(with cavitation)
3(a),(b). As it is depicted, the effect of rotation of the pump increases the flow pressure exactly after the water passes through the impeller and diffuser.
In addition, the head values, calculated according to the Eq. (7), are shown in Fig. 4. As seen in this H-Q curve, when the flow rate becomes higher the head value decreases in both single and double stage.
(7)Moreover, the contours of pressure and velocity vectors are shown in Fig. 3(c),(d), respectively. As it is seen, in general, the pressure in the case of two-phase flow(with cavitation) is lower than the single-phase flow (without cavitation). This is in complete agreement with the H-Q curves shown in Fig. 4, in which existence of cavitation decreases the pump performance.
Furthermore, to show the effects of inlet pressure on the presence of cavitation, the locations of cavitation are shown for different cases in Fig. 5. As the results show, the cavitation is more likely to happen in an inner radius and it is stronger near the inner radii.
4.2 Double-stage pump
Here, a parameter known as net positive suction head(NPSH) is considered. The NPSH is a criterion to know how close the fluid at a given point is to the boiling or cavitation. The NPSH is specially relevant to the centrifugal pump design. For a pump to be operated in a cavitaion-free condition, the inlet pressure should be
(a) Axial direction
(b) Radial direction
Fig. 5 Presence of cavitation in a single-stage pump for the inlet mass flow rate of 20 m3/hr in solution time 0.1(s)
higher than saturation vapor pressure. The equation for NPSH can be presented as:
(8)
where is inlet pressure and is vapor pressure.
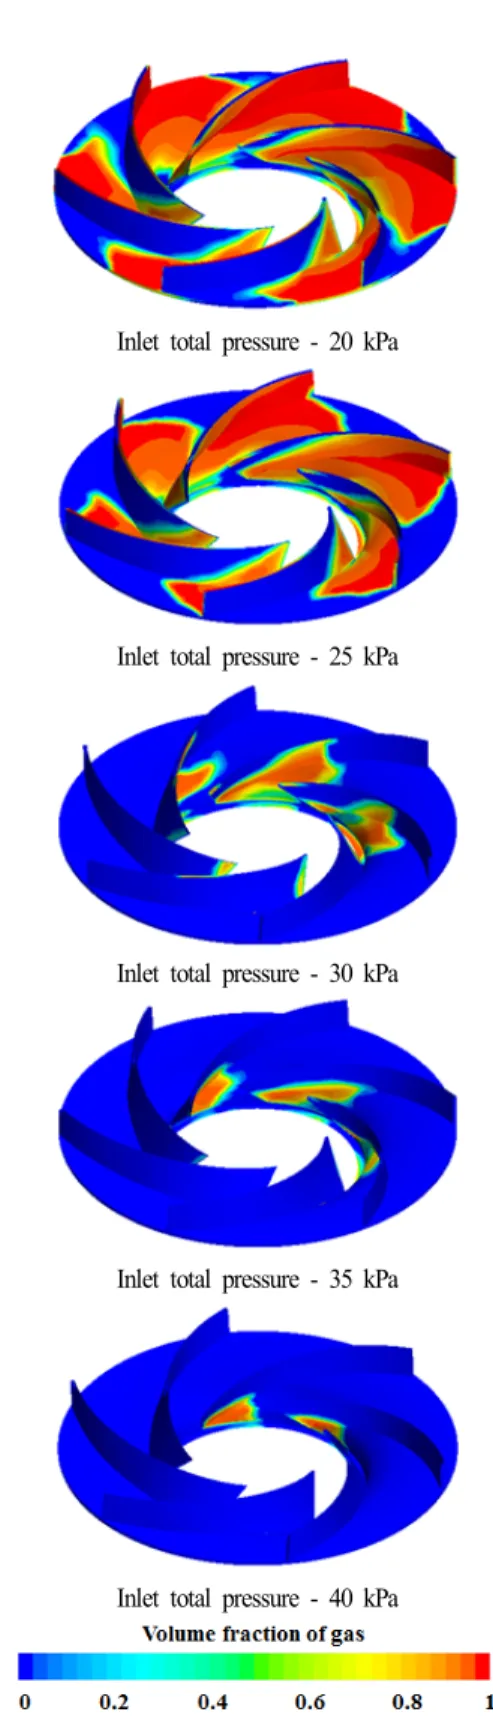
In the present research, the NPSH is investigated for five different inlet pressure conditions of 20, 25, 30, 35 and 40 kPa as shown in Fig. 6. The case with the pressure value of 20 kPa shows the strongest cavitation activity, while the case with 40 kPa has the weakest cavitation. As depicted, the cavitation over the first stage is reduced with the increase in the inlet pressure. The figures also demonstrate the tendency of presence of cavitation bubble near the center of the impeller. Also no cavitation has been observed in the second stage.
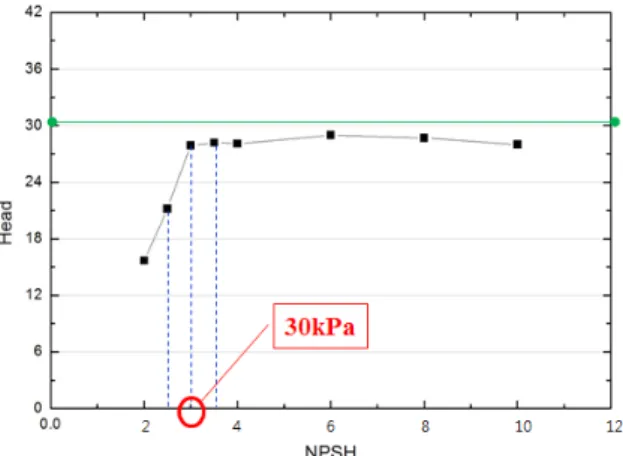
According to the theory, cavitation occurs if the NPSH is less than a required value(NPSHR). In the present research the NPSHR is considered as 30.5 m. The investigation of the NPSH is presented in Fig. 7.
Inlet total pressure - 20 kPa
Inlet total pressure - 25 kPa
Inlet total pressure - 30 kPa
Inlet total pressure - 35 kPa
Inlet total pressure - 40 kPa
Fig. 6 Cavitation over the first stage of the pump for different inlet total pressure values in Double-stage pump
Fig. 7 Head drop curve under various inlet pressure condition
5. Concluding remarks
The present study has been carried out numerically, in order to investigate the cavitation phenomenon in single-stage and double-stage pumps. The VOF method together with the Rayliegh-Plesset model were used for the unsteady simulations of two-phase flow. The standard k-ε model was employed for capturing the turbulent phenomena and the motion of the rotating parts was simulated using MRF method. The rotation speed was assumed to be fixed at 3,550 rpm. Different mass flow rate values were investigated for the single-stage pump with/without the cavitation model. The H-Q curve showed that cavitation decreased the pump performance. In addition, effects of inlet total pressure on the cavitation were investigated for a double-stage model. The contour of air volume fraction demonstrated that the increase in the inlet total pressure, effectively diminished the cavitation over the impeller. Furthermore, the results of the NPSH(net positive suction head) were presented and analyzed for the NPSHR = 30.5 m.
Acknowledgments
This research was supported by the National Research
at the ACFD10 Conference, JeJu, Oct. 19-23, 2014.
References
[1] 2010, Peng, Y. and Chen, X., "Numerical study of cavitation on the surface of the guide vane in three gorges hydropower unit," Journal of Hydrodynamics, Vol.22, No.5, pp.703-708.
[2] 2013, Kim, M.J., Jin, H.B., Son, C.H. and Chung, W.J., "Numerical analysis on cavitation of Centrifugal pump," Korean Society for Fluid Machinery, Vol.16, No.2, pp.27-34.
[3] 2002, Sano, T., Nakamura, Y., Yoshida, Y. and Tsujimoto, Y., "Alternate Blade Stall and Rotating Stall in a Vaned Diffuser,". JSME Int. J. Ser. B, Vol.45, No.4, pp.810-819.
[4] 2001, Shi, F. and Tsukamoto, H., "Numerical Study of Pressure Fluctuations Caused by Impeller-Diffuser Interaction in a Diffuser Pump Stage," ASME J.
Fluids Eng., Vol.123, Issue.3, pp.466-474.
[5] 2004, Guleren, K.M. and Pinarbasi, A., "Numerical simulation of the stalled flow within a vaned centrifugal pump," J. Mech. Eng. Sci., Vol.218, pp.425-435.
[6] 2004, Delgosha, O.C., Patella, R.F. and Reboud, J.L
"Experimental and numerical studies in a centrifugal pump with two-dimensional cureved blades in cavitating condition," Journal of ASME, Vol.125, Issue.6, pp.970-978.
[7] 2010, Alexander, S., Hendrik, W. and Alfred, O.,
"Numerical and experimental investigations of the unsteady cavitating flow in a vortex pump," Journal of Hydrodynamics, Vol.22, No.5, pp.324-329.