1. Introduction
Periodontitis is the most common chronic inflammatory disease caused by an interaction of a specific bacterial flora with the host
1). After stimulation by bacterial antigens, various reactive oxygen species (ROS) were produced by host’s defense mechanism. These ROS originate from molecular oxygen and predominantly produce cellular damage (proteins, lipids, and DNA) if not neutralized by anti-oxidant substances. Their production is an essential component of the host response to a variety of insults, including bacteria
2)and traumas/burns
3). It has recently been discovered that there is a strong relationship among increased ROS, periodontitis pathogenesis, and antioxidant support
4). In this respect, nutrition may be of great importance since it has been implicated in a number of inflammatory diseases and conditions, including periodontitis
5). Several reports demonstrated that a poor
diet is associated with a higher risk of periodontitis
6). Thereby, the role of some micronutrients in the etiology and therapy of periodontitis were discussed
5). Micronutrients are dietary compounds ( vitamins and minerals) that are required in small quantities and essential for metabolism, immune response, tissue regeneration, and growth. In particular, oral soft tissue with high physiologic turnover rates are dependent on sufficient food intake. However, most studies dealt with the association between single nutrient and periodontitis
7). Only one study examined the relationship between various nutrients and periodontitis
8).
In this study, the Food Frequency Questionnaire (FFQ) was used to evaluate the intake of vitamins and other nutrients. Using data from a national sample of Korean adults, the aim of this study was therefore to assess the association between various nutrient intake and periodontitis in a large representative sample of the Korean population: the 2007~2010 and 2012 Korea National Health and Nutritional Examination Survey ( KNHANES) .
대한치위생과학회지
Vol. 4, No. 1, 2021
Doi : 10.22753/JKDHS/2021.4.1.39
Lower Nutrient Intakes and Periodontitis: Findings from the Korea National Health and Nutrition Examination Surveys
이민선
1·한동헌
2·김미선
1†1
경동대학교 치위생학과
2
서울대학교 치의학대학원 예방치학교실
접수일: 2021년 5월 30일 최종수정일: 2021년 6월 17일 게재 확정일: 2021년 6월 18일
교신저자: Mi-Sun Kim, (26495) Department of Dental Hygiene, Kyungdong University, Gangwon-do, Korea Tel: +82-033-738-1315, Fax: +82-033-738-1349 E-mail: [email protected]
2. Materials and Methods
2.1. Study population
Data were from the 2007~2010 and 2012 KNHANES, cross-sectional and nationwide surveys performed by the Korea Disease Control and Prevention Agency (KDCA) . The survey was composed of a health interview survey, a nutrition survey, and a health examination survey.
An oral health examination was included as a part of the health examination survey since the first year of the KNHANES IV in 20079). The periodontal information of the year 2011 KNHANES was not opened due to fluctuation of periodontal data. Each participant in the survey signed an informed consent form. Overall response rates were 65.8% in 2007, 74.3% in 2008, 82.8% in 2009, 81.9% in 2010, and 80.0% in 2012.
For the present analysis we combined data from separate surveys sampled from 2007 through 2010 and 2012 among adults aged 25~64 years.
The number of total participants in 2007~2010 and 2012 KNHANES was 41,887 (19,059 males and 22,828 females) . Among those, periodontal health status was measured for 31,908 participants (13,994 males and 17,914 females) . There were 22,321 (9,766 males and 12,555 females) adults aged 25~64 years among the total participants in the 2007~2010 and 2012 KNHANES (n=41,887) . The exclusion criteria were as follows: (i) those aged < 25 or > 64, (ii) those who did not participate in the periodontal examination, iii) those who took in the nutrients more than tolerable upper intake level, and (iv) those with missing values in the health assessment or questionnaires. The final sample size was 16,555 (6,520 males and 10,035 females, 74.2% of all adults aged 25~64 years in the 2007~2010 and 2012 KNHANES) for model 2 in Table 4 and 5 and 15,847 (6,198 males and 9,649 females, 71.0% of all adults aged 25 years or older in the 2007~2010 and 2012
KNHANES) for model 3 in Table 4 and 5.
2.2. Assessment of dietary nutrients
The dietary intake for the last 12 months was assessed, and full-scale photographs were used to assist in estimating portion sizes such as tablespoons, cups, slices, units, bowls, plates and cans. Nutritional intake was analyzed using CAN-Pro 4.0 (Korean Nutrition Society, Seoul, Korea) . The FFQ used by the KNHANES included 11 food groups consisting of 63 food items, and the frequency of servings was classified into nine categories: never or seldom, once a month, 2~3 times a month, one to two times a week, three to four times a week, five to six times a week, once a day, twice a day, and three or more times a day. The portion size of the food items was classified as follows:
small, medium, or large
10). Nutrients included in this analysis were total dietary energy, vitamin-A, -B
1, -B
2, -C, iron, phosphorus, calcium, and protein.
The above mentioned nutrients were divided into three groups with estimated average requirements (EAR) and recommended intake (RI) defined by the Dietary Reference Intakes for Koreans
11).
2.3. Periodontal examination
Oral health examination was conducted by dentists in the survey. The World Health Organization (WHO) community periodontal index (CPI) was used to assess periodontitis
12). Periodontitis was defined as a CPI greater than or equal to “code 3”, which indicates that more than one site had a 3.5 mm pocket or larger in the index teeth. The index teeth numbers were 11, 16, 17, 26, 27, 31, 36, 37, 46, and 47, respectively.
2.4. Assessment of covariates
Confounders in this study were total energy intake
and major socio-demographic factors and included
survey year, age, income, education, occupation, marital status, and residence. Mediators considered in the relationship between nutrients and periodontitis were oral health behaviors (frequency of daily toothbrushing and regular dental check-up) , general health behaviors (smoking) , somatic health problems (diabetes) , and a measure for inflammation (White Blood Cell : WBC count) . We assumed these mediators as intermediate variables in the causal pathway between nutrients and periodontitis. Except for diabetes and WBC count, information on covariates was collected during the health interview. Monthly household income was adjusted for the number of household member and categorized into four groups: < 25 %, 25~49 %, 50~75 %, and > 75 % of total equivalised income in the survey. Education level was categorized into four groups: below primary school, middle school, high school, and college or higher. Occupation was divided into white collar, blue collar, and others. Marital status was categorized as married and single. Participants’
residence was presented as urban and rural. Information on the frequency of daily toothbrushing was collected based on the following question, “How often did you brush your teeth yesterday?” (times/day) . Participants were asked whether they had visited dental clinic for regular check-up during a year prior to the interview (yes or no) . Smoking status was divided into two categories: current smokers and no smoker. Fasting plasma glucose was measured and grouped as normal (fasting plasma glucose level <100 mg/dl) , prediabetes (fasting plasma glucose level <126 mg/dl) , and diabetes (fasting plasma glucose level ≥126 mg/dl or diabetic medication) . WBC count was measured with blood specimens.
2.5. Statistical analysis
Individual sample weights and the complex sample
design including stratification and primary sampling units were considered in the analysis. Due to the significant interactions between age and nutrients intake and between gender and nutrients, separated analyses according to age group (25~44 years and 45~64 years) and gender were performed.
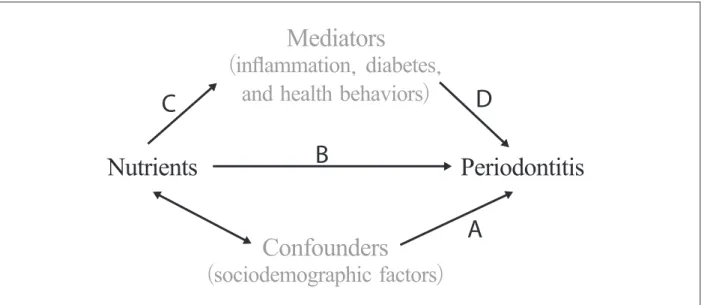
As seen in Fig. 1, the role of confounders can be determined by examining the association of confounders with periodontitis (A in Fig. 1) . The basic association between nutrients and periodontitis is evaluated (B in Fig. 1) . Adjusted odds ratio of periodontitis adjusting for sociodemographic variables represents the un- confounded total impact of shift work on periodontitis in this study. The relationship of mediators with nutrients (C in Fig. 1) and periodontitis (D in Fig. 1) should also be examined to determine the role of mediators. This role of mediators was evaluated with the percentage (%) excess odd explained, which can be calculated as [ (OR
(adjusted for sociodemographic factors)– OR
(adjusted for sociodemographic factors + mediators)) / (OR
(adjusted for sociodemographic factors)– 1)]
in this study
13).
This % excess odd explained represents the degree to which a mediator explains the relationship between shift work and periodontitis.
In this study, the characteristics of study subjects
by periodontitis status were presented with frequency
distributions for the categorical variables and mean
(and standard deviation) for continuous variable (Table
1) . Chi-square tests for categorical variables and t
tests for continuous variables were used to assess the
associations of periodontitis with confounders and
mediators (Table 1) . The association between nutrients
intake and periodontitis was presented with frequency
distribution and survey year and age-adjusted ORs
of periodontitis according to age groups (Table 2 for
male and Table 3 for female) . Series of multiple logistic
regression analysis were used to estimate the adjusted
odds ratio (AOR) of periodontitis after adjusting for mediator variables by gender (Table 4 for 25~44 years and Table 5 for 45~64 years) . The model adjusting for confounders were base model (Model 1 in the Table 4 and 5) in this analysis. IBM SPSS Statistical Software (version 22.0, IBM Corp, Armonk, NY, 2013) was used for all analysis. All reported P values are 2-tailed. P values ≤.05 were considered as statistically significant.
3. Results
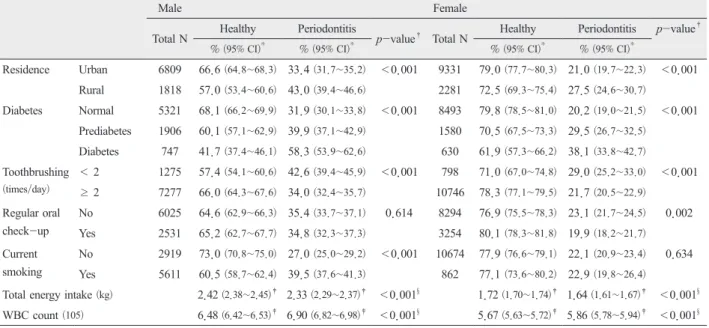
Analysis results showed that those who had low intake of nutrients had greater odds of having periodontitis than those who consumed recommended intake of nutrients. Table 1 shows that significant differences in the distribution of periodontitis were found with regards to all variables except for regular oral check-up among males and except for current smoking among females (all P values <0.001) .
Table 2 shows the relationship of periodontitis with nutrients among males. Those who took in phosphorus under EAR level had a significant survey year-, age-, and total energy intake-adjusted OR (AOR=1.86) . Those who ingested calcium and protein under EAR level showed a significant great OR (AOR=1.25 for calcium and AOR=1.52 for protein) of periodontitis. In 25~44 years old group, these significant odds ratios were marked with vitamin B2 (AOR=1.27) , iron (AOR=1.45) , phosphorus (AOR=2.68) , and protein (AOR=1.97) . The associations between nutrients and periodontitis had a pronounced tendency in 25~44 years old group.
Table 3 shows the relationship of periodontitis with nutrients among females. Those who took in nutrients under EAR level had a significant adjusted OR (AOR=1.32 for vitamin A, 1.21 for vitamin B1, 1.24 for vitamin B2, 1.21 for vitamin C, 1.25 for iron, 1.33 for
phosphorus, and 1.27 for protein) except for calcium. In 25~44 years old group, these significant odds ratios were marked with vitamin A (AOR=1.26) and vitamin C (AOR=1.32) . In 45-64 years old group, vitamin A (AOR=1.39) , vitamin B1 (AOR=1.22) , vitamin B2 (AOR=1.30) , vitamin C (AOR=1.19) , iron (AOR=1.27) , and phosphorus (AOR=1.32) .
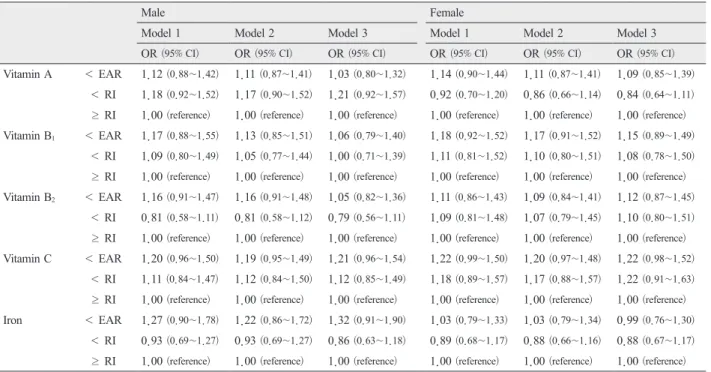
Table 4 shows series of AOR of periodontitis by nutrients after adjusting for mediators among 25~44 years old group. The base model (Model 1) was the model adjusted for confounders (survey year, age, education, occupation, income, marital status, residence, and total energy intake) . Analysis results revealed that those who ingested phosphorus and protein under EAR level had significantly higher AOR than those who ingested more than RI level (AOR=2.19 for phosphorus and 1.67 for protein) among males. The magnitude of AOR of periodontitis by nutrients attenuated with adjustment of a marker of inflammation (WBC count) except for phosphorus. The % excess odd explained for WBC count were 8.3% for vitamin A, 23.5% for vitamin B
1, 0.0% for vitamin B
2, 5.0% for vitamin C, 18.5% for iron, -10.1% for phosphorus, 21.7% for calcium, and 6.0% for protein among males and 21.4% for vitamin A, 5.6% for vitamin B
1, 18.2% for vitamin B
2, 9.1%
for vitamin C, 0.0% for iron, 36.7% for phosphorus, -25.0% for calcium, and 6.7% for protein among females. The magnitude of AOR of periodontitis by nutrients had a higher tendency with adjustment of somatic problem and health behaviors than a marker of inflammation among both gender.
Table 5 shows series of AOR of periodontitis by
nutrients after adjusting for mediators among 45~64
years old group. Analysis results revealed that
those who ingested vitamin A under EAR level had
significantly higher AOR than those who ingested
more than RI level (AOR=1.34) among females. The
B C
A D Mediators
(inflammation, diabetes, and health behaviors)
Nutrients Periodontitis
Confounders
( sociodemographic factors)
Figure 1. A model for the relationship between nutrients and periodontitis and the roles of confounders and mediators in the relationship.
Table 1. Characteristics of subjects in the 2007~2010 and 2012 KNHANES
Male Female
Total N Healthy Periodontitis
p-value† Total N Healthy Periodontitis p-value†
% (95% CI)* % (95% CI)* % (95% CI)* % (95% CI)*
Age group 25~44 yr 4349 76.6 (74.8~78.2) 23.4 (21.8~25.2) <0.001 5930 87.8 (86.5~88.9) 12.2 (11.1~13.5) <0.001 45~64 yr 4278 49.6 (47.3~51.9) 50.4 (48.1~52.7) 5682 65.8 (63.9~67.6) 34.2 (32.4~36.1)
Education ≤ primary
school 919 44.6 (40.3~49.0) 55.4 (51.0~59.7) <0.001 2214 59.1 (56.4~61.8) 40.9 (38.2~43.6) <0.001 middle school 947 45.7 (42.0~49.6) 54.3 (50.4~58.0) 1391 67.4 (64.2~70.4) 32.6 (29.6~35.8)
high school 3153 64.4 (62.1~66.5) 35.6 (33.5~37.9) 4345 79.9 (78.2~81.5) 20.1 (18.5~21.8)
> college or
higher 3483 73.8 (71.7~75.8) 26.2 (24.2~28.3) 3542 88.8 (87.5~90.1) 11.2 (9.9~12.5)
Occupation White collar 3993 70.5 (68.5~72.4) 29.5 (27.6~31.5) <0.001 3965 82.3 (80.7~83.8) 17.7 (16.2~19.3) <0.001 Blue collar 3296 56.8 (54.4~59.1) 43.2 (40.9~45.6) 2101 67.4 (64.6~70.0) 32.6 (30.0~35.4)
Others 1135 65.3 (61.8~68.7) 34.7 (31.3~38.2) 5396 78.1 (76.6~79.5) 21.9 (20.5~23.4)
Income I 2090 61.3 (58.7~63.8) 38.7 (36.2~41.4) <0.001 2819 74.7 (72.6~76.7) 25.3 (23.3~27.4) <0.001 II 2112 62.3 (59.6~64.8) 37.7 (35.2~40.4) 2861 75.8 (73.7~77.8) 24.2 (22.2~26.3)
III 2125 66.9 (64.4~69.4) 33.1 (30.6~35.6) 2881 79.6 (77.7~81.4) 20.4 (18.6~22.3) IV 2152 69.5 (66.8~71.1) 30.5 (27.9~33.2) 2861 81.8 (79.7~83.8) 18.2 (16.2~20.3) Marital status Married 6912 60.8 (59.0~62.6) 39.2 (37.4~41.0) <0.001 9373 77.0 (75.7~78.3) 23.0 (21.7~24.3) 0.001
Single 1698 77.3 (74.8~79.7) 22.7 (20.3~25.2) 2230 81.0 (78.8~83.0) 19.0 (17.0~21.2)
% excess odd explained for WBC count were 18.2%
for vitamin A, 40.0% for vitamin B
1, 28.6% for vitamin B
2, 22.2% for vitamin C, 80.0% for iron, 20.0% for phosphorus, 0.0% for calcium, and 50.0%
for protein among males and -11.8% for vitamin A, 7.7% for vitamin B
1, -11.1% for vitamin B
2, -15.4%
for vitamin C, 0.0% for iron, 4.2% for phosphorus,
0.0% for calcium, and 33.3% for protein among
females. The magnitude of AOR of periodontitis by
nutrients had a higher tendency with adjustment of
somatic problem and health behaviors than a marker of
inflammation among both gender.
Male Female Total N Healthy Periodontitis
p-value† Total N Healthy Periodontitis p-value†
% (95% CI)* % (95% CI)* % (95% CI)* % (95% CI)*
Residence Urban 6809 66.6 (64.8~68.3) 33.4 (31.7~35.2) <0.001 9331 79.0 (77.7~80.3) 21.0 (19.7~22.3) <0.001 Rural 1818 57.0 (53.4~60.6) 43.0 (39.4~46.6) 2281 72.5 (69.3~75.4) 27.5 (24.6~30.7)
Diabetes Normal 5321 68.1 (66.2~69.9) 31.9 (30.1~33.8) <0.001 8493 79.8 (78.5~81.0) 20.2 (19.0~21.5) <0.001 Prediabetes 1906 60.1 (57.1~62.9) 39.9 (37.1~42.9) 1580 70.5 (67.5~73.3) 29.5 (26.7~32.5)
Diabetes 747 41.7 (37.4~46.1) 58.3 (53.9~62.6) 630 61.9 (57.3~66.2) 38.1 (33.8~42.7) Toothbrushing
(times/day)
< 2 1275 57.4 (54.1~60.6) 42.6 (39.4~45.9) <0.001 798 71.0 (67.0~74.8) 29.0 (25.2~33.0) <0.001
≥ 2 7277 66.0 (64.3~67.6) 34.0 (32.4~35.7) 10746 78.3 (77.1~79.5) 21.7 (20.5~22.9) Regular oral
check-up
No 6025 64.6 (62.9~66.3) 35.4 (33.7~37.1) 0.614 8294 76.9 (75.5~78.3) 23.1 (21.7~24.5) 0.002 Yes 2531 65.2 (62.7~67.7) 34.8 (32.3~37.3) 3254 80.1 (78.3~81.8) 19.9 (18.2~21.7) Current
smoking
No 2919 73.0 (70.8~75.0) 27.0 (25.0~29.2) <0.001 10674 77.9 (76.6~79.1) 22.1 (20.9~23.4) 0.634 Yes 5611 60.5 (58.7~62.4) 39.5 (37.6~41.3) 862 77.1 (73.6~80.2) 22.9 (19.8~26.4)
Total energy intake (kg) 2.42 (2.38~2.45)‡ 2.33 (2.29~2.37)‡ <0.001§ 1.72 (1.70~1.74)‡ 1.64 (1.61~1.67)‡ <0.001§ WBC count (105) 6.48 (6.42~6.53)‡ 6.90 (6.82~6.98)‡ <0.001§ 5.67 (5.63~5.72)‡ 5.86 (5.78~5.94)‡ <0.001§
* Weighted percent and 95% confidence interval
† Obtained from chi-square test
‡ Weighted mean and 95% confidence interval
§ Obtained from independent t-test
Table 2. Association between nutrients and periodontitis among males
Total N Healthy Periodontitis
P-value Total 25~44yr 45~64yr
% (95% CI) % (95% CI) OR (95% CI) OR (95% CI) OR (95% CI)
Vit A < EAR 2262 62.5 (59.9~65.1) 37.5 (34.9~40.1) 0.115 1.13 (0.97~1.32) 1.18 (0.93~1.49) 1.14 (0.94~1.38)
< RI 1246 65.2 (62.0~68.2) 34.8 (31.8~38.0) 1.10 (0.93~1.30) 1.22 (0.96~1.56) 1.02 (0.81~1.27)
≥ RI 3169 65.6 (63.4~67.8) 34.4 (32.2~36.6) 1.00 (reference) 1.00 (reference) 1.00 (reference) Vit B1 < EAR 1692 60.6 (57.7~63.4) 39.4 (36.6~42.3) 0.002 1.14 (0.96~1.35) 1.27 (0.97~1.66) 1.11 (0.89~1.38)
< RI 949 63.2 (59.4~66.8) 36.8 (33.2~40.6) 1.07 (0.88~1.30) 1.08 (0.80~1.46) 1.07 (0.85~1.36)
≥ RI 4242 66.1 (64.1~68.1) 33.9 (31.9~35.9) 1.00 (reference) 1.00 (reference) 1.00 (reference) Vit B2 < EAR 3504 61.0 (58.7~63.1) 39.0 (36.9~41.3) <0.001 1.17 (0.99~1.37) 1.27 (1.00~1.59) 1.11 (0.91~1.35)
< RI 780 69.0 (65.3~72.5) 31.0 (27.5~34.7) 0.90 (0.74~1.09) 0.86 (0.62~1.17) 0.93 (0.72~1.21)
≥ RI 2599 67.5 (65.1~69.7) 32.5 (30.3~34.9) 1.00 (reference) 1.00 (reference) 1.00 (reference) Vit C < EAR 2511 64.1 (61.6~66.5) 35.9 (33.5~38.4) 0.204 1.11 (0.96~1.28) 1.23 (0.99~1.52) 1.09 (0.91~1.30)
< RI 1141 62.0 (58.5~65.5) 38.0 (34.5~41.5) 1.18 (0.99~1.40) 1.16 (0.88~1.52) 1.18 (0.95~1.48)
≥ RI 3231 65.5 (63.2~67.7) 34.5 (32.3~36.8) 1.00 (reference) 1.00 (reference) 1.00 (reference) Fe < EAR 598 62.3 (57.4~66.9) 37.7 (33.1~42.6) 0.180 1.21 (0.97~1.52) 1.45 (1.04~2.03) 1.10 (0.80~1.51)
< RI 766 67.6 (63.4~71.5) 32.4 (28.5~36.6) 1.00 (0.81~1.23) 0.97 (0.71~1.31) 1.02 (0.76~1.37)
≥ RI 5330 64.0 (62.1~65.9) 36.0 (34.1~37.9) 1.00 (reference) 1.00 (reference) 1.00 (reference) Phos < EAR 186 56.5 (48.0~64.7) 43.5 (35.3~52.0) 0.138 1.86 (1.24~2.80) 2.68 (1.55~4.63) 1.34 (0.79~2.27)
< RI 224 62.9 (54.7~70.5) 37.1 (29.5~45.3) 1.08 (0.73~1.59) 0.84 (0.40~1.75) 1.27 (0.79~2.05)
≥ RI 6430 64.7 (63.0~66.5) 35.3 (33.5~37.0) 1.00 (reference) 1.00 (reference) 1.00 (reference) Ca < EAR 4195 63.6 (61.6~65.7) 36.4 (34.3~38.4) 0.267 1.25 (1.06~1.47) 1.24 (0.97~1.59) 1.22 (0.99~1.49)
< RI 1022 65.2 (61.7~68.5) 34.8 (31.5~38.3) 1.07 (0.88~1.31) 1.04 (0.75~1.43) 1.07 (0.82~1.39)
≥ RI 1648 66.1 (63.2~69.0) 33.9 (31.0~36.8) 1.00 (reference) 1.00 (reference) 1.00 (reference) Protein < EAR 640 59.6 (54.9~64.1) 40.4 (35.9~45.1) 0.019 1.52 (1.20~1.93) 1.97 (1.41~2.74) 1.18 (0.86~1.62)
< RI 662 61.3 (56.8~65.7) 38.7 (34.3~43.2) 1.14 (0.90~1.43) 1.20 (0.85~1.69) 1.07 (0.79~1.44)
≥ RI 5581 65.3 (63.4~67.1) 34.7 (32.9~36.6) 1.00 (reference) 1.00 (reference) 1.00 (reference) Adjusted for survey year, age and total energy
Bold denotes statistical significance at P<0.05.
EAR= estimated average requirements, RI= recommended intake
Table 3. Association between nutrients and periodontitis among female
Healthy Periodontitis
P-value Total 25~44yr 45~64yr
Total N % (95% CI) % (95% CI) OR (95% CI) OR (95% CI) OR (95% CI) Vit A < EAR 3916 74.6 (72.6~76.4) 25.4 (23.6~27.4) <0.001 1.32 (1.15~1.51) 1.26 (1.00~1.58) 1.39 (1.18~1.64)
< RI 1836 79.9 (77.7~81.9) 20.1 (18.1~22.3) 1.08 (0.92~1.26) 0.96 (0.74~1.25) 1.16 (0.94~1.43)
≥ RI 4633 79.9 (78.3~81.3) 20.1 (18.7~21.7) 1.00 (reference) 1.00 (reference) 1.00 (reference) Vit B1 < EAR 4263 74.8 (72.9~76.6) 25.2 (23.4~27.1) <0.001 1.21 (1.03~1.41) 1.23 (0.96~1.58) 1.22 (1.01~1.48)
< RI 1759 78.2 (75.8~80.5) 21.8 (19.5~24.2) 1.07 (0.89~1.29) 1.12 (0.82~1.54) 1.06 (0.85~1.31)
≥ RI 4626 80.5 (78.9~82.0) 19.5 (18.0~21.1) 1.00 (reference) 1.00 (reference) 1.00 (reference) Vit B2 < EAR 5531 74.4 (72.7~76.0) 25.6 (24.0~27.3) <0.001 1.24 (1.07~1.43) 1.19 (0.93~1.52) 1.30 (1.08~1.57)
< RI 1478 80.6 (77.9~83.1) 19.4 (16.9~22.1) 1.02 (0.83~1.25) 1.11 (0.82~1.51) 0.97 (0.75~1.24)
≥ RI 3639 81.8 (80.1~83.3) 18.2 (16.7~19.9) 1.00 (reference) 1.00 (reference) 1.00 (reference) Vit C < EAR 4718 76.6 (74.9~78.3) 23.4 (21.7~25.1) 0.004 1.21 (1.07~1.38) 1.32 (1.07~1.62) 1.19 (1.01~1.40)
< RI 1562 76.5 (73.9~78.9) 23.5 (21.1~26.1) 1.22 (1.03~1.44) 1.23 (0.93~1.62) 1.20 (0.97~1.48)
≥ RI 4368 79.7 (78.1~81.2) 20.3 (18.8~21.9) 1.00 (reference) 1.00 (reference) 1.00 (reference) Fe < EAR 3664 80.1 (78.3~81.8) 19.9 (18.2~21.7) <0.001 1.25 (1.06~1.46) 1.12 (0.87~1.44) 1.27 (1.04~1.55)
< RI 1877 81.5 (79.3~83.6) 18.5 (16.4~20.7) 0.95 (0.80~1.12) 0.92 (0.71~1.20) 0.91 (0.73~1.13)
≥ RI 4956 74.6 (72.9~76.3) 25.4 (23.7~27.1) 1.00 (reference) 1.00 (reference) 1.00 (reference) Phos < EAR 1158 72.2 (68.9~75.3) 27.8 (24.7~31.1) <0.001 1.33 (1.08~1.63) 1.36 (0.96~1.91) 1.32 (1.04~1.68)
< RI 1023 77.5 (74.1~80.5) 22.5 (19.5~25.9) 0.99 (0.81~1.22) 0.85 (0.61~1.20) 1.10 (0.85~1.43)
≥ RI 8462 78.7 (77.4~80.0) 21.3 (20.0~22.6) 1.00 (reference) 1.00 (reference) 1.00 (reference) Ca < EAR 7326 76.5 (75.1~77.9) 23.5 (22.1~24.9) <0.001 1.10 (0.94~1.29) 1.17 (0.91~1.52) 1.08 (0.89~1.33)
< RI 1305 80.8 (78.2~83.2) 19.2 (16.8~21.8) 1.01 (0.82~1.24) 1.11 (0.80~1.54) 0.92 (0.71~1.20)
≥ RI 2000 80.9 (78.8~83.0) 19.1 (17.0~21.2) 1.00 (reference) 1.00 (reference) 1.00 (reference) Protein < EAR 1732 72.8 (70.1~75.4) 27.2 (24.6~29.9) <0.001 1.27 (1.06~1.52) 1.42 (1.03~1.94) 1.23 (0.99~1.52)
< RI 1670 75.6 (72.9~78.1) 24.4 (21.9~27.1) 1.14 (0.95~1.36) 1.19 (0.90~1.58) 1.14 (0.92~1.42)
≥ RI 7246 79.6 (78.2~80.9) 20.4 (19.1~21.8) 1.00 (reference) 1.00 (reference) 1.00 (reference) Adjusted for survey year, age and total energy
Bold denotes statistical significance at P<0.05.
EAR= estimated average requirements, RI= recommended intake
Table 4. Odds ratios of periodontitis by nutrient level among 25~44 years group
Male Female
Model 1 Model 2 Model 3 Model 1 Model 2 Model 3
OR (95% CI) OR (95% CI) OR (95% CI) OR (95% CI) OR (95% CI) OR (95% CI) Vitamin A < EAR 1.12 (0.88~1.42) 1.11 (0.87~1.41) 1.03 (0.80~1.32) 1.14 (0.90~1.44) 1.11 (0.87~1.41) 1.09 (0.85~1.39)
< RI 1.18 (0.92~1.52) 1.17 (0.90~1.52) 1.21 (0.92~1.57) 0.92 (0.70~1.20) 0.86 (0.66~1.14) 0.84 (0.64~1.11)
≥ RI 1.00 (reference) 1.00 (reference) 1.00 (reference) 1.00 (reference) 1.00 (reference) 1.00 (reference) Vitamin B1 < EAR 1.17 (0.88~1.55) 1.13 (0.85~1.51) 1.06 (0.79~1.40) 1.18 (0.92~1.52) 1.17 (0.91~1.52) 1.15 (0.89~1.49)
< RI 1.09 (0.80~1.49) 1.05 (0.77~1.44) 1.00 (0.71~1.39) 1.11 (0.81~1.52) 1.10 (0.80~1.51) 1.08 (0.78~1.50)
≥ RI 1.00 (reference) 1.00 (reference) 1.00 (reference) 1.00 (reference) 1.00 (reference) 1.00 (reference) Vitamin B2 < EAR 1.16 (0.91~1.47) 1.16 (0.91~1.48) 1.05 (0.82~1.36) 1.11 (0.86~1.43) 1.09 (0.84~1.41) 1.12 (0.87~1.45)
< RI 0.81 (0.58~1.11) 0.81 (0.58~1.12) 0.79 (0.56~1.11) 1.09 (0.81~1.48) 1.07 (0.79~1.45) 1.10 (0.80~1.51)
≥ RI 1.00 (reference) 1.00 (reference) 1.00 (reference) 1.00 (reference) 1.00 (reference) 1.00 (reference) Vitamin C < EAR 1.20 (0.96~1.50) 1.19 (0.95~1.49) 1.21 (0.96~1.54) 1.22 (0.99~1.50) 1.20 (0.97~1.48) 1.22 (0.98~1.52)
< RI 1.11 (0.84~1.47) 1.12 (0.84~1.50) 1.12 (0.85~1.49) 1.18 (0.89~1.57) 1.17 (0.88~1.57) 1.22 (0.91~1.63)
≥ RI 1.00 (reference) 1.00 (reference) 1.00 (reference) 1.00 (reference) 1.00 (reference) 1.00 (reference) Iron < EAR 1.27 (0.90~1.78) 1.22 (0.86~1.72) 1.32 (0.91~1.90) 1.03 (0.79~1.33) 1.03 (0.79~1.34) 0.99 (0.76~1.30)
< RI 0.93 (0.69~1.27) 0.93 (0.69~1.27) 0.86 (0.63~1.18) 0.89 (0.68~1.17) 0.88 (0.66~1.16) 0.88 (0.67~1.17)
≥ RI 1.00 (reference) 1.00 (reference) 1.00 (reference) 1.00 (reference) 1.00 (reference) 1.00 (reference)
Male Female
Model 1 Model 2 Model 3 Model 1 Model 2 Model 3
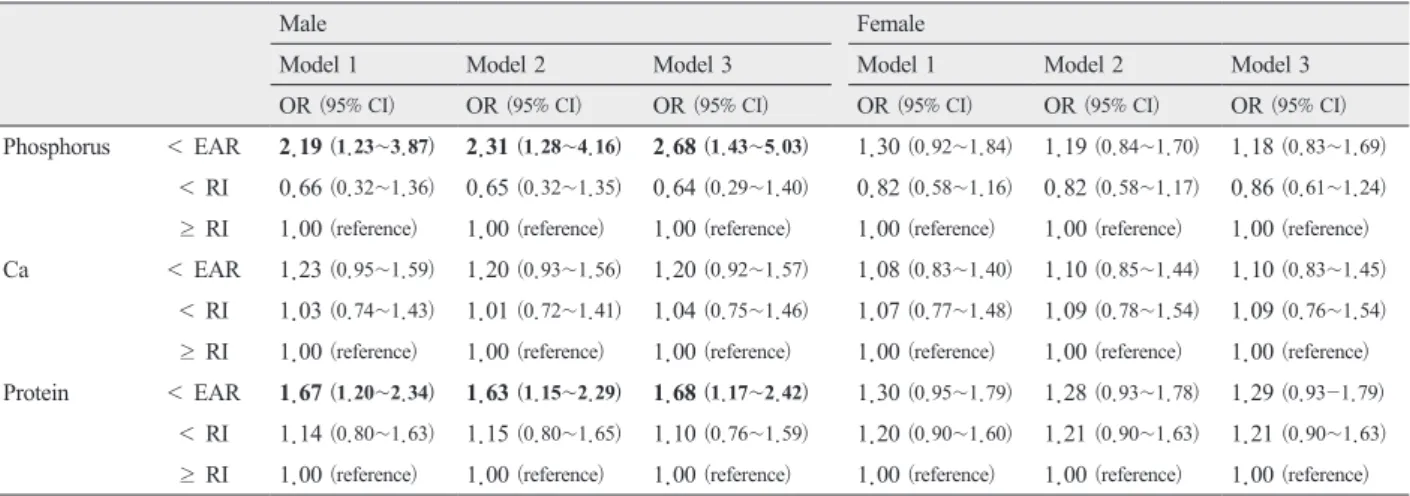
OR (95% CI) OR (95% CI) OR (95% CI) OR (95% CI) OR (95% CI) OR (95% CI) Phosphorus < EAR 2.19 (1.23~3.87) 2.31 (1.28~4.16) 2.68 (1.43~5.03) 1.30 (0.92~1.84) 1.19 (0.84~1.70) 1.18 (0.83~1.69)
< RI 0.66 (0.32~1.36) 0.65 (0.32~1.35) 0.64 (0.29~1.40) 0.82 (0.58~1.16) 0.82 (0.58~1.17) 0.86 (0.61~1.24)
≥ RI 1.00 (reference) 1.00 (reference) 1.00 (reference) 1.00 (reference) 1.00 (reference) 1.00 (reference) Ca < EAR 1.23 (0.95~1.59) 1.20 (0.93~1.56) 1.20 (0.92~1.57) 1.08 (0.83~1.40) 1.10 (0.85~1.44) 1.10 (0.83~1.45)
< RI 1.03 (0.74~1.43) 1.01 (0.72~1.41) 1.04 (0.75~1.46) 1.07 (0.77~1.48) 1.09 (0.78~1.54) 1.09 (0.76~1.54)
≥ RI 1.00 (reference) 1.00 (reference) 1.00 (reference) 1.00 (reference) 1.00 (reference) 1.00 (reference) Protein < EAR 1.67 (1.20~2.34) 1.63 (1.15~2.29) 1.68 (1.17~2.42) 1.30 (0.95~1.79) 1.28 (0.93~1.78) 1.29 (0.93-1.79)
< RI 1.14 (0.80~1.63) 1.15 (0.80~1.65) 1.10 (0.76~1.59) 1.20 (0.90~1.60) 1.21 (0.90~1.63) 1.21 (0.90~1.63)
≥ RI 1.00 (reference) 1.00 (reference) 1.00 (reference) 1.00 (reference) 1.00 (reference) 1.00 (reference) Model 1 was adjusted for survey year, age, education, occupation, income, marital status, residence, and total energy intake.
Model 2 was adjusted for survey year, age, education, occupation, income, marital status, residence, total energy intake, and WBC count.
Model 3 was adjusted for survey year, age, education, occupation, income, marital status, residence, diabetes, toothbrushing habit, regular oral check-up, smoking, and total energy intake.
Bold denotes statistical significance at P<0.05.
EAR= estimated average requirements, RI= recommended intake
Table 5. Odds ratios of periodontitis by nutrient level among 45~64 years group
Male Female
Model 1 Model 2 Model 3 Model 1 Model 2 Model 3
OR (95% CI) OR (95% CI) OR (95% CI) OR (95% CI) OR (95% CI) OR (95% CI) Vitamin A < EAR 1.11 (0.92~1.35) 1.09 (0.90~1.32) 1.04 (0.85~1.27) 1.34 (1.13~1.59) 1.38 (1.16~1.64) 1.37 (1.15~1.63)
< RI 1.05 (0.84~1.33) 1.05 (0.83~1.32) 1.03 (0.81~1.31) 1.16 (0.94~1.43) 1.18 (0.95~1.46) 1.16 (0.93~1.45)
≥ RI 1.00 (reference) 1.00 (reference) 1.00 (reference) 1.00 (reference) 1.00 (reference) 1.00 (reference) Vitamin B1 < EAR 1.05 (0.84~1.32) 1.03 (0.82~1.30) 1.01 (0.80~1.27) 1.13 (0.93~1.37) 1.12 (0.92~1.37) 1.15 (0.94~1.40)
< RI 1.01 (0.80~1.29) 1.04 (0.82~1.31) 1.00 (0.79~1.28) 1.03 (0.83~1.29) 1.02 (0.81~1.28) 1.04 (0.82~1.30)
≥ RI 1.00 (reference) 1.00 (reference) 1.00 (reference) 1.00 (reference) 1.00 (reference) 1.00 (reference) Vitamin B2 < EAR 1.07 (0.87~1.32) 1.05 (0.85~1.30) 1.00 (0.81~1.24) 1.18 (0.97~1.43) 1.20 (0.99~1.46) 1.23 (1.01~1.49)
< RI 0.93 (0.71~1.20) 0.93 (0.72~1.21) 0.91 (0.70~1.20) 0.91 (0.71~1.18) 0.95 (0.73~1.23) 0.95 (0.73~1.24)
≥ RI 1.00 (reference) 1.00 (reference) 1.00 (reference) 1.00 (reference) 1.00 (reference) 1.00 (reference) Vitamin C < EAR 1.09 (0.91~1.31) 1.07 (0.89~1.29) 0.99 (0.82~1.20) 1.13 (0.95~1.34) 1.15 (0.97~1.37) 1.15 (0.96~1.37)
< RI 1.18 (0.94~1.49) 1.16 (0.92~1.47) 1.10 (0.86~1.39) 1.18 (0.95~1.46) 1.21 (0.97~1.50) 1.22 (0.98~1.51)
≥ RI 1.00 (reference) 1.00 (reference) 1.00 (reference) 1.00 (reference) 1.00 (reference) 1.00 (reference) Iron < EAR 1.05 (0.76~1.46) 1.01 (0.72~1.41) 0.92 (0.65~1.31) 1.19 (0.96~1.46) 1.19 (0.96~1.47) 1.17 (0.94~1.45)
< RI 1.02 (0.75~1.38) 0.99 (0.72~1.34) 0.99 (0.72~1.36) 0.89 (0.71~1.11) 0.92 (0.73~1.16) 0.94 (0.74~1.18)
≥ RI 1.00 (reference) 1.00 (reference) 1.00 (reference) 1.00 (reference) 1.00 (reference) 1.00 (reference) Phosphorus < EAR 1.30 (0.74~2.29) 1.24 (0.69~2.22) 1.03 (0.58~1.85) 1.24 (0.96~1.59) 1.23 (0.94~1.59) 1.22 (0.94~1.58)
< RI 1.25 (0.76~2.05) 1.21 (0.71~2.05) 1.08 (0.62~1.86) 1.01 (0.77~1.32) 0.98 (0.74~1.29) 0.95 (0.72~1.26)
≥ RI 1.00 (reference) 1.00 (reference) 1.00 (reference) 1.00 (reference) 1.00 (reference) 1.00 (reference) Ca < EAR 1.19 (0.97~1.47) 1.19 (0.96~1.48) 1.13 (0.91~1.40) 0.99 (0.81~1.22) 0.99 (0.81~1.22) 1.01 (0.82~1.24)
< RI 1.05 (0.80~1.38) 1.06 (0.81~1.39) 1.02 (0.77~1.33) 0.89 (0.68~1.16) 0.89 (0.68~1.16) 0.87 (0.67~1.14)
≥ RI 1.00 (reference) 1.00 (reference) 1.00 (reference) 1.00 (reference) 1.00 (reference) 1.00 (reference) Protein < EAR 1.06 (0.77~1.47) 1.03 (0.74~1.43) 0.93 (0.66~1.30) 1.12 (0.90~1.39) 1.08 (0.86~1.35) 1.07 (0.85~1.34)
< RI 1.00 (0.74~1.35) 0.96 (0.70~1.31) 0.94 (0.69~1.29) 1.07 (0.86~1.33) 1.07 (0.85~1.34) 1.10 (0.88~1.39)
≥ RI 1.00 (reference) 1.00 (reference) 1.00 (reference) 1.00 (reference) 1.00 (reference) 1.00 (reference) Model 1 was adjusted for survey year, age, education, occupation, income, marital status, residence, and total energy intake.
Model 2 was adjusted for survey year, age, education, occupation, income, marital status, residence, total energy intake, and WBC count.
Model 3 was adjusted for survey year, age, education, occupation, income, marital status, residence, diabetes, toothbrushing habit, regular oral check- up, smoking, and total energy intake.
Bold denotes statistical significance at P<0.05.
EAR= estimated average requirements, RI= recommended intake
4. Discussion
Using an FFQ to estimate daily nutrient intake in a representative Korean sample, we found that, in their daily diets, those who ingested lower quantities of nutrients (calcium in males, vitamin-A, -B
1, -B
2, -C, and iron in females, phosphorus and protein in both genders) associated with having periodontitis in survey year-, age-, and total energy intake-adjusted model. This association modestly attenuated with further adjustment of socioeconomic status (education, occupation, income, marital status, and residence) but remain statistically significant.
Vitamin A has been shown to increase the peroxisome proliferator-activity binding to the peroxisome proliferator-response element that participates in the induction of the Superoxide Dismutase gene and to increase the activity of catalase, Superoxide Dismutase, and glutathione reductase, suggesting that vitamin A may improve the antioxidant defense system
14). All these findings indicate that vitamin A deficiency related inflammation and oxidative stress impairs activities of antioxidant enzymes in vascularture and play a critical role in vascular injury
15)and this might be related to the periodontal tissue destruction. Although there has been a few studies about the association between vitamin A and periodontitis
16), the result of this study partly justified the previous relationship in females.
Thiamin, also known as vitamin B
1, is required for the normal function of muscles and nerves because it converts glucose to energy
17). Riboflavin, also known as vitamin B
2, have an antioxidant action independently or as a component of the glutathione redox cycle and can protect the body against oxidative stress, especially lipid peroxidation and reperfusion oxidative injury. The mechanisms by which riboflavin protects the body against oxidative stress may be attributed to the glutathione redox cycle and also to other possible
mechanisms such as the conversion of reduced riboflavin to the oxidised form
18). One previous study demonstrated that nutrient supplements, in particular vitamin-B complex (Vit-B) , can positively influence periodontal wound healing processes
19). The importance of ascorbic acid, better known as vitamin C, for periodontal health has long been known
8). During the last decades there is growing evidence for the importance of vitamin C as antioxidant against reactive oxygen species (ROS) and in leucocyte function in healthy as well as periodontally diseased subjects
20). In a rat periodontitis model, increases in plasma vitamin C levels after vitamin C intake was beneficial in improving periodontitis-induced oxidative stress by down-regulating inflammatory gene expression
21). Our results did not support the previous study for vitamin B
1, B
2, and C in males but in females only in a survey year-, age adjusted model.
On the other hand, phosphorus and protein intakes
were associated with periodontitis among males in
our study. From a nutritional standpoint, phosphorus
and calcium are essential for the formation of
hydroxyapatite, the main crystalline component of
bone
22). There is evidence that low calcium and high
phosphorus intake may have a negative effect on
bone health
23). Utilizing data from the third National
Health and Nutrition Examination Survey, it has been
shown that low dietary intake of calcium results in
more severe periodontal disease
23). Most population-
based studies suggest that greater dietary protein intake
is associated with higher bone mineral density (BMD)
in middle-aged and older adults
24). Some results
showed positive association between protein intake
and higher BMD among women
25). However, our
results showed inconsistency with previous reports. The
positive associations between phosphorus/protein and
periodontitis were seen in younger male population.
Restriction of dietary intake of phosphorus generally requires some reduction in the allowable protein intake
26). The similar associations of phosphorus and protein in this study might be due to the characteristics of phosphorus and protein intake.
Previous studies found no significant difference of serumal iron level between periodontitis patients and healthy controls
27). Although there was a weak association between iron intake and periodontitis among females in our study, no association was found in a sociodemographic factor-, somatic problem-, and health behavior-adjusted model.
Gender differences have been reported for dietary intakes and eating behaviours
28). Previous studies show that women tend to have better overall diet quality than men
29). Furthermore, studies also show that dietary intakes of low energy density are associated with a better quality of dietary intakes and a lower BMI
30)and evidence of the beneficial influence of healthy eating habits on health status is well established in the literature
31). In our gender stratified analyses in Table 4 and 5, women had no significant association of nutrients with periodontitis except vitamin A in 45~64 years group. This might be due to overall better diet quality of women prohibit the impact of low nutrient intake to the periodontal tissue destruction. Moreover, low nutrient intake in younger men especially for phosphorus and protein showed strong association with periodontitis. Our results suggested that periodontal bone health might be vulnerable to the low intake of phosphorus and protein among younger population.
Some limitations should be considered in interpreting our findings. First is the selection bias during enrollment, in that more malnourished patients were less likely to enroll. However, selection bias in this direction would lead to bias toward the null; therefore, without this bias, our results may have been even
stronger. Second is the recall bias during the FFQs.
FFQs may underestimate the amount of daily nutrient intake. However, our findings are given on the basis of EAR and RI rather than absolute amounts of dietary intakes. Finally, the cross-sectional design prohibited us from inferring causal relationships. Further well designed prospective investigations are required to determine the causality between nutrients intake and periodontitis to reduce the above mentioned limitations.
The Food and Nutrition Board cautions that FFQ data may not be accurate enough to use to assess the adequacy of dietary intakes of individuals or small groups of people. FFQs can provide estimates of the long-term, usual dietary intake of certain foods and nutrients in populations of subjects
32). Because the FFQ is a reliable tool for ranking individuals according to their dietary intake, assessment of dietary nutrients by FFQ was a suitable choice for this study.
There are several strengths to this study, including the relatively large representative sample of Koreans, the comprehensive dietary evaluations and the detailed evaluation of the clinical and comorbid states of the patients by study physicians. Our study has been extensively characterized for markers of inflammation and nutritional status, and energy intake. A unique feature of this study is its novelty in assessing various nutrients intake measured by FFQ, which is a validated method to estimate long-term usual dietary intake at a population basis and almost certainly a more valid tool for estimating overall nutrients burden.
5. Conclusions
There is an association between low intake of
nutrients and periodontitis. The increased risk of
periodontitis apparent in some low-level nutrient
intake suggests that people with periodontal disease should be vigilant about undernourishment. Screening programmes for undernourished people would have yielded substantial help of treatable periodontal risks. We need more prospective studies with large representative populations, good descriptions of the nutritional status, long follow-ups, and reliable measurements of health outcomes. The knowledge generated from such studies could be used to develop mechanism-specific interventions aimed at improving the oral health of adults with malnutrition.
Acknowledgments
All authors want to express their special appreciation to all participants in the KNHANES.
Conflicts
No potential conflict of interest relevant to this article was reported.
ORCID ID
Mi-Sun Kim, https://orcid.org/0000-0002-3191- 9541
Min-Sun Lee, https://orcid.org/ 0000-0001- 6938-8689
Dong-Hun Han, https://orcid.org/ 0000-0001- 6427-313
References
1. Pihlstrom BL, Michalowicz BS, Johnson NW.
Periodontal diseases. Lancet 2005;366:1809-1820.
2. Fialkow L, et al. Reactive oxygen and nitrogen species as signaling molecules regulating neutrophil function. Free Radic Bio Med 2007;42:153-164.
3. Parihar A, et al. Oxidative stress and anti-oxidative mobilization in burn injury. Burns 2008;34:6-17.
4. D’Aiuto F, et al. Oxidative stress, systemic inflammation, and severe periodontitis. J Dent Res 2010;89:1241-1246.
5. Van der Velden U, et al. Micronutritional approaches to periodontal therapy. J Clin Periodontol 2011;
38 (11) :142-158.
6. Bawadi HA et al. The association between periodontal disease, physical activity and healthy diet among adults in Jordan. J Periodontal Res 2011;46:74-81.
7. Amaliya, et al. Java project on periodontal diseases:
the relationship between vitamin C and the severity of periodontitis. J Clin Periodontol 2007;34 (4) :299-304.
8. Staudte H, et al. Comparison of nutrient intake between patients with periodontitis and healthy subjects. Quintessence Int 2012;43:907-916.
9. Kweon S, et al. Data Resource Profile: The Korea National Health and Nutrition Examination Survey (KNHANES) . Int J Epidemio 2014;43:69-77.
10. Oh K, et al. Plan and operation of the 4th Korea national health and nutrition examination survey (KNHANES IV) . Korean J Epidemiol 2007;29:139-145.
11. Paik HY. Dietary Reference Intakes for Koreans (KDRIs) . Asia Pac J Clin Nutr. 2008;17:416-9.
12. Ainamo J, et al. Development of the World Health Organization (WHO) community periodontal index of treatment needs (CPITN) . Int Dent J 1982;32:281-291.
13. Szklo M, Nieto FJ. Epidemiology. beyond the basics. Gaithersburg: An Aspen Publication; 2000 14. Kiningham KK, et al. All-trans-retinoic acid
induces manganese superoxide dismutase in human
neuroblastoma through NF-kappaB. Free Radic
Bio Med 2008;44:1610-1616.
15. Gatica LV, et al. Implication of vitamin A deficiency on vascular injury related to inflammation and oxidative stress. Effects on the ultrastructure of rat aorta. Eur J Nutr 2012;51:97-106.
16. Cerna H, et al. Vitamin A level in patients with chronic periodontal disease. Preliminary notice. Acta Univ Palacki Olomuc Fac Med 1984; 107:163-165.
17. Muroyama K, et al. Effects of intake of a mixture of thiamin, arginine, caffeine, and citric acid on adiposity in healthy subjects with high percent body fat. Biosci Biotechnol Biochem 2003;67:2325-2333.
18. Ashoori M, Saedisomeolia A. Riboflavin (vitamin B
2) and oxidative stress: a review. Br J Nutr 2014;
111:1985-1991.
19. Nieves JW. Osteoporosis: the role of micronutrients.
Am J Clin Nutr 2005;81:1232-1239.
20. Chapple I L, Matthews JB. The role of reactive oxygen and antioxidant species in periodontal tissue destruction. Periodontol 2000 2007; 43:160-232.
21. Tomofuji T, et al. Effects of vitamin C intake on gingival oxidative stress in rat periodontitis. Free Radic Bio Med 2009;46:163-168.
22. Nishida M, et al. Calcium and the risk for periodontal disease. J Periodontol 2000;71:1057-1066.
23. Vicente-Rodriguez G, et al. Independent and combined effect of nutrition and exercise on bone mass development. J Bone Miner Metab 2008;26:416-424.
24. Beasley JM, et al. Biomarker-calibrated protein intake and bone health in the Women’s Health Initiative clinical trials and observational study. Am J Clin Nutr 2014;99:934-940.
25. Sahni S, et al. Association of total protein intake with bone mineral density and bone loss in men and women from the Framingham Offspring Study.
Public Health Nutr 2014;17 (11) :2570-2576.
26. Shinaberger CS, et al. Is controlling phosphorus by decreasing dietary protein intake beneficial or harmful in persons with chronic kidney disease?
Am J Clin Nutr 2008;88:1511-1518.
27. Thomas B, et al. Evaluation of micronutrient (zinc, copper and iron) levels in periodontitis patients with and without diabetes mellitus type 2: a biochemical study. Indian J Dent Res 2013;24:468-473.
28. Li KK, et al. An examination of sex differences in relation to the eating habits and nutrient intakes of university students. J Nut Educ Behav 2012;44:246- 250.
29. Garriguet D. Diet quality in Canada. Health Rep.2009;20:41-52.
30. Rolls BJ, et al. Changing the energy density of the diet as a strategy for weight management. J Am Diet Assoc 2005;105:98-103.
31. Sofi F, et al. Adherence to Mediterranean diet and health status: meta-analysis. BMJ 2008;337:a1344.
32. Kalantar-Zadeh K, et al. Food intake characteristics
of hemodialysis patients as obtained by food
frequency questionnaire. J Ren Nutr 2002;12:17-31.
ABSTRACT
Lower Nutrient Intake and Periodontitis: Findings from the Korea National Health and Nutrition Examination Surveys
Min-Sun Lee
1· Dong-Hun Han
2· Mi-Sun Kim
1†1
Department of Dental Hygiene, Kyungdong University, Gangwon-do, Korea
2