285
and Safety
Available online at http://www.foodhygiene.or.kr
http://dx.doi.org/10.13103/JFHS.2014.29.4.285
Development and Interlaboratory Validation of an Analytical Method for the Determination of Saflufenacil in Agricultural Products by
HPLC-UVD and LC-MS
Jung-Ah Do1†, Hyejin Park1†, Ji-Eun Kwon1, Jae-Ho Oh1, Yoon-Jae Cho1, Moon-Ik Chang1, Won-Jo Choi2, Hyun-Sook Lee3, and Jin-Hwan Hong1*
1Food Chemical Residues Division, National Institute of Food and Drug Safety Evaluation, Osong, Cheong-ju, Chungbuk 363-700, Korea
2Hazardous Substances Analysis Division, Center for Food and Drug Analysis, Busan regional Korea Food and Drug Administration, Busan 608-080, Korea
3Hazardous Substances Analysis Division, Center for Food and Drug Analysis, Gyeongin regional Korea Food and Drug Administration, Incheon 402-835, Korea
(Received May 4, 2014/Revised August 10, 2014/Accepted November 7, 2014)
ABSTRACT - Saflufenacil is a low-volatile and uracil-based herbicide. This herbicide is used for pre-and post- emergence control of major broadleaf weeds. The objective of present study was to develop and validate an analytical method for saflufenacil determination in agricultural products for ensuring the food safety. The saflufenacil residues in samples were extracted with acetone, dichloromethane, and then purified with silica and graphitized carbon car- tridge. The purified samples were analyzed by HPLC-UVD and confirmed with LC-MS. The linear range of saflufenacil was 0.1~5.0µg mL−1 with the correlation coefficient (r) = 0.999. Average recoveries of saflufenacil ranged from 80.5% to 110.2% at the spiked level of 0.02~0.5 mg kg−1, while the relative standard deviation was 0.3~7.3%. In addition, the limit of detection and limit of quantification were 0.005 and 0.02 mg L−1, respectively.
Furthermore, an interlaboratory study among three labs was conducted to validate the method, and the results were satisfactory.
Key words : saflufenacil, herbicide, HPLC-UVD, LC-MS, interlaboratory validation
Saflufenacil, 2-chloro-5-[3,6-dihydro-3-methyl-2,6-dioxo- 4-(trifluoromethyl)-1(2H)-pyrimidi nyl]-4-fluoro-N-[[methyl (1-methylethyl)amino]sulfonyl]benzamide is a selective uracil and amide herbicide belonging to pyrimidinedione chemical class. It acts as an inhibitor of protoporphyrinogen IX oxidase, which is an enzyme involved in heme and chlorophyll biosynthesis1,2). Saflufenacil is developed to control annual broadleaf weeds such as horseweed (Conyza Canadensis), kochia (Kochia scoparia), and Russian thistle (Salsola iberica) and is used in pre-plant and pre-emergence applications to field crops (cereals, oilseeds, legume vege- tables), post-emergence under-canopy applications to fruit tree orchards, nut tree orchards, and vineyards, as well as in
the foliar treatments for desiccation and/or defoliation of green plant tissue before harvest (legumes, potatoes, sugar cane, coffee beans, sunflower, soybean, and cotton). The desiccation uses for soybean, peas and beans, and cotton, as well as for tropical fruits (bananas and mango) have been submitted to the United States Environmental Protection Agency (US EPA)3-5). The EPA has established a saflufenacil tolerance of 0.03 mg kg−1 for citrus fruit, stone fruit, and pome fruit, and their commodities, and of ~17.0 mg kg−1 for pea and hay (EPA 40 CFR 180.649)6). Saflufenacil was evaluated by the Joint FAO/WHO Meeting on Pesticide Residues (JMPR) in 2011 and a summary evaluation report was issued in January 20127). The JMPR established maxi- mum residue limits (MRLs) for saflufenacil residues in agricultural products of 0.01-0.1 mg kg−1. In Japan, MRLs of 0.01-1.0 mg kg−1 for saflufenacil residues have been established for 63 food items8).
Saflufenacil is used widely for treatment of numerous crops in many countries around the world, so it is necessary to determine the levels of its residues in domestic and imported agricultural products with a very reliable and
†These authors equally attributed to the article.
*Correspondence to: Jin-Hwan Hong, Food Chemical Residues Division, National Institute of Food and Drug Safety Eval- uation, Osong Health Technology Administration Complex, 187, Osongsaengmyeong2(i)-ro, Osong-eup, Cheong-ju, Chun- gcheongbuk-do 363-700, Korea
Tel: 82-43-719-5305, Fax: 82-43-719-5300 E-mail: [email protected]
sensitive analytical method for food safety management. US EPA, EFSA, and FAO developed enforcement methods with liquid chromatography/mass spectroscopy/mass spectroscopy (LC-MS/MS) to enforce the MRL (tolerance) expression2,7,19). Application of mass spectrometry in combination with modern HPLC leads often to good sensitivity as well as high selectivity. However, LC-MS/MS method is about 2-3 percent poorer precision against a well-established HPLC method. In addition, the initial costs for a sophisticated LC- MS/MS instrument are about 10 times higher than for conventional HPLC equipment, so it is hard to obtain in some food safety inspection agencies because of their lack of economic condition. Therefore, the objective of this study was to develop and validate an analytical method using conventional HPLC method for the determination of saflufenacil residues at the established new MRLs (0.03-0.7 mg kg−1) for a wide range of agricultural products including rice, soybean, and orange in the Republic of Korea in 2012.
Material and Methods
Reagents, Chemicals, and Samples
A certificated analytical standard of saflufenacil (99.6%) was provided by BASF (BASF Asia Pacific, Seoul, Korea).
Pesticide-grade acetone, hexane, methanol, and dichlorometh- ane were purchased from Merck (Darmstadt, Germany).
Liquid chromatography (LC)-grade water was obtained by purifying distilled water in a high-performance reverse osmosis (RO) system (Saritorius Stedim Biotech, Göttingen, Germany). Other reagents such as sodium chloride and sodium sulfate anhydrous were purchased from Wako (Osaka, Japan). Silica solid-phase extraction (SPE) cartridges (6cc, 1 g) and carbon SPE cartridges (500 mg, 6 mL) were pur- chased from Waters (Milford, MA, USA) and Agilent Technologies (Santa Clara, CA, USA), respectively.
To test the applicability of the method for a variety of agricultural products, mandarin (fruit), hulled rice (cereal grains), pepper (vegetables), potato (potatoes), and soybean (beans) were selected as representative crops. Agricultural products used in this experiment were purchased from the nation’s major retailers. Each sample was homogenized and stored in a deep freezer (−50oC) before use.
Stock and Working Standard Solution
A standard stock solution of saflufenacil was prepared in methanol at 500µg mL−1 and stored in a freezer at −18oC.
The stock standard solutions prepared were used within 3 months of preparation. Suitable concentrations of the working standards were prepared from the stock solutions by serial dilution using 50% methanol, immediately before sample preparation.
Extraction Procedure
Crop samples (20 ± 0.1 g) were placed into a 400 mL capped beaker. The samples were extracted with 100 mL of acetone for 5 min. The homogenized samples were subjected to vacuum filtration, and then transferred into a 500 mL round bottom flask for evaporation in a rotary evaporator at 40oC. Concentrated samples were transferred into a 500 mL separation funnel and 100 mL of dichloromethane, 100 mL of distilled water, and 30 mL of saturated NaCl solution were added. This mixture was then vigorously shaken for 5 min. and the eluent (dichloromethane layer) was passed through anhydrous sodium sulfate for dehydration and collected into a round bottom flask. Dichloromethane (100 mL) was added into the separation funnel in which an aqueous layer remained and then this partitioning procedure was repeated. The dichloromethane layer collected in the round bottom flask was evaporated to near dryness by rotary evaporation at 40oC. Finally, 2 mL of hexane was added to make a test solution.
Purification Procedure
For conditioning silica and carbon SPE cartridges connected in series, 10 mL of hexane was introduced and discarded.
The extracted solution in 2 mL of hexane was introduced into the silica-carbon cartridge and the eluate was discarded.
In addition, 10 mL of hexane/acetone (90/10, v/v) and 5 mL of hexane/acetone (70/30, v/v) were introduced and dis- carded. The analytes were then eluted with 15 mL of hexane/
acetone (40/60, v/v). The eluate was evaporated to dryness by rotary evaporation and the concentrated residue was re- constituted in 2 mL of 50% methanol. This solution was filtered through a 0.45µm membrane filter before injection into a chromatograph.
Chromatographic Separation Parameters
High-performance liquid chromatography (HPLC, Table 1) was performed to separate the constituents of the samples.
Recording of chromatograms and quantitative measurements of the peak areas were recorded using Waters HPLC Empower software (Waters, MA, USA). The absorption spectrum of the detected peak was confirmed by comparison with a saflufenacil standard.
For confirming the presence of saflufenacil in the agri- culture products, a Quattro Premier XE LC-mass spectrometer (LC-MS, Waters, MA, USA) equipped with a HPLC Capcell pak C18 UG120 column (3µm, 2.0 mm I.D. × 150 mm, Shiseido, Tokyo, Japan) was used. The LC-MS (Table 1) was operated by in the electrospray ionization (ESI) selected ion monitoring (SIM) positive-ion mode. The selected mass was 523 m/z for the analysis of saflufenacil. The MS was optimized by the infusion of standard solutions of each in-
dividual compound, at a concentration of 1µg mL−1, in acetonitrile at a flow rate of 20µL min−1.
Method Validation
Validation of the method ensures credibility, and in this study various parameters, such as the linearity, specificity, accuracy, precision, and the limit of detection (LOD) and limit of quantification (LOQ), were considered.
Linearity was determined using different known concen- trations (0.1, 0.2, 0.6, 1.0, and 5.0µg mL−1) prepared by diluting the stock solution with 50% methanol. The specificity of the method was evaluated by injecting a procedure blank, control samples, and control samples spiked at the lowest fortification level assayed (LOQ), i.e., 0.02 mg kg−1.
The accuracy of the method was determined by means of a recovery test, using samples spiked at three concentration levels, 0.02, 0.03, and 0.3 mg kg−1 for hulled rice and mandarin, and 0.02, 0.05, and 0.5 mg kg−1 for soybean, potato, and pepper. Recovery experiments had three replicates at every concentration level. The precision of the method was evaluated within the same day at each recovery level and was calculated in terms of relative standard deviation (RSD) for three replicates.
The LOD (µg mL−1) was determined as the lowest con- centration giving a response of 3 times the baseline noise defined from the analysis of control (untreated) sample. The LOQ (µg mL−1) was determined as the lowest concentration validated that gave acceptable recoveries (70%-120%) and precision (< 10%) or a response of 10 times the baseline noise.
Interlaboratory Validation
For interlaboratory validation to determine saflufenacil residues using the method developed in this study followed by concurrent analysis with similar equipment (HPLC and LC-MS), the 5 representative agricultural products were tested in 3 laboratories (Headquarter, Busan regional FDA, and Gyeognin regional FDA). The reported results are used to test the performance characteristics of the developed method. These characteristics are within-laboratory and bet- ween-laboratory precision, systematic error, recovery, sen- sitivity, limit of determination, and applicability.
Result and Discussions
Extraction Optimization
Acetone9,10), acetonitrile11,12), methanol13,14), or ethyl acet- ate15,16) are commonly used as extraction solvents to optimize pesticide residue analysis. In this study, acetone was used as the extraction solvent because of its ability to dissolve many organic compounds. In addition, acetone is very volatile, making it easy to isolate any dissolved substance simply by evaporation of the solvent. The extraction process can be used either to obtain the desired substance from the raw material or to remove unwanted impurities, depending on the solubility of this compound.
Purification Optimization
Florisil-, aminopropyl-, or silica-SPE cartridges, which are widely used in pesticide residue analysis, were compared to regard the efficiency of purification. Saflufenacil was strongly absorbed and was not well recovered in florisil- or amino- propyl-SPE cartridges, whereas it was effectively separated from the silica-SPE cartridge. Therefore, silica-SPE cartridge was selected as the purification cartridge.
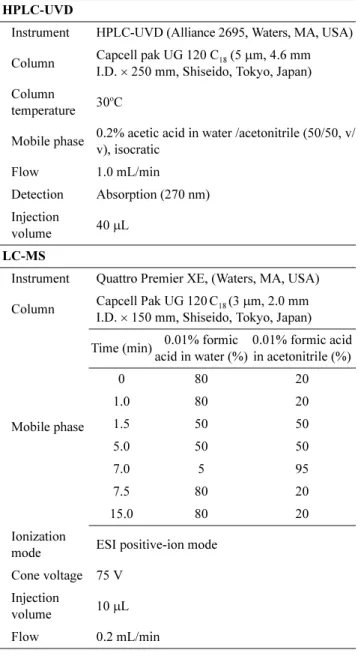
Table 1. Analytical and confirmative conditions for the determi- nation of saflufenacil residues
HPLC-UVD
Instrument HPLC-UVD (Alliance 2695, Waters, MA, USA) Column Capcell pak UG 120 C18 (5µm, 4.6 mm
I.D.× 250 mm, Shiseido, Tokyo, Japan) Column
temperature 30oC
Mobile phase 0.2% acetic acid in water /acetonitrile (50/50, v/
v), isocratic
Flow 1.0 mL/min
Detection Absorption (270 nm) Injection
volume 40µL
LC-MS
Instrument Quattro Premier XE, (Waters, MA, USA) Column Capcell Pak UG 120C18 (3µm, 2.0 mm
I.D.× 150 mm, Shiseido, Tokyo, Japan)
Mobile phase
Time (min) 0.01% formic acid in water (%)
0.01% formic acid in acetonitrile (%)
0 80 20
1.0 80 20
1.5 50 50
5.0 50 50
7.0 5 95
7.5 80 20
15.0 80 20
Ionization
mode ESI positive-ion mode Cone voltage 75 V
Injection
volume 10µL
Flow 0.2 mL/min
For selecting the composition of the purification solvent, various concentrations of hexane/acetone and dichloro- methane/acetonitrile/hexane were tested. The composition of hexane/acetone is the more effective solution to isolate moderately polar saflufenacil (Log POW= 2.6) from other co- extracts than dichloromethane/acetonitrile/hexane mixture because acetone has a higher solvent strength (5.1) than dichloromethane (3.1). However, interferences from pigments or fat substances were observed after purification by a silica- SPE cartridge. Carbon-SPE cartridges can efficiently remove pigment or fat irrespective of the solvent polarity, so silica- or carbon-SPE cartridges connected in series were introduced in the purification process.
HPLC Optimization
HPLC allows the determination of low-volatile and ther- molabile compounds. HPLC analysis was selected to determine saflufenacil residues because saflufenacil has a large molecular weight (500.9) and very low volatility with a vapor pressure of 4.5× 10⁻¹². The HPLC-photo diode array technique was used to scan over a range of 210-400 nm in order to determine the optimum absorption wavelength for saflufenacil analysis. Saflufenacil can be measured at longer wavelengths due to molecular structures (C=O, C=C, and S=O) that act as strong electron withdrawing groups to the adjacent nitrogen. Measurements at longer wavelengths have the advantage of being less affected by the interference of impurities. The maximum absorbance of saflufenacil was measured at 270 nm.
LC-MS Optimization
Fig. 1 shows MS spectrum obtained using a mass spec- trometry detector (MS) with an electrospray interface, in full scan mode for saflufenacil. The full scan spectrum (optimized at a cone voltage of 75 V) showed an abundant ion at m/z 523 corresponding to [M+Na]+ (Fig. 1).
Linearity
Saflufenacil solutions with various known concentrations (0.1, 0.2, 0.6, 1.0, and 5.0µg mL−1) were prepared in 50%
methanol by diluting the stock solution. Standard solutions were injected into the LC column and the peak area was measured for calculating saflufenacil residue. A calibration curve has been plotted for the concentration of the standards injected versus the observed peak area and the linearity of the method was evaluated by analyzing five working solutions.
The peak area obtained from different concentrations of saflufenacil was used to calculate the residue concentrations (r = 0.999).
Specificity
The specificity (matrix effect) of the analytical method was judged from the absence of interfering peaks at the retention times of the analytes. The retention time of saflufenacil was constant at 11.4 ± 0.1 min, and there were no interfering peaks at the retention time of saflufenacil (Fig. 2. A-2 and B-2).
Accuracy and Precision
Recovery studies were carried out at 0.02, 0.03 and 0.3 mg
Fig. 1. Full scan mass spectrum of saflufenacil at 75 V.
kg−1 fortification levels for saflufenacil in control hulled rice and mandarin samples and at 0.02, 0.05 and 0.5 mg kg−1 fortification levels in control soybean, potato, and pepper samples (Fig. 2). The recovery data and relative standard deviation (RSD) obtained by this method are summarized in Table 2. These numbers were calculated from six replicate analyses of given samples made by a single analyst on one day. The repeatability of method was satisfactory (RSD <
10%).
Detection and Quantification Limits
The limit of quantification was determined to be 0.02µg mL−1, defined as the lowest fortification level evaluated at which acceptable average recoveries (80.5~110.2%, RSDs
< 10%) were achieved. This quantification limit also reflects the fortification level at which an analyte peak is consistency generated at approximately 10 times the baseline noise level of the chromatogram. The limit of detection was determined to be 0.005µg mL−1 at a level of approximately three times Fig. 2. HPLC-UVD chromatograms corresponding to: A-1, saflufenacil standard at 1.0 µg/mL; A-2, control soybean; A-3, spiked at 0.02 mg/kg; A-4, spiked at 0.05 mg/kg; A-5, spiked at 0.5 mg/kg; B-1, saflufenacil standard at 1.0µg/mL; B-2, control mandarin; B-3, spiked at 0.02 mg/kg; B-4, spiked at 0.03 mg/kg; and B-5, spiked at 0.3 mg/kg.
the background of control injection around the retention time of the peak of interest.
Interlaboratory validation
Interlaboratory validation was performed among 3 labora- tories with the developed analytical method for the deter- mination of saflufenacil. Average recoveries in each lab were 80.5%-110.2% (Headquarter), 73.8%-98.2% (Busan
regional FDA), and 80.9%-112.2% (Gyeongin regional FDA) with less than 10% RSD (Table 3). In this inter- laboratory validation, the RSDs among the three labs were less than 20% (Table 3), which is lower than the value of 32% set in the Codex guideline17). These validation results showed that this analytical method is suitable for deter- mining saflufenacil residues in agricultural products.
Acknowledgement
This study was supported by a grant (12161MFDS016) from the Ministry of Food and Drug Safety in 2012.
요 약
농산물 중에 있는 제초제 saflufenacil의 잔류량을 검사 하기 위해 HPLC-UVD와 LC-MS를 이용한 정확하고 감도 가 좋은 분석방법을 개발하였다. Saflufenacil 잔류물은 acetone 추출, dichloromethane을 이용한 액-액 분배, silica 와 carbon 카트리지 정제를 거쳐 기기분석을 수행하였다.
검량선 작성을 위해 0.1~5.0 µg mL−1범위로 표준품을 만들 어 실험한 결과 상관계수(r2)는 0.999로 높은 직선성을 보 였다. 0.02~0.5 mg kg−1 처리수준으로 회수율을 실험한 결 과는 80.5~110.2% 이었으며, 상대표준편차는 10% 미만이 었다. 분석방법의 검출한계와 정량한계는 각각 0.005와 0.02 mg L−1 이었다. 확립된 시험법으로 본청, 부산지방식품의 약품안전청과 경인지방식품의약품안전청에서 실험실간 검 증을 실시한 결과 만족스런 결과를 얻었다. 이러한 결과 들을 통해 확립된 시험법은 농산물 중 saflufenacil의 잔류 량 분석에 적합함을 확인할 수 있었다.
Table 2. Validation results of the analytical method for the deter- mination of saflufenacil residues
Sample Fortification (mg/kg)
Recoverya± RSDb (%)
LOQc (mg/kg)
Hulled rice
0.02 80.5 ± 5 .2
0.02 0.03 107.4 ± 5.6
0.3 94.0 ± 1.8
Mandarin
0.02 97.7 ± 7.3
0.03 97.2 ± 1.8
0.3 85.1 ± 1.1
Pepper
0.02 90.0 ± 1.8
0.05 81.5 ± 0.3
0.5 84.4 ± 1.9
Potato
0.02 85.3 ± 1.8
0.05 83.6 ± 1.1
0.5 87.6 ± 1.6
Soybean
0.02 110.2 ± 6.6 0.05 110.0 ± 4.5 0.5 105.8 ± 0.6
aMean values of triplicates with standard deviation.
bRSD, relative standard deviation
cLOQ, limit of quantitation
Table 3. Interlaboratory validation results of the analytical method for the determination of saflufenacil residues in various agricultural samples
Sample Fortification (mg/kg)
Recovery ± RSDra(%)
Ave. Recovery (%) RSDRb Headquarter Busan FDA Gyeongin FDA
Hulled rice 0.02 80.5 ± 5.2 88.0 ± 8.6 112.2 ± 5.1 93.6 16.5
0.03 107.4 ± 5.6 87.6 ± 3.1 107.7 ± 9.9 100.9 11.5
Mandarin 0.02 97.7 ± 7.3 92.1 ± 8.6 84.7 ± 4.9 91.5 9.1
0.03 97.2 ± 1.8 78.6 ± 8.2 109.4 ± 4.9 95.1 15.0
Pepper 0.02 90.0 ± 1.8 93.7 ± 3.8 108.0 ± 0.7 97.2 8.7
0.05 81.5 ± 0.3 98.0 ± 5.4 80.9 ± 8.8 86.8 11.4
Potato 0.02 85.3 ± 1.8 98.2 ± 3.0 99.3 ± 8.6 94.3 8.7
0.05 83.6 ± 1.1 91.2 ± 2.8 101.8 ± 2.6 92.2 8.9
Soybean 0.02 110.2 ± 6.6 91.9 ± 5.9 103.6 ± 4.4 101.9 9.3
0.05 110.0 ± 4.5 73.8 ± 1.6 91.4 ± 6.2 91.7 17.6
aRSDr: intralaboratory validation
bRSDR: interlaboratory validation
References
1. US Environmental Protection Agency (US EPA): Pesticide Fact Sheet. Saflufenacil. 92 (2009).
2. European Food Safety Authority (EFSA): Setting of new MRLs for saflufenacil in a wide range of food commodities.
EFSA Journal 10, 2596-2657 (2012).
3. Database of Pesticide Residue Tolerance, Compilation pre- pared by Environmental Protection Agency (EPA), htttp://
www.epa.gov/opp00001/chem_search/reg_actions/registra- tion/fs_PC-118203_01-Aug-09.pdf.
4. Brown, B.A., Keeling, J.W., and Dotray, P.A.: Weed manage- ment and sorghum response with saflufenacil. 2010 Proceed- ings, Southern Weed Sci. Soc. 63, 38 (2010).
5. Manning, J.K., Stephenson, D.O., IV, Bond, J.A., McDuffie, J.B., Landry, R.L., and Guice, J.B.: Saflufenacil burndown origrams in no-till cotton system. Proceedings, Southern Weed Sci. Soc. 63, 28 (2010).
6. Electronic code of federal regulations, Compilation prepared by US Government Printing Office (GPO), http://www.ecfr.gov.
7. Food and Agriculture Organization of the United Nations (FAO): Saflufenacil. Report -Pesticide residues in food 2011.
FAO Plant Production and Protection Paper 211, 68. Avail- able at http://www. Fao.lor//fileadmin/templates/agphome/
documents/Pests_Pesticides/JMPR/Report11/JMPR_2011_
Report.pdf.
8. Database of Maximum Residues Limits List of Agricultural Chemicals in Foods, Compilation prepared by The Japan Food Chemical Research Foundation, http://www.m5.ws001.squar- estart.ne.jp/foundation/agrdtl. php?a_inq=24250.
9. Luke, M.A., Froberg, J.E., and Masumoto, H.T.: Extraction and cleanup of organochlorine, organophosphate, organoni- trogen, and hydrocarbon pesticides in produce for determina- tion by gas-liquid chromatography. J. Assoc. Off. Anal.
Chem. 56, 1020-1026 (1975).
10. Wong, J.W., Zhang, K., Tech, K., Hayward, D.G., Krynitsky, A.J., Cassias, I., Schenck, F.J., Banerjee, K., Dasgupta, S., &
Brown, D.: Multiresidue pesticide analysis of ginseng pow-
ders using acetonitrile- or acetone-based extraction, solid- phase extraction cleanup, and gas chromatography-mass spec- trometry/selective ion monitoring (GC-MS/SIM) or -tandem mass spectrometry (GC-MS/MS). J Agric Food Chem. 58, 5884-96 (2010).
11. Mills, P.A., Onley, J.H., and Guither, R.A.: Rapid method for chlorinated pesticide residues in nonfatty foods. J Assoc Off Anal Chem. 46, 186-191 (1963).
12. AOAC: AOAC Official 2007.01 Method: Pesticide Residues in Foods by Acetonitrile Extraction and Partitioning with Magnesium Sulfate. J AOAC Int. 485-493 (2007).
13. Cotterill, E.G.: The efficiency of methanol for the extraction of some herbicide residues from soil. Pestic Sci. 11, 23-28 (1980).
14. Tsipi, D., Triantafylloub, M., and Hiskia, A.: Determination of organochlorine pesticide residues in honey, applying solid phase extraction with RP-C18 material. Analyst 124, 473- 475 (1999).
15. Aysal, P., Ambrus, A., Lehotay, S.J., and Cannavan, A.: Val- idation of an efficient method for the determination of pesti- cide residues in fruits and vegetables using ethyl acetate for extraction. J Environ Sci Health B 42, 81-90 (2007).
16. Pihlström, T., Blomkvist, G., Friman, P., Pagard, U., and Österdahl, B-G.: Analysis of pesticide residues in fruit and vegetables with ethyl acetate extraction using gas and liquid chromatography with tandem mass spectrometric detection.
Anal and Bioanal Chem. 386, 1773-1789 (2007).
17. Codex Alimentarius Commission: Guidelines on good labo- ratory practice in residue analysis, CAC/GL 40-1993, Rev.1- 2003, Rome, Italy (2003).
18. Korea Food and Drug Administration: Korean Food Stan- dards Codex: Multi class pesticide multiresidue methods. 10- 4-10~10-4-17 (2011).
19. US Environmental Protection Agency (US EPA): Saflufenacil;
Pesticide Tolerances. Federal Register. Available at https://
www.federalregister.gov/articles/2014/02/21/2014-03734/
saflufenacil-pesticide-tolerances#h-20 (2014).