251
and Safety
Available online at http://www.foodhygiene.or.kr
Quality Determination of Different Wholesale Cuts of Goat Carcass at Different Ages
R. Islam1, S.M.E. Rahman1,2, M. Khan1, S. Akhter1, M. M. Hossain1, Tian Ding2, Jai-Moung Kim2, and Deog-Hwan Oh2*
1Department of Animal Science, Bangladesh Agricultural University, Mymensingh-2202
2School of Biotechnology and Bioengineering, Kangwon National University, Chuncheon, Kangwondo 200-701, Korea
(Received February 20, 2010/Revised August 5, 2010/Accepted September 7, 2010)
ABSTRACT - The experiment was conducted to find out the nutritive value and microbial status of different wholesale cuts of goat carcass. The meat sample (4 cuts from each animal× 3 different age groups × 3 animals in each group = 36 samples) was obtained from 1-, 2-, and 3-year aged goats. The whole sale cuts were shoulder, rack, loin and leg of each goat carcass. To assess the quality of meat sample, the general appearance, color, smell, juiciness, proximate composition, pH, total bacteria, coliform bacteria, and yeast were studied. The mean pH value of different cuts ranges from 5.65-5.69 didn’t differ significantly, but due to age differences the pH values (5.59-5.74) differed significantly (p < 0.01). The values of juiciness in different ages ranged from 32.24-42.10% which differed signifi- cantly (p < 0.01). The marbling of the cuts of rack portion was more pronounced than that of other cuts. The ranges of crude protein (CP) content of goat carcass (20.78-27.71%) differed significantly (p < 0.01) and leg portion contained higher CP than other portion. Fat contents of different cuts ranged from 2.66-11.47% differed significantly (P < 0.01).
The moisture content of the carcass differed significantly which ranged from 69.20-73.31%. The ash content of the cuts of 1-year aged groups (0.99 ± 0.13%) was higher than that of other age groups and differed significantly (P < 0.01). The calcium (Ca) content did not differ significantly. The phosphorus (P) content was higher in one year old goat (0.15 ± 0.03%) than that of the goats of other ages. The total viable count (TVC) content of microorganisms ranging from 5.05-5.15 log cfu/g at different ages did not differ significantly. The coliform count (CC) of different cuts differed significantly (P < 0.01) which ranged from 2.56-3.05 log cfu/g; it also differed significantly (P < 0.05) in dif- ferent ages (2.79-2.84 log cfu/g) and was higher in 1 year old goat carcass. The yeast count differed significantly in different cuts (P < 0.01) and ages (P < 0.05). From the study it is concluded that the age and different wholesale cuts have direct influence on quality of goat carcass.
Key words: Goat meat, Carcass quality, Wholesale cuts, Nutritive value, Microbial status
Chevon (goat meat) is one of the most widely eaten red meats in the world and enjoys great popularity in many developing countries, especially in Asia, Africa, and the Far East1). Goat meat is one of the most important protein sources for human consumption in Bangladesh. In almost all the communities of the country goat meat has long occupied a special place in the diet, for a variety of reasons including taste preference, prestige, religion, tradition and availability with the nutritional aspects being included more recently. Goat meat is a high-quality protein source. It is leaner than other red meats and its fat is less saturated, according to the USDA data2,3,4).
There is a high demand of goat meat in the market due to its palatability, less fat content, tenderness and good flavor.
All parts of the carcass are used for preparing a variety of rich dishes in many occasions. Goat meat consumption in the urban area has been increased to 23% between 1991/92 to 1995/965). Goat significantly contributes to the national GDP through the production of 1, 16000 MT of meat representing 25% of total red meat6). Goat meat is leaner than other red meats, as goats tend to deposit most of their body fat around omentum, mesentery and kidneys7). In general, goat carcass has more muscle and thicker muscle fiber bundles than sheep of similar age and weight group. The situation of meat supply in terms of handling, slaughtering and dressing of food animals in Bangladesh takes place in a very much disorganized way. Animals are slaughtered randomly and indiscriminately; the hygienic practice of ante mortem examination is not conducted8). Besides this, there is no any
*Correspondence to: Deog-Hwan Oh, Division of Food Science and Biotechnology, Kangwon National University, 192-1, Hyoja- 2-dong, Chuncheon, Kangwondo 200-701, Korea
Tel: 82-033-250-6457, Fax: 82-033-250-6457 E-mail: [email protected]
system of grading in meat selling centers and slaughter houses on the basis of meat cuts and age differences in case of goat meat in Bangladesh. So, considering this point in mind this experiment was conducted to aware the consumers about the qualitative characters of different whole sale cuts of goat carcass and their differences in nutritive values among the cuts and also due to age differences. The present study was, therefore, set to get baseline information about the quality of goat meat. The objectives of this study were to determine the physical, chemical and microbial status of whole sale cuts (shoulder, rack, loin and leg) of goat carcass, to compare the nutritional value among the four cuts, to find out the qualitative differences of goat carcass due to age differences.
Materials and Methods
Sample collection and preparation
Thirty six samples of goat meat of different wholesale cuts of different ages were studied in this experiment. Twelve kg of goat meat from freshly slaughtered goat were purchased from local market. Goat was slaughtered at 6 am in the municipal slaughter house of Mymensingh town. Fresh meat was collected and brought into the laboratory for processing.
Fat, bone and fascia were removed from the cuts and fresh muscle was collected for the use of experiment. Then samples of meat (4 cuts from each animal× 3 different age groups × 3 animals in each group = 36 sample) were weighed in a balance and each of samples weighing 200 g meat.
pH Measurement
The samples (5 g each) were homogenized with 10 ml distilled water in a blender and the pH was measured using pH meter (Corning Model 250).
Determination of juiciness
The size of the block sample was usual size (2.5× 2.5 cm) of meat which are generally consumed. About 100 g meat was prepared as block sample. The block meat sample (100 g) was cooked by heating only for 25 min in a saucepan. The cooked meat sample was put into three different plates, and weighed.
Then the final weight was deducted from the initial weight.
Proximate Analysis
All proximate analyses were performed according to the AOAC procedures9). Moisture was determined by the oven drying method as outlined in procedure 24.0039). Protein was determined by the Kjeltech micro-Kjeldahl method, which was based on the Kjeldahl method as outlined in the AOAC procedure 2.0579). Fat was determined by soxhlet extraction using petroleum ether as outlined in procedure 7.0629). Ash was determined using procedure 31.0129). All determinations
were done in triplicate then the mean value was reported.
Determination of Ca and P
For determination of Ca and P, 0.5 g of fresh meat samples were taken into a 100 ml digestion flask and then 10 ml of di-acid mixture (NHO3: HClO4= 3:1): was added to the flask and then heated at 280oC for one hour. After cooling, distilled water was added to the digested sample and shake thoroughly.
Then, the sample was filled up to 50 ml with distilled water and filtered through whatman (No. 1) filter paper.
For the calculation of calcium, 1 ml sample and 1 ml lanthanum chloride were mixed thoroughly, and the absorbance was measured by flame photometer. The calcium content of the sample was calculated from the standard curve. For the calculation of phosphorus, 5 ml of sample was mixed with 5 ml of ammonium molybdate and diluted with 2 ml of the stannous chloride (Sn2cl2). The absorbance was measured by spectrophotometer 660 nm. The phosphorus values were calculated from the standard curve. The colorimetric method was employed to determine the P content of meat. Stannous chloride was used as a reducing agent and P content was measured at the wave length of 660 nm as outlined by Olsen and Sommers10).
Microbial Assessment
To observe the microbial status, Total Viable Count (TVC), Coliform Count (CC), Yeast count and Mould count were undertaken. The ground boneless lean goat meat samples were analyzed after keeping 2 months in 20oC. To determine these parameters, dilution blanks were prepared in the similar procedure which is described below:
Preparation of dilution blanks
One thousand ml of distilled water was taken into a sterilized flask. The phosphate buffer solution was prepared as per recommendation of the “Standard Methods for the Examination of Food Products”11). Then the buffer solution was added to the distilled water at the rate of 1.25 ml/
1000 ml and the pH was adjusted to 7.2 ± 0.1. The dilution was then dispensed into several dilution bottles at the rate of 100 ml each and sterilized. Dilution blanks and the sample were shaken vigorously 25 times by up and down, 7 seconds for thorough mixing. Then by using a sterile pipette 1 ml portion was transferred to another 90 ml sterilized dilution blank. One and one-tenth ml portion of diluted sample from each dilution were placed into sterile petridishes aseptically in order to get the dilutions of 1:10, 1:102, 1:103, 1:104, 1:105. Each of the dilutions was shaken as described earlier just before transferring from a dilution bottle into petridishes or another dilution bottle. The pipette was allowed for 2 to 3 seconds to drain off, then gently blown out the last drop
and touched the tip of the pipette to a dry spot on the glass.
As soon as the dilutions were poured into petridishes, the mouth of the agar bottle was sterilized by flame and poured 10-15 ml of melted agar 40-45oC into each plate, slightly raising the lid of the petridishes. Agar was then mixed with the dilution by rotating and tilting the dish gently. The agar was then allowed to solidify.
Total viable count (TVC)
TVC was estimated by standard plate count technique. The plates were incubated at 37oC for 24 h and expressed as log cfu/g of sample. All plates for TVC and differential counts were prepared in duplicate.
After solidification of agar, the plates were inverted and placed in an incubator operated at 38oC for 48 hours. After incubation, the plates were taken out from the incubator and the plates which contained 30-300 colonies were selected for counting. Colonies were counted with the aid of a colony counter. The number of colonies was multiplied by the dilution and the total viable count per gram of sample was recorded.
Determination of Coliform Count
Coliforms were counted by using violet red bile agar (VRBA) plates. The plates were incubated at 44oC for 24 h.
After incubation, the colonies were counted that having minimum diameter was about 0.5 mm. Finally, the total colony numbers of coliform were multiplied by the dilution and the counts per gram of sample were recorded.
Determination of Yeast and Mould Count
In this study Potato Dextrose Agar (PDA) was used to
enumerate the yeast and mould count meat samples. After solidification of agar, the plates were inverted and incubated at 25oC for 3 days after incubation, the plates were taken out from the incubator and colonies were counted. Finally, the colony number of yeast and mould were multiplied by the dilution and the counts per gram of sample were recorded.
Statistical analysis
It was a 4× 3 Factorial experiment and data were analyzed as per completely randomized design (CRD). In case of significant difference, least significant difference (LSD) was used to rank the treatment and/or interaction.
Results and Discussion
Physico-chemical properties
The physico-chemical attributes such as pH, juiciness, marbling, and nutritive value were observed and the results obtained are discussed below.
pH
The mean pH value of shoulder, Rack, Loin and Leg were 5.69, 5.66, 5.66 and 5.65 respectively (Table 1). There was no significant difference among the pH value of different cuts.
The mean pH value of 1 year, 2 years and 3 years of chevon carcass were 5.59, 5.67 and 5.74 respectively (Table 2), there were significant (p < 0.01) difference on different ages. This result was similar to pH value of incised muscles was 5.65 in 6 hrs of slaughtering at ambient temperature. Gradual decline in pH was observed up to 48 hr of slaughtering12).
Table 1. Effect of cuts on different parameters
Parameters Cuts
LSD5 Value Significance
Shoulder Rack Loin Leg
pH 5.69 5.66 5.66 5.65 - NS
Juiciness 36.36 36.00 36.03 36.21 - NS
Moisture 70.12b 69.60 b 70.10 b 73.12 a 1.539 **
Ash 0.84d 0.98 b 0.92 c 1.03 a 0.031 **
Crude Protein 20.78d 23.90c 24.98b 27.71a 0.936 **
Ether extract 7.18c 11.47a 10.02b 2.66d 0.786 **
Ca1 0.04 0.03 0.03 0.04 - NS
P2 0.14a 0.13a 0.14a 0.12a 0.031 **
TVC3 (log cfu/g) 5.13 5.12 5.02 5.08 - NS
CC4 (log cfu/g) 2.56d 2.71c 2.78b 3.05a 0.810 **
Yeast (log cfu/g) 1.37c 1.30d 1.43b 1.52a 0.043 **
Mould - - - - - -
Means with different superscript in a row differ significantly
1Calcium (Ca); 2Phosphorus (P); 3Total Viable Count (TVC); 4Coliform Count (CC); 5Least Significant Difference (LSD) NS = Non-significant; **Significant at 1% level (P < 0.01)
Juiciness
Juiciness of meat is directly related to the intramuscular lipids and moisture content of the meat13), but the water re- maining in the cooked product is the major contributor to the sensation of juiciness during eating14). Goat meat and products are reportedly less juicy than mutton and/or mutton products15,16,17,18), this being attributed to the lower fat content of goat meat. The effect of age on juiciness is not clear since kid meat from 10 to 25 kg carcasses were juicier than meat from 15 to 30 kg carcasses16), while the meat of older goats
to be more juicy and palatable19,20). The water holding capacity of the meat (WHC) influences juiciness of the meat. Meat with low WHC loses a lot of fluid in cooking and may taste dry and lack of succulence. The mean value of the juiciness in shoulder, rack, loin, and leg were 36.36, 36.00, 36.03 and 36.21, respectively (Table 1) which did not differ signifi- cantly. Higher intramuscular fat contents are associated with increased tenderness in flesh21). It also affects juiciness in meat, as flavor factors, stimulates salivary flow is concentrated in fatty tissue. The mean value of juiciness in 1 year, 2 years Table 2. Effect of age on different parameters
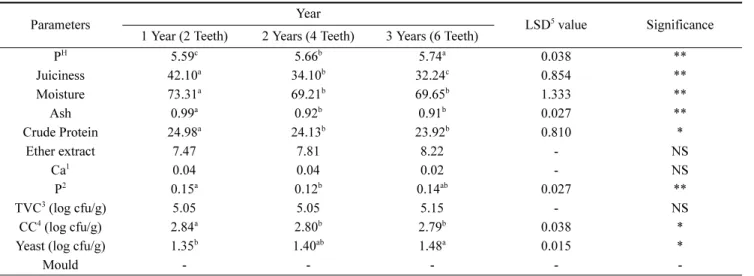
Parameters Year
LSD5 value Significance 1 Year (2 Teeth) 2 Years (4 Teeth) 3 Years (6 Teeth)
PH 5.59c 5.66b 5.74a 0.038 **
Juiciness 42.10a 34.10b 32.24c 0.854 **
Moisture 73.31a 69.21b 69.65b 1.333 **
Ash 0.99a 0.92b 0.91b 0.027 **
Crude Protein 24.98a 24.13b 23.92b 0.810 *
Ether extract 7.47 7.81 8.22 - NS
Ca1 0.04 0.04 0.02 - NS
P2 0.15a 0.12b 0.14ab 0.027 **
TVC3 (log cfu/g) 5.05 5.05 5.15 - NS
CC4 (log cfu/g) 2.84a 2.80b 2.79b 0.038 *
Yeast (log cfu/g) 1.35b 1.40ab 1.48a 0.015 *
Mould - - - - -
Means with different superscript in a row differ significantly
1Calcium (Ca); 2Phosphorus (P); 3Total Viable Count (TVC); 4Coliform Count (CC); 5Least Significant Difference (LSD) NS = Non-significant; *Significant at 5% level (P < 0.05); **Significant at 1% level (P < 0.01)
Table 3. Combine effect of cuts and age on different parameter
Cuts and Interaction
LSD4 Signifi- cance A × 1 A × 2 A × 3 B × 1 B × 2 B × 3 C × 1 C × 2 C × 3 D × 1 D × 2 D × 3
PH 5.60 5.72 5.76 5.58 5.67 5.74 5.60 5.65 5.73 5.56 5.63 5.75 - NS
Juiciness 42.17 34.50 32.30 41.90 33.90 32.19 42.52 33.70 31.88 41.72 34.30 32.60 - NS Moisture 72.43ab 70.08bcd 67.85de 72.24ab 66.33e 70.22bcd 74.50a 66.15e 69.54cd 74.08a 74.27a 71.0bc 2.666 **
Ash 0.81fg 0.90de 0.80g 0.98c 0.90de 1.05b 1.0c 0.89de 0.87ef 1.16 1.0c 0.93d 0.053 **
CP5 21.52 20.60 20.23 24.44 23.93 23.31 25.71 24.88 24.34 28.25 27.09 27.78 - NS
EE6 6.99 7.15 7.40 11.07 11.50 11.93 9.50 40.07 10.48 2.31 2.60 3.07 - NS
Ca7 0.04 0.07 0.01 0.04 0.03 0.02 0.02 0.05 0.22 0.07 0.02 0.02 - NS
P8 0.15a 1.14ab 0.14a 0.13ab 0.13ab 0.13ab 0.17a 0.13ab 0.13ab 0.15a 0.09b 0.13ab 0.053 **
TVC9 5.13 5.17 5.08 5.01 5.03 5.27 5.06 4.86 5.11 4.99 5.10 5.13 - NS
CC10 1.70g 2.81cd 2.60f 2.65ef 2.74de 2.74de 2.74de 2.78d 2.81cd 3.24a 2.88bc 2.93b 107.1 **
Yeast 1.30cd 1.60ab 1.0d 1.48bc 1.0d 1.30cd 1.0d 1.30cd 1.70a 1.48bc 1.48bc 1.60ab 11.15 **
Mould - - - - - - - - - - - - - -
Means with different superscript in a row differ significantly
NS = Non-significant; *Significant at 5% level (P < 0.05); **Significant at 1% level (P < 0.01) A = Cuts of shoulder; B = Cuts of racks; C = Cuts of loin; D = Cuts of leg
1 = Cuts of 1 Year age; 2 = Cuts of 2 year age; 3 = Cuts of 3 year age
4Least Significant Difference (LSD); 5Crude Protein (CP); 6Ether Extract (EE); 7Calcium (Ca); 8Phosphorus (P); 9Total Viable Count (TVC); 10Coliform Count (CC)
and 3 years were 42.10, 34.10 and 32.24, respectively (Table 2), which differ significantly (p < 0.01).
Marbling
Marbling of different cuts such as shoulder, rack, loin and leg were observed by eye estimation. The rack portion of goat carcass had more marbling than others, but on an average the muscles of all cuts had less marbling which is desirable. The marbling was slightly different among different ages of carcasses such as 1 year, 2 years and 3 years. Marbling is higher with the increase of age, but not significantly higher.
Proximate Composition
Shoulder, rack, loin and leg from fresh boneless lean chevon were analyzed for the determination of chemical composition.
Crude protein, ether extract, moisture, ash, calcium and phosphorus contents were obtained from the analyses. The results are discussed below.
Moisture
The moisture tends to be less as the animal becomes more fat 22). Slaughter age had a significant effect on moisture, protein, iron, calcium and pH. Fat, protein, and iron contents increased with advancing slaughter age, while moisture content decreased. The mean value of moisture contents of shoulder, rack, loin and leg were 70.12%, 69.60%, 70.06%
and 73.12%, respectively, which are shown in Table 1. The cuts of leg (73.12%) significantly (p < 0.01) differ from other cuts of the carcass. The mean values of moisture of 1 year, 2 years and 3 years were 73.31%, 69.21% and 69.65%, respectively (Table 2), where cuts of one year (73.31%) age significantly differ (p < 0.01) from the cuts of other ages. The moisture content for donkeys was lower (68.35-74.72%), while that for beef was slightly higher, which reported mean values of 75 and 77.12% respectively22, 23).
Ash
The ash values of cuts are presented in Tables 1 and 2.
The mean ash value of shoulder, rack, loin, and leg was 0.84%, 0.98%, 0.92% and 1.03%, respectively (Table 1), which were differ significantly (p < 0.01). The ash content of 1 year, 2 years and 3 years of age was 0.99%, 0.92% and 0.91%, respectively (Table 2) which were also differ signifi- cantly. The ash content of 1 year age, 0.99% was higher than that of the cuts of other ages. The total ash content for donkey cuts was the highest (5.10-8.19%) when compared to that of beef, reported 1.5% 22), while other findings were slightly lower, reporting a mean value of 1.09%23). Ash (inorganic minerals) content of muscle tissue is approximately 1%. Ash content accurately reflects the mineral content, but does not differentiate among minerals. Because of the relatively low
content of minerals in fatty tissues, the fat level also indirectly influences the mineral or ash content of meat and meat products24).
Crude Protein
The meat of goat from the second year of experiment showed a significantly higher content of protein (20.21%) and mineral compounds (1.13%), a lower fat content (2.28%) and lower thickness of meat fiber (36.45µm)25). The crude protein (CP) content of shoulder, rack, loin, and leg of 1 year, 2 years, and 3 years of carcass are shown in Table 1 and Table 2, the mean value of CP content of shoulder, rack, loin, and leg were 20.78, 23.90, 24.98 and 27.71%, respectively which were differ significantly (p < 0.01). The cuts of leg contain higher CP compared to other cuts. On the other hand, the mean CP values of 1 year, 2 years and 3 years of goat carcass were 24.98, 24.13 and 23.92%, respectively. The cuts of one year age significantly differed (p < 0.05) from the carcass of other ages (Table 2). The protein content was high (55.05-62.75% on dry matter basis) for donkey meat, than the CP in beef. In beef, protein content was of 20%26), also reported a mean value of 20.07%23), while another reported a value of 18% CP in lean beef muscle tissue22), and 19.0%
in lean meat27). The mean value of CP in donkeys was 3 times higher than the value of CP in beef as reported by various authors.
Fat
Fat deposition in the carcass or in the abdominal cavities was increased by the influence of live weight at slaughter28). Fat content of the cut are shown in Tables 1 and 2. The fat content of shoulder, rack, loin, and leg were 7.18, 11.47, 10.02, and 2.66%, respectively which were differ significantly (p < 0.01). The fat content of rack (11.47%) was the highest than that of the other cuts and the lowest in cuts of leg (2.66%). The mean fat values of 1 year, 2 years and 3 years of goat carcass were 7.47, 7.81 and 8.22%, respectively (Table 2). This is in conformity with the results29). There were no significant different in fat content among the different ages of carcass. Chevon is also attractive to health conscious consumers due to its low fat compared to other traditional red meats such as lamb, beef, and pork30).
Calcium
Calcium content is lower in lean flesh of chevon (0.01- 0.02%) 24). The mean calcium contents of shoulders, rack, loin, and leg were 0.04, 0.03, 0.03 and 0.04%, respectively (Table 1). The cuts did not have any significant difference.
The mean value of different ages are shown in Table 2, they also did not have any significant difference.
Phosphorus
Meat is a good source of phosphorus compared to calcium24). The mean phosphorus contents of shoulder, rack, loin, and leg were 0.14, 0.13, 0.14 and 0.12%, respectively which did not differ significantly. The mean value of phosphorus of 1 year, 2 years, and 3 years were 0.15, 0.12 and 0.14%, respectively (Table 2) which differ significantly (p < 0.01). The phosphorus content of the cuts of 1 year age (0.15%) was higher than the cuts of other ages.
Microbial Status
Total Viable Count (TVC) of microbes
The average total viable count (TVC) per gram of meat was recorded as 1.32× 10⁷cfu/g 31). The mean values of the Total Viable Count (TVC) per gram of shoulder, rack, loin, and leg were 5.13, 5.12, 5.02 and 5.08 log cfu/g, respectively (Table 1). There were significant differences among the cuts that the general viable count of fresh meat tissue at 35oC should be less than 107cfu/g32). The mean value of TVC per gram of goat meat sample of 1 year, 2 years and 3 years of carcasses were found 5.05, 5.05, 5.15 log cfu/g, respectively presented in Table 2. There were no significant differences of TVC in the carcasses of different ages.
Coliform Count
The mean values of coliform count in shoulder, rack, loin, and leg were 2.56, 2.17, 2.78 and 3.05 log cfu/g, respectively (Table 1). The result differed significantly (p < 0.01). The average count of total organism on the internal surfaces was log 7.21 and the external surface was log 5.53 per square cm, respectively8). The mean value of coliform count in different ages such as 1 year, 2 years and 3 years were 2.84, 2.80 and 2.79 log cfu/g, respectively (Table 2) which have significant difference (p < 0.05). The cuts of 1 year age contained higher coliform count than others.
Yeast and Mould count
The mean values of yeast and mould count of shoulder, rack, loin, and leg are shown in Table 1. There were a significant differences (p < 0.05) in yeast content in different cuts. No mould was found in the samples. The mean value of yeast and mould count of 1 year, 2 years and 3 years of carcasses are shown in Table 2. The mean yeast number in 1 year, 2 years and 3 years were 1.35, 1.40 and 1.48 log cfu/g, respectively, which showed significant difference (p < 0.05) but no mould was found in carcass of different ages.
Conclusion
From the present study it can be concluded that the age
of goat has the influence on nutrient content of goat carcass.
Juiciness, moisture, crude protein, and ash value was found significantly higher (p < 0.05; p < 0.01) in 1 year aged goat meat compared to 2 and 3 years aged goat meat. It may further be concluded that there was also little change in nutrient content of different wholesale cuts. Moisture, ash and crude protein content of leg cut were significantly higher (p < 0.01) than that of other cuts. The total viable count of microorganisms ranging from 5.05-5.15 log cfu/g at different ages did not differ significantly (p > 0.05). Microbial quality of meat depends upon the slaughter place, handling and storage condition. Good hygienic management leads to good microbial quality of meat. According to the findings of this study consumer can prefer 1 year aged goat meat and also meat from leg cut for better nutritional quality. However, it needs further investigation/study.
요 약
본 연구는 도매상에서 판매하고 있는 염소육의 영양학적 및 미생물학적 품질을 평가하기 위하여 수행하였다. 시료 는 1년생, 2년생, 3년생 염소육을 대상으로 수행하였으며, 각 연령별에서 3마리씩 4부분의 다른 부위(어깨, 목, 허리, 다리)를 선정하여 총 36점을 대상으로 본 실험을 수행하였 다. 염소육의 품질을 평가하기 위하여 각 시료의 외형, 색, 냄새, 육즙, 일반조성분, pH, 총균수, 대장균군과 효모수를 측정하였다. 각 부위별 염소육의 pH는 평균적으로 5.647-
5.692로 나타내어 각 부위별 염소육의 pH는 유의적 차이가
나타나지 않은 반면 연령별 염소육의 pH는 5.585-5.743로 유의적 차이(p < 0.01)를 나타냈다. 각 연령별 염소육의 육 즙함량은 32.24-42.10%로 유의적인 차이(p < 0.01)를 나타내 었으며, 마블링은 다른 부위보다 목살부위에서 더 명확하 게 확인할 수 있었다. 염소육의 단백질 함량은 20.78-27.71%
의 결과로 유의적 차이(p < 0.01)를 나타내었고, 다리부위는 다른 부위에 비하여 높은 단백질 함량을 나타내었으며 각 부위별 염소육의 지방 함량은 2.657-11.469%로 유의적인 차이(P < 0.01)를 나타냈다. 염소육의 수분함량은 69.20- 73.31%, 1년생 염소육의 회분함량은0.989 ± 0.129%로 다른 연령대의 염소육보다 높은 것으로 나타났으며 이 결과 또 한 유의적인 차이(P < 0.01)를 나타내었다. 칼슘의 함량은 유의적인 차이를 나타내지 않은 반면 1년생 염소육의 인의 함량은 0.149 ± 0.0251%로 다른 년생의 염소고기에 비하여 높은 것으로 나타냈다. 연령별 염소육의 총균수 수준은 5.05- 5.15 log cfu/g으로써 유의적 차이를 나타내지 않은 반면 각 부위별 염소육의 대장균군의 오염수준은 2.56-3.05 log cfu/g 으로 유의적인 차이(P < 0.01)를 나타냈다. 연령별 염소육 또 한 대장균군 오염수준은 2.79-2.84 log cfu/g 으로써 유의적인 차이(P < 0.05) 를 나타냈으며 1년생 염소육의 대장균 오염
수준은 다른 연령의 염소육에 비해 높은 것으로 나타났다.
효모의 오염수준 또한 각 부위별(P < 0.01), 연령별(P < 0.05) 로 유의적인 차이를 나타내었다. 결론적으로 염소육의 영양 학적, 미생물학적 품질은 염소의 연령과 판매 부위에직접적 인 영향을 받는 것으로 사료된다.
Reference
1. Devendra, C.: Goat production. An international perspective.
In: Proc. International Goat Production Symp. Oct. 22-25, 1990. Florida A&M University, Tallahassee, FL. (1990).
2. USDA. Composition of foods: lamb, veal and game prod- ucts-raw, processed, prepared. Agriculture Handbook 8-17.
Washington DC, USA: USDA Human Nutrition Information Service. (1989).
3. USDA. Composition of foods: beef products-raw, processed, prepared. Agriculture Handbook No. 8-13. Washington DC, USA: USDA Human Nutrition Information Service. (1990).
4. USDA. Composition of foods: pork products-raw, processed, prepared. Agriculture Handbook No. 8-10. Washington DC, USDA: USDA Human Nutrition Information Service. (1992).
5. DLS, Expansions and activities. Department of Livestock Ser- vices, Government of the People’s Republic of Bangladesh.
Annual Report. (1997).
6. FAO, FAO Production year Book. 1994. Food and Agricultural organization of the United Nations, Rome, Italy. Vol. 51. (1997).
7. Pal, U.K. and Agnihotri, M.K.: Goat. Promising meat animal in India. Asian livestock. XXI (9): 97-101. (1996).
8. Rahman, M. M.: Fundamentals of Meat Hygiene. Department of Microbiology and Hygiene, Bangladesh Agricultural Uni- versity, Mymensingh, Bangladesh. Bismillah Farming and Fro- zen meat Ltd. Dhaka., pp. 76-101. (2001).
9. AOAC (Association of Official Analytical Chemists) Offi- cial Methods of Analysis Association of Official Analytical Chemists. 14th Ed. Arlington, VA. (1984).
10. Olsen, S.R., Sommers, L.E.: Phosphorus. In Methods of soil analysis. American Soc. of Agronomy, Madison, Wisconsin, USA. 403-427. (1982).
11. APHA (American Public Health Association). Science 14 May 1976. Vol. 192 (1240). pp. 650-653. (1976).
12. Tirupal, R. N. and Sreenivas, R. M.: The effect of postmortem ageing temperature on certain quality characteristics of mutton.
Indian journal of Animal Science. 68(12), 1295 (1998).
13. Cross, H.R., Durland, P.R., Seidman, S.C.: Sensory qualities of meat. In: Bechtel, P.J. (Ed.), Muscle as Food. Food Science and Technology Series. Academic Press, New York, pp. 279- 320. (1986).
14. Forrest, J.C., Aberle, E.D., Hendrick, H.B., Judge, M.D., Mer- kel, R.A.: Meat as food. In: Principles of Meat Science. WH Freeman and Company, New York, pp. 3-7. (1975).
15. Pike, M.I., Smith, G.C., Carpenter, Z.L.: Palatability ratings for
meat from goats and other meat animal species. J. Anim. Sci.
37 (269) (abstract 159). (1973).
16. Sch¨onfeldt, H.C., Naude, R.T., Bok, W., Van Heerden, S.M., Swoden, L., Boshoff, E.: Cooking and juiciness related quality characteristics of goat and sheep meat. Meat Sci. 34, 381-394 (1993).
17. Tshabalala, P.A., Strydom, P.E., Webb, E.C., De Kock, H.L.:
Meat quality of designated South African indigenous goat and sheep breeds. Meat Sci. 65, 563-570 (2003).
18. Sheradin, R., Hoffman, L.C., Ferreira, A.V.: Meat quality of Boer goat kids and Mutton Merino lambs 2 sensory meat evaluation. Anim. Sci. 76, 73-79 (2003).
19. Pike, M.I., Smith, G.C., Carpenter, Z.L., Shelton, M.: Effects of maturity and fatness on the palatability of goat meat. J.
Anim. Sci. 37 (269) (abstract 158). (1973).
20. Smith, G.C., Carpenter, Z.L., Shelton, M.: Effects of age and quality level on the palatability of goat meat. J. Anim. Sci.
46, 1229-1235 (1978).
21. Kauffman, R. G; carpenter, L; Bray, R. W, Hoeksta, W. G.:
Biochemical properties of pork and their relationship to qual- ity. II. Intramuscular fat. I. Food Sci. 29, 70-74 (1964).
22. Libby, A. J.: Meat Hygiene, 4th editions. Lea and Febiger, Philadelphia, 243-247. (1975).
23. Srinivasan, S., Y. L. Xiong, Blanchard, P., Moody, W.: Proxi- mate, mineral and fatty acid composition of semimembranous and cardiac muscles from grass - and grain fed cattle. J. Agri.
Food Chem., 63, 543-547 (1998).
24. Pearson, A. M., Gillett, T. A.: Processed Meats, 3 editions. An Aspen publisher’s inc. Maryland, 24-43 (1999).
25. Pieniak, Lendzion, K., Niedzioka, R., Szeliga, W.: Comparison of slaughter value and some quality traits of ram lambs and goat kids. Annals-of-Animal-Science. 3(1), 35-40 (2003).
26. Warriss, P. D.: Meat Science. An introductory text. CABI publishers, Bristol, 20-37. (2000).
27. Gracey, J., Collins, D., Huey, R.: Meat Hygiene, 10th edition.
W.B. Saunders Company Ltd, New York. (1972).
28. Ying, J.: Some goat breeds (China). World Animal Review. 58, 31-41 (1986).
29. Zujovic, M., Josipovic, S., Petrovic, M., Gluhovic, M., Tomasevic, D.: Influence of body mass of kids prior to slaugh- tering on major meat quality traits. Biotechnology-in-Animal- Husbandry. 17(5/6), 169-174 (2001).
30. McMillin, K.W., Brock, A.P.: Production practices and process- ing for value-added goat meat. J. Anim. Sci. 83, E57-E68 (2005).
31. Amin, A., Borah P.: Bacteriological quality of goat meat mar- keted in Guwahati city. Indian Veterinary journal, 79(9), 944- 947 (2002).
32. ICMSF. Microorganism in foods, samples for Microbiological Analysis: principles and specific application. Recommenda- tion of the International Commission on Microbiological Specification for Foods. Association of Microbiological Soci- eties. Torento, University of Torento Press. (1985).p