DOI : http://dx.doi.org/10.5394/KINPR.2014.38.3.203
Development of Safety Index for Evaluation of Ship Navigation
†Soo-Jin Hwang․Eiichi Kobayashi
*․Nobujazu Wakabayashi
**†Graduate school of National Kobe University, Higashinada-ku 658-0022, Japan
*, ** Department of Maritime Sciences, National Kobe University, Higashinada-ku 658-0022, Japan
Abstract : As a sense of practical field, most researchers emphasize the importance of safety management to prevent marine accidents.
The purpose of this paper is to develope a new safety evaluation method using Safety Index (SI) which is to measure the emotional feeling of navigation officer by traffic situations. In this study, the questionnaires with SI are used to investigate the degree of sensing levels of navigation officers according to the navigation situations. In addition, the traffic data obtained from AIS (Automatic Identification System) data are used to give actual situations in the questionnaire investigation. As results of questionaries investigations based upon the AIS data, it is shown that the Safety Index can be used as a criterion to determine the safety levels of ship navigating in a coastal areas.
Key words : Safety Evaluation Method, Safety Index, Ship Navigation, Navigation Officers’ Perception, Questionnaire investigation, AIS (Automatic Identification System) data
†Corresponding author : [email protected]
1. Introduction
Shipping is perhaps the most international of the world’s industries, serving more than 90% of the global trade by cost effectively, cleanly, and safely carrying huge quantities of cargo(IMO, 2013). Moreover, the increase in the world shipping trade is currently progressing and is expected to continue to progress in the near future by the strong and steady development of Asian and African social systems and economies, despite the continuation of the recent international slump in the economy. The expansion of trade leads to an increase in marine traffic density, which has an influence on the dangers of ship navigation.
Safety is the most important issue for shipping, in relation to navigation, the occurrence of marine accidents such as a collision, grounding, fire, explosion, capsizing, or sinking can result in fatalities, the loss of a ship, and material damage to the marine infrastructure. It can seriously endanger the safety of the ship, as well as other ships, and can cause severe damage to the environment.
In order to promote safety and to minimize the consequences of marine accidents, safety standards
primarily addressed ship design and equipment requirements, these technical approaches minimized the consequences of marine accidents. However, significant marine accidents have continued to occur. Human factors were adopted as one of causes to investigate marine accidents in Resolution A.884(21)(IMO, 2000).
This study considers human factors as navigation
officers’ perceptions. Perceptions are the process of
attaining an understanding of the environment by
interpreting information from their experiences. Navigation
officers have unique experience on the sea. Thus, it is
important to understand how the navigation officers and
ship’s navigation environment interact to quantitatively
determine their perception, which is derived from the result
of a questionnaire investigation. It is shown some other
studies how to approach the navigation officers’ perceptions
quantitatively, and this study is to show the framework of
safety index. In the next part, the concept and components
of the safety index are introduced; each item of the
questionnaire investigation and AIS data analysis is
presented as a safety index method. The results of applying
the safety index methods are discussed.
2. Literature Review
As a quantitative approach to safety management by using the navigation officers’ perceptions, the SJ-value (subjective judgment) as an index to express quantitatively the degree of collision risk with another ship felt by the ship handler(Hara, 1995). For a quantitative approach, the environment stress model called ES model based on the SJ model was developed(Inoue, 2000). It is derived from a physical stress analysis of the changes in the number of heartbeats in relation to navigation officers’ perceptions in restricted waterways.
The SJ and ES models use variables: the distance between the ship and another ship, the rate of change in the relative position of another ship as viewed from the ship, and the relative speed between the ship and another ship, which are reproduced from the ship’s navigation situation. These variables are used in the collision risk assessment.
Collision risk assessment is usually based on a calculation of the relationship between ships, where the navigation officers can only control the speed and course of their own ship, and is used to determine their responses to circumstances that affect them to avoid a collision. Collision risk assessment is often based on data from ARPA (automatic radar plotting aids), which are specialized radar anti-collision systems that are used to automatically calculate the CPA(closest point of approach) and display the navigational situation on the radar screen. This allows the navigation officers to make a proper decision to avoid the collision situation. On the other hand, the SJ and ES models emphasize the importance of expressing the navigation officers’ perceptions in numbers to manage safety efficiently by reproducing the ship’s navigation situation.
3. Safety Index
3.1 Safety Index Concept
A “safety index” as an evaluation method of safety management helps express the navigation officers’
perceptions using numerical values in a specific marine traffic environment. This index includes basic indices that are related to the ship’s type, speed, loading state, length, ship location, and interaction with other ships, etc. These indices
consist of eleven items, which are separated into the following four categories:
(1) Own ship:
Type of ship, length of ship, loading state (2) Other ships:
Type of ship, length of ship, loading state (3) Relationship between own ship and other ships:
Relative speed, distance between ships, encounter-situations
(4) Environmental conditions:
Time, day
This study used a numeric expression method of the navigation officers’ perceptions, moreover, the purpose was to present the entire observation of the ship’s navigation situation using the navigation officers’ perceptions.
Therefore, this study considered items in addition to those for the collision risk assessment(Distance between ships, relative speed, and encounter situation), including the ship’s navigational environment conditions such as day, time, type of ship, loading state, and so on. Table 1 shows the eleven items of safety index in details.
Navigation officers understand each other ships’
maneuverability, and then, they consider the rules of sea traffic. In particular, the assessment process involves the COLREGs(International Regulations for Preventing Collisions at Sea) or the Public Order in open ports Act, depending on the encounter situation, be it head-on, crossing, or overtaking, which are imposed on navigation officers by the IMO. The navigation officers obey these rules and decide on the proper action, while keeping safety in mind(Table 1).
Based on the eleven items in Table 1, a perspective flow is described based on the relationships between the ships and their navigators’ perceptions. In a given navigation situation, it is important to collect ship information such as type of ship, length of ship, and loading state of both own ship and other ships, because navigation officers make decisions based on such information, which is important when considering maneuverability. Accordingly, the details of ship information help us to understand the decisions of the navigation officers based on their perception.
Relationships between relative speed and distance are also important factor when interpreting the navigational situation.
As methods, a questionnaire investigation was used to
simply estimate the navigation officers’ perceptions, and the
responses were applied to ship navigation, which was
Valid
(years) Frequency Percent Valid Percent
Cumulative Percent
~ 3 2 3.77 3.77 3.77
3 ~ 6 7 13.21 13.21 16.98
6 ~ 9 3 5.66 5.66 22.64
9 ~ 12 6 11.32 11.32 33.96
12 ~ 15 6 11.32 11.32 45.28
15 ~ 29 54.72 54.72 100
Sum 53
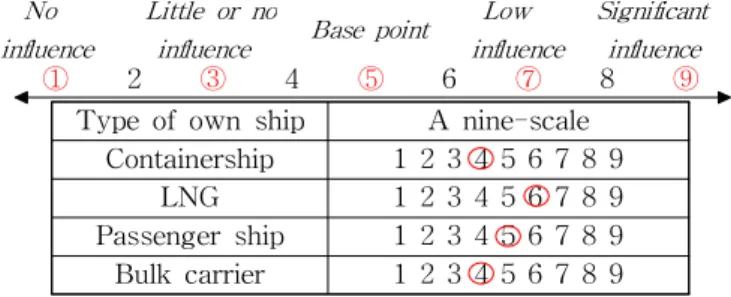
Table 2 Nine-scale evaluation scores for safety index
Items Details
Type of ship
Container ship, LNG, VLCC, Ferry, Passenger ship, Bulk carrier, Fisher, LPG, PCC, Reefer ship, Tug boat
Length of ship
Under 100 m, 101~150 m, 151~200 m, 201~250 m, 251~300 m, over 301 m Loading state Ballast, Full Relative speed 0~1.0k’t, 1.1~2.0k’t, 2.1~3.0k’t,
3.1~4.0k’t, 4.1k’t~
Distance (L=length of ship)
5L~, 6~10L, 11~15L, 16~20L, 21~30L, 31L~
Encounter situations
Head-on (give-way)
On the center line of the ship
showing from right ahead
of 30 degrees abaft the beam of either
side of ship Crossing
on starboard (give-way)
On the starboard side showing from right ahead
of 30 degrees to 112.5 degrees Crossing
on Port (stand-on)
On the port side showing from port ahead of 30 degrees
to 247.5 degrees
Overtaking (stand-on)
At the stern showing 67.5 degrees from right aft on each
side of ship
Time (LT=Local time)
1
stofficers’:
04:00~08:00, 16:00~20:00 2
ndofficers’
00:00~04:00, 12:00~16:00 3
rdofficers’
08:00~12:00, 20:00~24:00
Day Mon., Tue., Wed.,
Thus., Fri., Sat., Sun.
Type of own ship A nine-scale Containership 1 2 3 4 5 6 7 8 9
LNG 1 2 3 4 5 6 7 8 9
Passenger ship 1 2 3 4 5 6 7 8 9 Bulk carrier 1 2 3 4 5 6 7 8 9
① 2 ③ 4 ⑤ 6 ⑦ 8 ⑨
Noinfluence
Little or no
influence Base point Low influence
Significant influence
reproduced using an AIS data analysis. An AIS is a
communication system that is used to automatically exchange ship information that can detect other ships with wider coverage than the ARPA system. This study analyzed the AIS data to reproduce a ship’s navigation situation to develop an observation method for ship navigation.
Table 1 Eleven items of safety index in details
In this study, a safety index was suggested by combining the results of the questionnaire and AIS data analysis, which indicated the navigation officers’ perceptions in a ship navigation situation from a descriptive viewpoint.
This study showed the possibility of applying the safety index to manage the safety in a ship navigation situation with certain AIS data coverage.
3.2 Questionnaire Investigation
The questionnaire investigation is a useful tool to learn how navigation officers feel about items related to ship navigation situations. This study used a questionnaire that contained eleven questions related to the safety index. The officers’ responses were classified according to their estimation of the navigation’s safety level and used a nine-scale evaluation score starting from 1
stlevel(1: no influence) and ending with 9
thlevel(9: significant influence) as presented in Table 2.
A total of 95 navigation officers were given the questionnaires and only 53 officers responded to the questionnaire, a return rate of questionnaires was about 55%. With regard to responders’ experience or carrier on board the ship, the number of respondents over 15 years was 54.72 %, 12 to 15 years was 11.32 %, 9 to 12 years was 11.32 %, 6 to 9 years was 5.66 %, 3 to 6 years was 13.21%, less than 3 years was 2.77 % as presented in Table 3.
Table 3 Responders’ demographic characteristics
=
∑
(1)
= ∑
(2)
where:
: average of numerical values for item j
: number of questionnaire item (j = 1~11)
: answer value for
questionnaire item by
respondent
: number of respondents
: navigation officers’ response to elements on a scale from one to nine.
: Total sum of eleven items
of safety index The responses of navigation officers were collected, and calculated as an average for each item of equation(1). Table 2 is an is an example form of nine-scale evaluation scores for safety index showing navigation officers’ answers to questions regarding how strong impact of each item of safety index on navigation.
in equation(1) indicates a navigation officers’ answer of value for
questionnaire item by
respondent, which means that navigation officers’ answer on the nine-interval scale based on their feeling as if they were on board a ship. Based on the
answers,
indicates the representative opinion of the safety index for each type of ship. As a result, each questionnaire item can be used to express the navigation officers’ representative opinion in numerical value.
The item of day shows from 4.91 to 5.08, time is from 4.38 to 5.50, type of own ship shows from 4.21 to 5.57, type of target ship is from 4.62 to 5.29, length of own ship shows from 4.23 to 6.32, length of target ship is from 4.66 to 5.68. Ballast condition of ship indicates 4.58, Full condition is 5.45. Relative bearing shows from 4.82 to 5.20, distance between ships id from 4.23 to 6.28, relative speed is from 4.51 to 5.54. Safety Index( SI ) was represented by the sum of eleven items based on navigation officers’
representative answers of
in equation(2) in given navigation situations.
3.3 Reproducing Marine Traffic using AIS data The AIS system is an automatic reporting system by providing a means for ships to exchange their own information with all other nearby ships and shore stations.
It is developed for the safety of navigation by International Association of Maritime Aids to Navigation and Lighthouse Authorities(IALA, 2005). AIS should be
equipped on all passenger ships, cargo ships over 500 GT engaged on domestic voyages and all ships more than 300 GT engaged on international voyages as a shipboard broadcast transponder system(IMO, 1980).
AIS data can be divided into 2 types. The dynamic data are information about longitude, latitude, current time, course, and type of cargo transmitted at intervals from 2 seconds to 3 minutes, depending on the speed of ship.
The others are static data which consists of the ship’s maritime mobile service identity(MMSI), the name of ships, call-sign, maximum ship draft, IMO number, type of ship and antenna position transmitted every 6 minutes.
The AIS receivers are installed in Kobe University to grasp actual and dynamic traffic conditions.
Osaka bay is located at the eastern part of the Seto Inland Sea, which is the largest semi-enclosed inland sea of Japan. This bay is surrounded by highly developed industrial areas. Osaka bay has two entrances to neighboring sea areas. Material transport between Osaka bay and neighboring sea areas occurs through Akashi Strait and Tomogashima channel(Hoshika et al., 1999).
This study is focused on Osaka bay by using AIS data from receiver installed in Kobe University. Based on the AIS data for 7 days from 2
ndSep. to 8
thSep., 2012 in Osaka bay, the average number of ships passing is from 22 ships to 102 ships daily, from 42 ships to 90 ships hourly. From resulting of passing ships in Osaka bay, 27.58 percent is cargo ship in the highest in type of ship and LPG, Reefer are 0.35 percent in the lowest, separately.
In case of Tomogashima channel marked D of (a) in Figure 1, the average daily number of ship is 4 ships.
Among ships passing Tomogashima channel, container ship is 26 percent in the highest in type of ship, while near/in Osaka port marked A of (a), the average daily number of ship is 62 ships. Among ships near/in Osaka port, cargo ship is 58.28 percent in the highest in type of ship.
(a) Ship trajectory from AIS (b) Result of traffic density
Fig. 1 Analytical results for Osaka Bay using AIS data
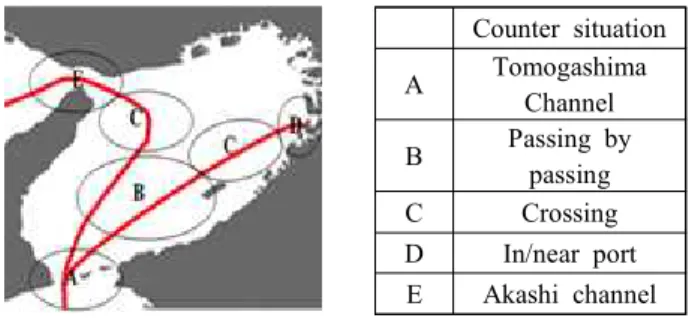
Counter situation A Tomogashima
Channel B Passing by
passing
C Crossing
D In/near port E Akashi channel According to Hydrographic and Oceanographic
Department of Japan(2012) on 2
ndSep., 2012, the average velocity of current flow from 00:00 to 04:00 is 1.84 knots and the direction of current is southward. The average velocity from 05:00 to 10:00 is 1.48 knots and the direction of northward, from 11:00 to 16:00 is 1.9 knots and the direction of southward from 17:00 to 23:00 is 1.12 knots and the direction of northward. At that time, according to AIS data recorded on 2
ndSep., 2012, the average speed of 2 ships passing Tomogashima channel from 00:00 to 04:00 is 15.52 knots, the average speed of 6 ships passing Tomogashima channel from 05:00 to 10:00 is 12.48 knots, the average speed of 4 ships passing Tomogashima channel from 11:00 to 16:00 is 15.54 knots, the average speed of 2 ships passing Tomogashima channel from 17:00 to 23:00 is 14.84 knots.
In order to observe the effectiveness of safety index, trajectories of ships, which were proceeding to Osaka Bay, were taken as examples from AIS data. The incoming and outgoing ship tracks from Tomogashima Channel and outgoing ship tracks from Tomogashima channel to Osaka port are analyzed. Each small square(5 degree) of (b) in Figure 1 represents the density of ships from 0 with white to 12 with dark red. Furthermore, the area is divided into four parts depending on the encounter situation, as shown in Figure 1. Area A is Osaka port, B is near Osaka port and crossing situation area because there are many ships departing from Osaka/Kobe port and entering to Osaka/Kobe port, Part C is passing by passing area and part D is Tomogashima channel.
4. Study-case of Safety Index in Osaka bay in Japan
In order to observe the effectiveness of safety index, the observation area is divided into 5 parts depending on the encounter situation as shown in Figure 2. Area A is Tomogashima channel, B is passing by passing area, C is crossing situation area because there are many ships departing from Osaka/Kobe port and entering to Osaka/Kobe port, D is Sakai-senboku terminal and E is Akashi channel(Figure 2).
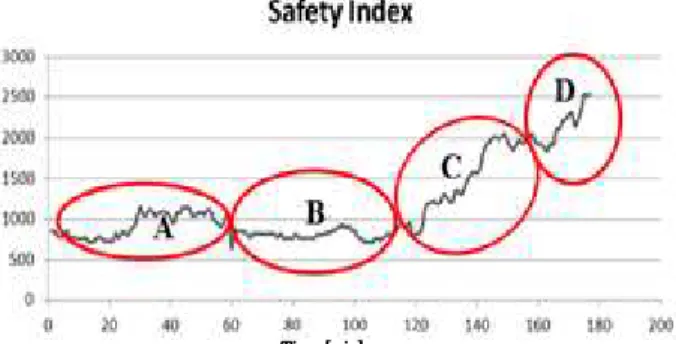
The graphs show that safety index of LNG tanker(L:
290m, G/T: 120,700) in Osaka bay as follows. In the first case, she was progressing from Tomogashima channel to Sakai-senboku port at 0900LT on 09
thMay 2010 in Figure 3.
(a) Trajectory of LNG tanker (b) Counter situations Fig. 2 Analytical results for Osaka Bay using AIS data
The other hands, it is described in Figure 4 that she was through the Tomogashima channel and Akashi channel to visit to Himeji LNG terminal on 06
thJune 2010. Area ‘A’ indicates Tomogashima channel in Figure 2 where is narrow channel with current. These affected the safety index. When she was passing through at the corner of the Tomogashima channel, the safety index reached near 1000 for a while in Figure 3 because there exist some ships around her as passing by passing situation with the average velocity of current flow from 07:00 to 11:00 on 09
thMay 2010 in Tomogashima channel marked A is 1.3 knots and the direction of southward. So, the relative distance is affected on the safety index with A.
In the other case of Figure 4, A shows that the value is higher than before case(Figure 3). At that time, there are 5 ships around her in the Tomogashima channel due to both the number of ships and where the narrow channel is. At that time, the average velocity of current flow in Tomogashima channel is 1.1 knots and the direction of southward. In Figure 4, Area B shows the influence on the safety index by the relationship of number of ships, the probability to meet other ships is decreased, the safety index is also decreased, passing by passing situation.
Fig. 3 Trend of Safety index variation for LNG ship
Time [min]
Time [min]