• 검색 결과가 없습니다.

Evaluation on the nutrient concentration changes along the flow path of a free surface flow constructed wetland in agricultural area

N/A
N/A
Protected

Academic year: 2021

Share "Evaluation on the nutrient concentration changes along the flow path of a free surface flow constructed wetland in agricultural area"

Copied!
8
0
0

로드 중.... (전체 텍스트 보기)

전체 글

(1)

Evaluation on the nutrient concentration changes along the flow path of a free surface flow constructed wetland in agricultural area

Jean Margaret R. Mercado* · Marla C. Maniquiz-Redillas** · Lee-Hyung Kim***+

Department of Civil and Environmental Engineering, Kongju National University

농업지역에 조성된 자유수면형 인공습지의 유로에 따른 영양염류의 변화 평가

Jean Margaret R. Mercado* · Marla C. Maniquiz-Redillas** · 김이형***

+

공주대학교 건설환경공학부

Abstract

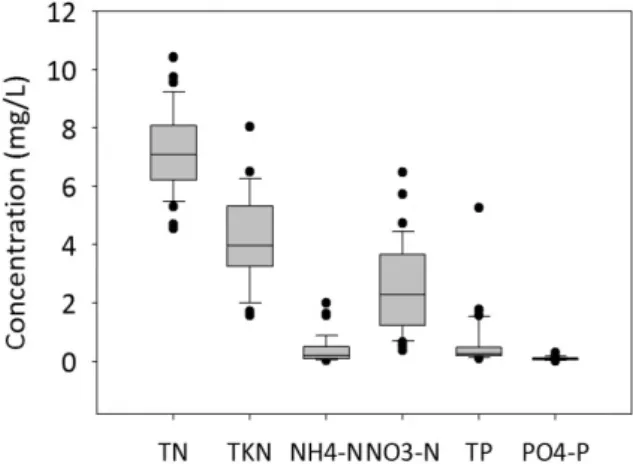
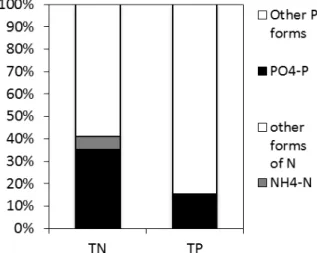
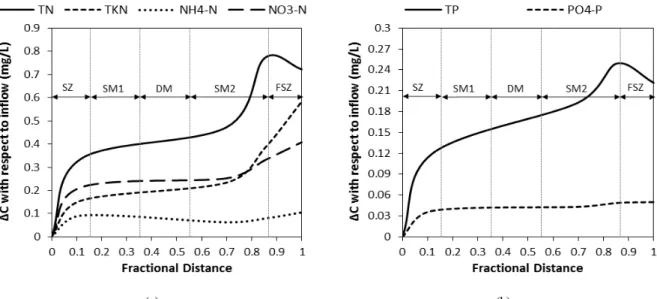
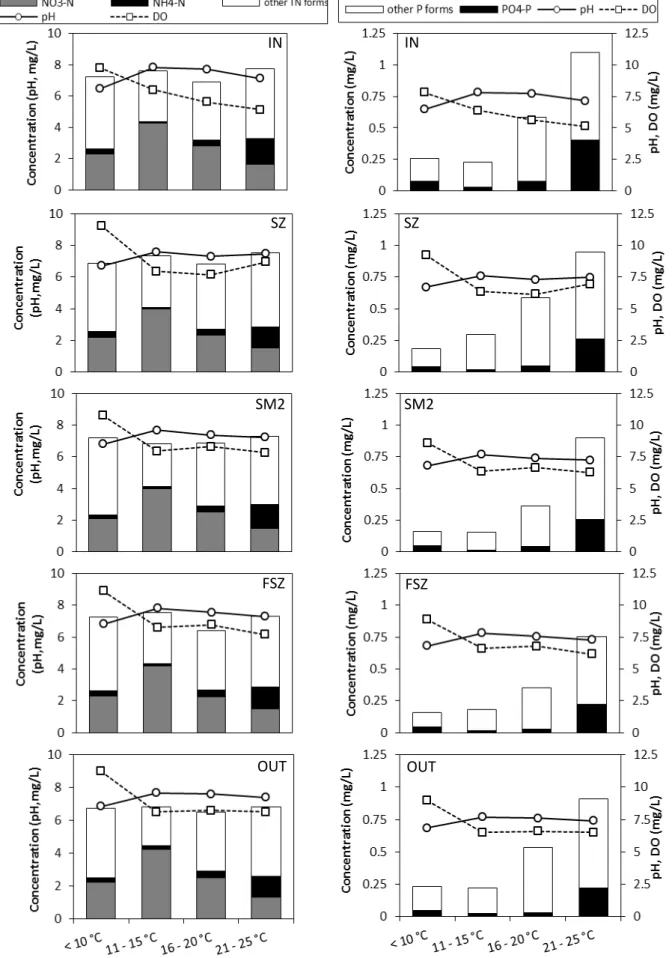
In this study, the nutrient concentration changes along the hydrologic flow path of a free water surface flow constructed wetland (CW) treating agricultural stream runoff was investigated. Dry sampling was performed from April 2009 to November 2011 at five locations representing each treatment units of the CW. Grab water samples were analyzed for nitrogen forms such as total nitrogen (TN), total Kjeldahl nitrogen, nitrate, and ammonium; and phosphorus forms including total phosphorus (TP) and phosphate. Findings revealed that the physical properties such as temperature, dissolved oxygen and pH affected the TP retention in the CW. High nutrient reduction was observed after passing the first sedimentation zone indicating the importance of settling process in the retention of nutrients. However, it was until the 85% of the length of the CW where nutrient retention was greatest indicating the deposition of nutrients at the alternating shallow and deep marshes. TN and TP concentration seemed to increase at the final sedimentation zone (FSZ) suggesting a possible nutrient source in this segment of the CW. It was therefore recommended to reduce or possibly remove the FSZ in the CW for an optimum performance, smaller spatial allocation and lesser construction expenses for similar systems.

Keywords : Constructed wetland; Wetland Design; Free water surface flow; Nutrient behavior

요 약

농업지역의 소하천에 흐르는 하천수는 유역의 농업활동으로 유출된 각종 영양염류의 함량이 높아 호소 유입시 부영양화 의 원인이 된다. 본 연구에서는 농업지역의 하천수를 처리하기 위해 조성된 자유수면형 인공습지의 수문학적 유로에 따 른 영양염류의 농도를 평가하고자 수행되었다. 습지내 유로에 따른 영양염류의 농도를 평가하기 위한 모니터링은 2009년 4월부터 2011년 11월까지 습지내 유로의 5개 지점에서 수행되었다. 채취된 시료는 유로에 따른 수질변화를 분석하기 위 하여 질소와 인에 대한 집중적 분석이 수행되었다. 습지내 TP 저류의 원인을 평가한 결과 수온, DO 및 pH가 큰 영향을 끼치는 것으로 나타났다. 또한 습지내 유입수가 침강지를 통과한 직후 영양염류의 농도가 가장 크게 저감된 것으로 나타 났는데, 이는 많은 양의 영양소가 입자와 부착된 형태로 이동하기 때문인 것으로 판단되기에 향후 습지 설계시 침강지의 기능 증대 방안 도입이 중요한 인자인 것으로 평가된다. 그러나 습지내에서 가장 큰 영양염류 저감이 발생한 지점은 유 로의 85% 지점인 것으로 나타났다. 이는 습지내 미생물 및 식생흡입에 의한 영향으로 평가되기에 이를 활성화 하기 위한 얕은 습지 및 깊은 습지의 적절한 배치도 인공습지 설계에서 중요한 인자임을 보여주고 있다. 마지막 침전지 부분에서는 영양염류의 농도가 증가하는 것으로 나타났는데, 이는 길어진 체류시간에 의한 퇴적층으로부터 용출이 원인인 것으로 평 가되기에 습지설계시 침전지의 적정한 체류시간 확보가 중요한 것으로 나타났다.

핵심용어 : 농업지역, 영양염류, 자유수면형 인공 습지, 습지설계

+ Corresponding author: [email protected]

* 정회원, 공주대학교 건설환경공학부 석사과정, E-mail: jmrmercado @kongju.ac.kr

** 정회원, 공주대학교 건설환경공학부 박사후연구원, E-mail: [email protected]

*** 정회원, 공주대학교 건설환경공학부 교수, E-mail: [email protected]

(2)

2001; Lee et al., 2011; Kim et al., 2012). In Korea, TN and TP discharge in the Geum river drastically increased from 1997 to 2005 by approximately 15.0 x10

3

to 22.0 x10

3

kg-TN/day and 1.5 x10

3

to 6.4 x10

3

kg-TP/day (WAMIS), which may have been attributed to the growth of agricultural industry in the country.

Constructed wetlands (CW) are recognized as an efficient treatment technology that are cost effective and have less operational and maintenance requirements (Vymazal, 2005). One particular type of a CW is a free water surface flow (FWS) CW which is designed to closely mimic the same processes that occur in natural wetlands but in a partially controlled environment. In comparison to a horizontal subsurface flow (HSSF) CW on areal basis, there is no difference in performance between the two CWs but FWS CW is better for TN, total Kjeldhal nitrogen (TKN) and ammonium-nitrogen (NH

4

-N) reduction while HSSF appear slightly better in fecal coliform reduction. Also, FWS CW in North America normally receives secondary quality of water or better in contrast to HSSF (Kadlec and Wallace, 2009;

Kang et al., 2011). Typical nitrogen removal mechanisms known to involve in FWS CW and affected by pH, dissolved oxygen (DO) and water temperature include ammonification, denitrification, and nitrification while sorption, precipitation and plant uptake are the major phosphorus removal processes (Vymazal, 2007). CW performance may vary with site location, wastewater characteristics, wetland design and application (Dunne et al., 2005). Also, behavior of nutrients along the flow path varies in every wetland. CWs are composed of inlet zone or sedimentation zone and alternating deep and shallow segments. Ultimately, the role of the sedimentation zone is to settle coarse sediments and regulate excessive flows entering the wetland. Shallow segments function for biodegradable oxygen demand, total suspended solids, metals and pathogen removal while deep segments promote denitrification (Tousignant et al., 1999).

The FWS CW was a project funded by the MOE located at Namsan Town in Kongju City, South Chungnam Province, Korea (36°17’18.52” N, 127°2’9.16”).

The CW can hold 2,957 m

3

of water with an average depth of 0.9 m. It has a total area, surface area and peak design flow rate of 8,861 m

2

, 3,282 m

2

and 180 m

3

/h, respectively. The CW receives intermittent stream flow coming from a 465 ha watershed area which comprises of various land uses as shown in Fig. 1a. The initial 16%

and last 30% of the hydrologic path of the CW were the first sedimentation zone (SZ) and final sedimentation zone (FSZ) which maximizes the detention of coarse- to medium-sized sediments and controls the flow entering and exiting the wetland. Alternating marshes were between the sedimentation zones which consist of a shallow marsh (SM), deep marsh (DM), and another shallow marsh (SM2) comprising the next 19%, 20%, and 30% of the length of the CW.

2.2 Sampling scheme and data analysis

Grab sampling of dry samples was done monthly from April 2009 to November 2011. Samples were collected at five distinct locations representing each zone along the hydrologic path of the CW (Fig. 1b). Samples were taken under normal conditions and were transferred at a more controlled environment after in situ measurement of physical parameters such as pH, DO and temperature.

Analysis of nitrogen and its forms such as TN, TKN, nitrate (NO

3

-N), NH

4

-N, as well as phosphorus forms like TP and phosphate (PO

4

-P) were performed in accordance to the standard test method for examination of water and wastewater (Greenberg et al., 1992).

The change in concentration with respect to the inflow from a treatment zone was computed as,

∆C = C

in

- C

x

(3)

(a) (b)

Fig. 1. Illustration showing the (a) landuse of the catchment area, (b) hydrologic flow path, treatment zones, sample collection points and dominant plant species in the CW (SZ = sedimentation zone; SM = shallow marsh; DM = deep marsh; SM2 = second shallow marsh; FSZ = final sedimentation zone)

where, C

in

is the inflow concentration in mg/L, and C

x

is the concentration at the representative location at each treatment zone in mg/L.

3. Results and Discussion

3.1 Characteristics of inflow stream water

Figure 2 shows the concentration of nutrient forms in stream water entering the CW. The CW received an average (mean ± standard deviation) of 7.22 ± 1.40 mg/L, 4.12 ± 1.53 mg/L, 0.19 ± 0.46 mg/L, 2.67 ± 1.68 mg/L, 0.57 ± 0.89 mg/L and 0.09 ± 0.06 mg/L TN, TKN, NH

4

-N, NO

3

-N, TP and PO

4

-P, respectively. Nutrient (i.e., TN and TP) inputs were 59%, 581% and 31% higher compared to nutrient concentrations in runoff irrigation water and CW influent concentration, respectively coming from paddy fields in Korea (Cho, 2003; Yoon, 2009; Jang et al., 2012). This may imply the need for additional treatment in water quality in this stream. In the United Kingdom, Canada and China; however, nutrient concentration of FWS CWs receiving domestic, municipal and agricultural wastewaters were 2 to 18 times higher than the nutrient inputs in this study. Nutrient speciation of FWS CWs in other countries also varies from this study depending on wastewater type (Cameron et al., 2003; Lu et al., 2009; Kayranli et al., 2010).

The proportion of TN and TP forms of the inflow

water to the CW was shown in Fig. 3. As can be seen, NO

3

-N constituted to about 35% of TN while NH

4

-N was only 6%. A larger proportion (approximately 59%) was in other forms which may include organic nitrogen and nitrite. Compared to other forms of nitrogen, the percentage of NO

3

-N was relatively high due to high concentration of NO

3

-N in streams surrounded by forests (Ice and Binkley, 2003). PO

4

-P that came from soil erosion and excessive use of fertilizer in crops constituted to almost 15% of TP, the rest was in other forms such as organic and inorganic phosphorus. Information on nutrient speciation is quite helpful in order to identify if there is a limiting nutrient in the stream that could affect change in receiving water bodies.

Fig. 2. Inflow nutrient concentration

(4)

Fig. 3. Inflow nitrogen and phosphorus proportions

3.2 Nutrient concentration changes in the wetland

It has to be emphasized that the FWS CW in this study is operated solely by gravity and no additional chemical or mechanical treatment was provided. Laying the treatment zones of the CW in meanders resolved the areal constraint requirement for most FWS CW and allowed the treatment zones to be long enough. Figure 4 illustrates the change of nutrient concentration along the hydrologic path of the CW with respect to inflow concentration. There was a large change in nutrient concentrations at the first 16% of the length such that 2.83 mg/L and 0.99 mg/L accumulated ∆C and fractional distance ratio (∆C/FD) was observed for TN and TP which attributed to the very purpose of SZ to retain most particles. From the end of the SZ until midway of SM2, small increments in ∆C with 1.17-1.86 mg/L and 0.44-0.65 mg/L ∆C/FD for TN and TP were observed, as well as, for most nutrients. The deviations of TN and TP concentration between SM and SM2 were approximately 0.14 mg/L and 0.07 mg/L, respectively, which were lower in comparison to ∆C between the inflow and SZ (0.34 and 0.12 mg/L).

Changes in ∆C NH

4

-N declined starting at the DM until SM2 implying a negative change in concentration, such that NH

4

-N concentration was increasing.

Concurrently, the DO concentration decreased at this segment of the CW as shown in Fig. 5. A possibility of denitrification and ammonification occurred in this segment of the CW since oxygen concentration was depleted and NH

4+

was flushed (Diaz et. al., 2012; Maltias-Landry et al., 2009). After passing midway of SM2 until the

3.3 Effect of physical properties on nutrient forms

The nitrogen transformations in the CW include ammonia volatilization, ammonification, denitrification, nitrification, nitrate-ammonification, fixation, plant uptake, ammonia adsorption and organic nitrogen burial;

(Vymazal, 2007) and some of these mechanisms are influenced by pH, temperature and DO. Figure 5 shows how pH, temperature and DO affect nitrogen species along the hydrologic path of the CW. Based on the study of reference (Kadlec and Reddy, 2001), the mean water temperature was approximately equal to mean air temperature during summer and winter, although these values do not reach the same values. However, in the case of spring and autumn, moderate temperatures cannot correspond to season. Summer and winter season may correspond to 21-25°C and <10°C ranges of water temperature and 11-20°C for spring and autumn season.

As can be seen in Fig. 5, TN concentrations were not highly affected by temperature unlike TP concentrations, wherein concentrations evidently increased with the raise in temperature. Elevated TP concentrations in higher water temperature were due to addition in NPS pollutant loading from stormwater runoff (Maniquiz et al., 2012). Nonpoint source inputs usually are intermittent and linked to seasonal agricultural activities or episodic events such as rainfall (Carpenter et al., 1998). Simultaneous to the increase in temperature was the increase in NH

4

-N, decrease in NO

3

-N and depletion of DO concentration.

Production rate of NH

4

-N by ammonification was influenced by temperature (Lee at al., 2009) and oxygen depletion was suspected to occur in SM2. Similar result on denitrification rate was observed in one study, wherein an increasing temperature from 4°C to 25°C was found to have positive effects on denitrification rate (Sirivedhin and Gray, 2006). Denitrification was also found to be optimum at pH values between 7 and 8.5.

No relationship was established between DO and

phosphorus concentrations in the water since phosphorus

(5)

(a) (b)

Fig. 4. Change in concentration in (a) nitrogen forms, (b) phosphorus forms with respect to the fractional distance.

removal in wetlands occurs from adsorption, plant absorption, complexation and precipitation (Watson et al., 1989). On the other hand, pH was inversely relative to PO

4

-P. An increase and decrease in pH would correspond to a decrease and increase in PO

4

-P concentration, respectively.

4. Conclusions

This study investigated the nutrient concentration changes along the hydrologic flow path of the FWS CW in an agricultural landuse. Findings revealed that the some physico-chemical properties such as temperature, DO and pH affected the nutrient retention in the CW. Specifically, the increased in TP concentration along with the water temperature raise resulted to increase in TP loadings during wet season. In addition, the rise and drop in pH and DO determined the existence of denitrification and ammonification occurring at the DM and SM2 due to the increase in NH

4

-N concentration. On the other hand, the lack of dependency of phosphorus forms on pH and DO signifies sedimentation, adsorption and plant uptake as the main removal mechanism for phosphorus in this FWS CW. High nutrient reduction was observed after passing the first sedimentation zone indicating the importance of settling process in the retention of nutrients. However, it was until the 85% of the length of the CW where nutrient retention was greatest indicating the deposition of nutrients at the alternating shallow and deep marshes. TN and TP concentration seemed to increase at the FSZ suggesting a possible nutrient sink in this segment of the

CW. It was therefore recommended to reduce or possibly remove the FSZ in the CW for an optimum performance, smaller spatial allocation and lesser construction expenses for similar systems.

Acknowledgement

The funding for this research was financially supported by the Eco-Innovation Project under the grant of the Ministry of Environment (#413-111-004) in Korea. The authors were grateful for their support.

References

Cameron, K., Madramootoo, C., Crolla, A. and Kinsley, C. (2003). Pollutant removal from municipal sewage lagoon effluents with a free-surface wetland, Water Research, 37(12), pp. 2803-2812.

Carpenter, S. R., Caraco, N. F., Correll, D. L. and Howarth, R. W. (1998). Nonpoint pollution of surface waters with phosphorus and nitrogen, Ecological Applications, 8(3), pp. 559-568.

Cho, J. Y. (2003). Seasonal runoff estimation of N and P in a paddy field of central Korea, Nutrient Cycling in Agroecosystems, 65(1), pp. 43-52.

DeBusk, T. A. and DeBusk, W. F. (2001). Wetlands for Water Treatment, Applied wetlands science and technology: Boca Raton, Forida, Lewis Publishers, pp.

241-280.

(6)

Fig. 5. Effect of physical properties on TN and TP forms along the hydrologic path of the CW (continued)

SZ SZ

SM2 SM2

FSZ FSZ

OUT OUT

(7)

Diaz, F. J., O’Geen, A. T. and Dahlgren, R. A. (2012).

Agricultural pollutant removal by constructed wetlands:

Implications for water management and design, Agricultural Water Management, 104, pp. 171-183.

Dunne, E. J., Culleton, N., O’Donovan, G., Harrington, R.

and Olsen, A. E. (2005). An integrated constructed wetland to treat contaminants and nutrients from dairy farmyard dirty water, Ecological Engineering, 24(3), pp. 221-234.

Greenberg, A. E., Clesceri, L. S. and Eaton, A. D.

(1992). Standard methods for the examination of water and wastewater, American Public Health Association (APHA), 18th edn.

Ice, G. and Binkley, D. (2003). Forest streamwater concentrations of nitrogen and phosphorus: A comparison with EPAs proposed water quality criteria, Journal of Forestry, 101(1), pp. 21-28.

Jang, T. I., Kim, H. K., Seong, C. H., Lee, E. J. and Park, S. W. (2012). Assessing nutrient losses of reclaimed wastewater irrigation in paddy fields for sustainable agriculture, Agriculture Water Management, 104, pp. 235-243.

Kadlec, R. H. and Reddy, K. R. (2001). Temperature effects in treatment wetlands, Water Environment Research, 73(5), pp.543-557.

Kadlec, R. H. and Wallace, S. D. (2009). Treatment Wetlands. CRC Press Boca Raton.

Kayranli, B., Scholz, M., Mustafa, A., Hofmann, O. and Harrington, R. (2010). Performance evaluation of integrated constructed wetlands treating domestic wastewater, Water, Air & Soil Pollution, 210, pp.

435-451.

Kang, C., Lee, S. Y., Cho, H. J., Lee, Y., Kim, L. H.

(2011). Test-bed evaluation of developed small constructed wetland for using in urban areas, J. of Wetlands Research, 13(3), pp. 455-463 [Korean Literature].

Kim, K. J., Kim, J. S., Kim, L. H., Yang, K. C. (2012).

Characteristics of nutrient uptake by aquatic plant in constructed wetlands for treating livestock wastewater, J. of Wetlands Research, 14(1), pp. 121-130 [Korean Literature].

Lee, C. G., Fletcher, T. D. and Sun, G. (2009). Nitrogen removal in constructed wetland systems, Engineering in Life Sciences, 9(1), pp. 11-22.

Lee, J. Y., Kang, C, Lee, S. Y., Kim, L. H. (2011).

Application of free water surface constructed wetland for NPS control in livestock watershed area, J. of

Wetlands Research, 13(3), pp. 481-488 [Korean Literature].

Lu, S., Zhang, P., Jin, X., Xiang, C., Gui, M., Zhang, J.

and Li, F. (2009). Nitrogen removal from agricultural runoff by full-scale constructed wetland in China, Hydrobiologia, 621(1), pp. 115-126.

Maltias-Landry, G., Maranger, R., Brisson, J. and Chazarenc, F. (2009). Nitrogen transformations and retention in planted and artificially aerated constructed wetlands, Water Research, 43(2), pp. 535-545.

Maniquiz, M. C., Choi, J. Y., Lee, S. Y., Kang, C. G.

and Kim, L. H. (2012). System design and treatment efficiency of a surface flow constructed wetland receiving runoff impacted stream water, Water Science and Technology, 65(3), 525-532.

Nyenje, P. M., Foppen, J. W., Uhlenbrook, S., Kulabako, R. and Muwanga, A. (2010). Eutrophication and nutrient release in urban areas of sub-Saharan Africa, Science of the Total Environment, 408(3), pp. 447-455.

Reddy, K. R., Kaldec, R. H., Flaig, E. and Gale, P. M.

(1999). Phosphorus retention in streams and wetlands:

A review, Critical Reviews in Environmental Science and Technology, 29(1), pp. 83-146.

Sirivedhin, T., and Gray, K. A. (2006). Factors affecting denitrification rates in experimental wetlands: Field and laboratory studies, Ecological Engineering, 26(2), pp. 167-181.

Tousignant, E., Fankhauser, O., Hurd, S. and Stantec Consulting Ltd. Research and Technology Transfer Group. (1999). Guidance manual for the design, construction and operations of constructed wetlands for rural applications in Ontario. Canada Program of the Agricultural Adaptation Council, Ontario.

Vymazal, J. (2005). Natural and constructed wetlands:

nutrients, metals and management, Backhuys Publishers, Leiden.

Vymazal, J. (2007). Removal of nutrients in various types of constructed wetlands, Science of the Total Environment, 380(1), pp. 48-65.

Water Management Information System (WAMIS) (2012).

http://www.wamis.go.kr/ENG/WKE_TCLQBB_LST.ASPX.

[Korean Literature]

Watson, J. T., Reed, S. C., Kadlec, R. H., Knight, R. L.

and Whitehouse, A. E. (1989). Performance expectations and loading rates for constructed wetlands, In: Hammer, D.A. (ed.), Constructed wetlands for Wastewater Treatment. Municipal, Industrial and Agricultural, pp.

319-658.

(8)

수치

Figure 2 shows the concentration of nutrient forms in  stream water entering the CW. The CW received an  average (mean ± standard deviation) of  7.22 ± 1.40 mg/L,  4.12 ± 1.53 mg/L, 0.19 ± 0.46 mg/L, 2.67 ± 1.68 mg/L,  0.57 ± 0.89 mg/L and 0.09 ± 0.06 mg/L
Fig. 3. Inflow nitrogen and phosphorus  proportions
Fig. 4. Change in concentration in (a) nitrogen forms, (b) phosphorus forms with respect to the fractional distance.
Fig. 5. Effect of physical properties on TN and TP forms along the hydrologic path of the CW (continued)

참조

관련 문서

Changes in the composition and structure of Mediterranean rokey-shore communities following a gradient of nutrient enrichment: Descriptive study and test

~ The streak lines can be used to trace the travel of a pollutant downstream from a smoke stack or other discharge. ~ In steady flow, Lagrangian path lines are the same as

Aerodynamic noise noise noise that noise that that that happen happen happen happen in in in in unsteady unsteady unsteady flow unsteady flow flow flow of

 management of the flow of information, products, and services across management of the flow of information, products, and services across a network of customers,

~ In steady flow, Lagrangian path lines are the same as the Eulerian streamlines, and both are the same as the streak lines, because the streamlines are then fixed in space

Because the free surface and interface are out of phase, between them a quasi- bottom exists where there is no vertical flow.. The LHS and RHS are imaginary

~ In steady flow, Lagrangian path lines are the same as the Eulerian streamlines, and both are the same as the streak lines, because the streamlines are then fixed in space

In this study, water flow system of Danghang Bay, which has the narrow and long topographical characteristics with the narrow bay mouth and its flow