Abstract
BACKGROUND: This study investigated the effects of rice genetically modified to be resistant against rice blast and rice bacterial blight on the soil microbial community. A comparative analysis of the effects of rice genetically modified rice choline kinase (OsCK1) gene for disease resistance (GM rice) and the Nakdong parental cultivar (non‐GM rice) on the soil microbial community at each stage was conducted using rhizosphere soil of the OsCK1 and Nakdong rice.
METHODS AND RESULTS: The soil chemistry at each growth stage and the bacterial and fungal population densities were analyzed. Soil DNA was extracted from the samples, and the microbial community structures of the two soils were analyzed by pyrosequencing. No significant
differences were observed in the soil chemistry and microbial population density between the two soils. The taxonomic analysis showed that Chloroflexi, Proteobacteria, Firmicutes, Actinobacteria, and Acidobacteria were present in all soils as the major phyla. Although the source tracking analysis per phylogenetic rank revealed that there were differences in the bacteria between the GM and non‐GM soil as well as among the cultivation stages, the GM and non‐GM soil were grouped according to the growth stages in the UPGMA dendrogram analysis.
CONCLUSION: The difference in bacterial distributions between Nakdong and OsCK1 rice soils at each phylogenetic level detected in microbial community analysis by pyrosequencing may be due to the genetic modification done on GM rice or due to heterogeneity of the soil environment.
In order to clarify this, it is necessary to analyze changes in root exudates along with the expression of transgene. A more detailed study involving additional multilateral soil analyses is required.
Key words: Genetically modified rice, OsCK1, Soil microbial community
*Corresponding author: Soo‐In Sohn
Phone: +82-63-238-4712; Fax: +82-63-238-4704;
E-mail: [email protected]
*Corresponding author: Bum kyu Lee Phone: +82-63-220-2227; Fax: +82-63-220-2054;
E-mail: [email protected]
Korean J Environ Agric. 2019;38(3):185-196. English Online ISSN: 2233-4173
Published online 2019 August 21. https://doi.org/10.5338/KJEA.2019.38.3.18 Print ISSN: 1225-3537
Effects of Disease Resistant Genetically Modified Rice on Soil Microbial Community Structure According to Growth Stage
Soo‐In Sohn
1*, Young‐Ju Oh
2, Jae‐Hyung Ahn
3, Hyeon‐jung Kang
1, Woo‐Suk Cho
1, Yoonsung Cho
1and Bum Kyu Lee
4*1Biosafety Division, Department of Agricultural Biotechnology, National Institute of Agricultural Sciences, Rural Development Administration, Wanju 55365, Korea,
2Institue for Future Environmental Ecology Co., Ltd., Jeonju 54883, Korea,
3Microbial Safety Team, Department of Agricultural Biology, National Institute of Agricultural Sciences, Rural Development Administration, Wanju 55365, Korea,
4Department of Environment Science & Biotechnology, College of Medical Science, Jeonju University, Jeonju 55069, Korea
Received: 25 June 2019/ Revised: 12 August 2019/ Accepted: 14 August 2019 Copyright ⓒ 2019 The Korean Society of Environmental Agriculture
This is an Open-Access article distributed under the terms of the Creative Commons Attribution Non-Commercial License (http://creativecommons.org/licenses/by-nc/3.0) which permits unrestricted non-commercial use, distribution, and reproduction in any medium, provided the original work is properly cited.
ORCID Soo‐In Sohn
https://orcid.org/0000‐0001‐8819‐7247
Bumkyu Lee
https://orcid.org/0000‐0001‐9661‐9606
185
Research Article Open Access
Introduction
The roots of plants secrete a wide variety of chemical compounds to attract microbes to the rhizosphere, resulting in the exclusive selection for the members of the soil microbial community (Huang et al., 2014). The roots release 5‐21% of the photosynthate in the form of sugars, amino acids or metabolites, and these substances are used by the microbes in the rhizosphere (Badri et al., 2013b; Chaparro et al., 2013a).
Specialized microbial communities are formed in the rhizosphere depending on the plant species, or even the variety, and plant developmental stage. They are also formed by the type and amounts of chemical compounds that comprise root exudates, which are determined by various environmental factors such as soil type, pH and temperature (Badri and Vivanco, 2009). Microbes associated with plants influence the health and growth of plants through a variety of mechanisms (Neumann et al., 2014; Haas and Défago, 2005; Menders et al., 2011;
Weller et al., 2002). Numerous studies have been conducted on the interactions between plants and microbes at the plant‐microbe level as well as the plant‐
microbiome level (Huang et al., 2014). Genetically modified (GM) crops might influence the soil microbial community in a direct way by the release of newly produced proteins in root exudates. In addition, these proteins might alter the metabolic pathways within the plant body, and the products of these pathways are released in the root exudates, thus imparting an indirect effect on the soil microbes. Therefore, a meticulous investigation of the potential effects of GM crops on the soil microbial community is required prior to their commercial cultivation.
GM crops resistant to diseases are needed to be developed to prepare for the effects of global warming due to climate change. To date, many GM crops resistant to diseases have been developed, and they are being widely cultivated. However, the cultivation of GM crops is causing many environmental concerns, one of which is the effects of GM crop cultivation on the soil microbial community, as mentioned above.
The reason for this concern is that alterations of the soil microbial community can cause additional effects through interactions with plants. The effects of GM crops resistant to diseases on the soil microbial community have been analyzed and reported through various methods. The GM potato that produces T4 lysozyme has been analyzed using the culturing
method, community level physiological profiling (CLPP), terminal restriction fragment polymorphism (T‐RFLP) analysis, and fatty acid methyl ester (FAME) analysis, and it was found that the potato either had no effect on the abundance or diversity of the rhizobacteria or only had minor effects (Heuer et al., 2002; Lottmann et al., 1999; Rasche et al., 2006). The effects of the GM potato that produces cecropin on the soil microbiota were investigated via amplified ribosomal DNA restriction analysis and automated ribosomal intergenic spacer analysis (ARISA), and it was reported that the potato influenced the diversity of the rhizobacteria (Sessitsch et al., 2003). In a study by Phironrit et al. (2007), a GM papaya resistant to papaya ring spot virus (PRSV) was compared to non‐
GM papayas, and no difference was found in the CLPP analysis.
Choline kinase is commonly distributed in eukaryotes, and it catalyzes the first stage of the Kennedy pathway, which produces phosphatidylcholine as a final product. Phosphatidylcholine mainly consists of phospholipid and is very important for the structure and functions of cell membranes (Gibellini and Smith, 2010; Lee et al., 2007). Many studies have reported that phosphatidylcholine is involved in adaptive responses to droughts, frost, high salinity, and insect damage in vascular plants (Gibellini and Smith, 2010; Lee et al., 2007). Kim et al. (2003) confirmed that the rice choline kinase (OsCK1) gene in rice plays a role in the cold response. Lee et al. (2007) developed GM rice resistant to rice blast and bacterial blight by overexpressing OsCK1 and is currently conducting an environmental risk assessment for its commercialization.
In this study, prior to its commercialization, the effects of GM rice resistant to rice blast and bacterial blight on the soil microbial community were studied.
The GM rice and its parental cultivar Nakdong rice were planted in a rice paddy. Soil chemical properties and soil microbial population density at each growth stage were studied, and the microbial community structures of these two soils were comparatively analyzed using pyrosequencing.
Materials and Methods
Site and sampling
The experimental plot for OsCK1 (GM) and Nakdong
(non‐GM) rice cultivation was constructed in an isolated
GMO experimental field at the National Institute of
Agricultural Sciences, Rural Development Administration located in Suwon, Korea. Seeds were sown in a seedling box and then transplanted in June 2012 after 3 weeks to three 4 x 4 m fields. Three replicates of rhizosphere soil samples were collected from each of the fields during the seedling, tillering, and maturity stages. In order to collect rhizosphere soil from the rice, we collected the rice plant with its roots, completely removed the bulk soil, and then collected as much soil as possible that was attached to the roots.
Soil chemical analyses
After collection, the soil samples were dried and then passed through a 2‐mm sieve for chemical analyses. These analyses were performed according to the methods described by the National Institute of Agricultural Sciences (NIAST, 2000). A pH meter was used to measure the pH of soil suspensions produced by mixing soil and distilled water at a ratio of 1:5.
Total nitrogen and carbon compositions were obtained via an elemental analyzer (vario Max CN, Elementar, Germany). Available phosphate was measured using the Lancaster method using a calorimetry assay.
Exchangeable cations such as calcium, potassium, magnesium, and sodium were diffused in 1 N ammonium acetate (pH 7.0) and then analyzed using ICP (GBC Integra XL, Australia).
Viable counts of bacteria and fungi
The density of soil microbes was assessed by the enumeration of cultured total bacteria and fungi after inoculating soil samples in respective selective media.
Ten grams of fresh soil was immersed in 90 mL of sterilized 0.85% NaCl solution and then suspended for 30 min using a shaking incubator (Vision Co., Korea) at 200 rpm. A series of dilutions was made using the suspension, and these dilutions were smeared onto three Petri dishes with R2A agar (Difco, Detroit, USA) containing cycloheximide (0.05 g/L) for bacterial culture and three Petri dishes with R2A agar containing chloramphenicol (0.02%) for fungal culture.
The bacteria‐ and fungi‐inoculated media were incubated at 28°C for 2 and 4 d, respectively, prior to counting the number of colonies. The number of microorganisms in each sample was calculated by counting the number of colonies in each of the three Petri dishes and using the average value as the colony‐forming unit (cfu∙g
‐1dry soil).
Pyrosequencing
Total DNA was extracted from microorganisms in the soil using a FastDNA Spin Kit (Qbiogen, USA) according to the manufacturer’s manual. The extracted DNA was amplified using primers targeting the V1 to V3 regions of the prokaryotic 16S rRNA gene. The primers used for bacteria were V1‐9F (5’‐CCTATCCCCTGTGTGCCTTG GCAGT C‐TCAG‐AC‐GAGTTTGATCMTGGCTCAG‐3’:
underlining indicates the gene specific part) and V3‐
541R (5’‐CCATCTCATCCCTGCGTGTCTCCGAC‐TCAG
‐X‐AC‐WTTACCGCGG CTGCTGG‐3’: the X barcode is uniquely designed for each soil DNA samples, followed by common linker [AC]). PCR amplifications were performed using a C1000 Touch™ Thermal Cycler (Bio‐
Rad, CA, USA). A total of 100 ng template DNA was added to the PCR reaction (total volume of 50 μL), which contained Ex Taq buffer, 0.2 mM each dNTP, 0.5 μΜ each primer, and 2 units Ex Taq (Takara, Otsu, Japan).
After an initial denaturation (94°C for 5 min), the PCR reaction was carried out using the touchdown program, which involved 10 cycles of denaturation (94°C for 30 s), annealing (60°C for 45 s), and extension (72°C for 90 s), where the annealing temperature was decreased by 0.5°C for each subsequent cycle. An additional 20 cycles of denaturation (94°C for 30 s), annealing (55°C for 45 s), and extension (72°C for 90 s) were carried out. The amplified products were confirmed by 2% agarose gel electrophoresis and visualized using the Gel Doc system (Bio‐Rad). Amplicons were purified using a QIAquick®
PCR Purification Kit (Qiagen, CA, USA) and quantified using a PicoGreen® dsDNA Assay Kit (Invitrogen, CA, USA). Equimolar concentrations of each amplicon from the different samples were pooled and purified using an AMPure bead kit (Agencourt Bioscience, MA, USA) and then amplified on sequencing beads with emulsion PCR. Sequencing reactions were performed using a Roche GS FLX Titanium System at ChunLab Inc. (Seoul, Korea) according to the manufacturer’s instructions.
Pyrosequencing data analyses
The sequencing reads from the different samples were separated by unique barcodes. The sequences of the barcode, linker, and PCR primers were then removed from both sides of the original sequencing reads. The resultant sequences were subjected to a filtering process where only reads containing 0 to 1 ambiguous base calls (Ns) and 300 or more base pairs were selected for the final bioinformatics analyses.
Nonspecific PCR amplicons that showed no match
with the 16S rRNA gene database in a BLASTN search (expectation value of >e
‐5) were also removed from the subsequent analyses. Chimeric sequences were detected by the analysis of differences in BLASTN based sequence similarity patterns between the first half and second half of an object sequence. When the first and second halves were differentially identified at the bacterial order level, the sequence was regarded as chimeric, thus eliminated. The obtained sequences were compared and classified using the EzTaxon Database (http://www.ezbiocloud.net) (Chun et al., 2007), which contains 16S rRNA gene sequences of type strains that have valid published names and representative species‐
level phylotypes of either cultured or uncultured entries in the GenBank public database with complete hierarchical taxonomic classification from the phylum to the species level. The cut‐off values used for taxonomic assignments were as follows (x = similarity): species (x
≥ 97%), genus (97% > x ≥ 94%), family (94% > x ≥ 90%), order (90% > x ≥ 85%), class (85% > x ≥ 80%) and phylum (80 > x ≥ 75%). If the similarity was lower than the specific cut‐off value, the sequence was assigned as ‘unclassified’ (Chun et al., 2007; Unno et al., 2010; Park et al., 2012). For the taxonomic affiliation, if the scientific name for a taxon was unknown, the known name in the nomenclature was written first, and then, a suffix was added at the end of the name after an underscore (e.g. if the class name was unknown, a ‘c’
was written after the phylum name. ‘ Acidobacteria _c’; c
= class, o = order, f = family, g = genus, and s = species) (Kim et al., 2012).
A rarefaction curve that shows the increase in the ratio of operational taxonomic units (OTUs) to the analyzed sequence number was constructed based on the CD‐HIT (Li et al., 2001; Fu et al., 2012) and Mothur software packages (Schloss et al., 2009). The
number of OTUs was calculated from the sequence group that showed 97% sequence homology based on the taxonomy‐based de novo clustering algorithm (Lee et al., 2012), and this number was used to calculate the Shannon diversity index (H), which is a measure of diversity and evenness, and the richness estimators ACE and Chao 1. In order to analyze the sharedness of the species shared between the soils, a single source tracking analysis was conducted using the CLcommunity™ for Microbial Community Analysis program (ChunLab, Seoul, Korea) by ChunLab. The Nakdong rice soil at the seedling stage was chosen for the sink, whereas the rest of the soil samples, that is, the all stages of OsCK1 rice soils and tillering and maturity stage Nakdong rice soils were the source. The sharedness between the sink and source was calculated using the following formula:
Sharedness (%) = [(s/a) x 100 + (s/b) x 100]/2, where
‘s’ represents the number of sequences found in both samples, ‘a’ represents the total number of source samples, and ‘b’ represents the number of sink sample species. The similarity between each pair of communities was estimated using the Fast UniFrac web interface (Hamedy et al., 2010) and visualized using the unweighted pair group method with an arithmetic mean (UPGMA) dendrogram.
Results
Chemical characteristics of soil samples
Because differences in the soil chemical composition can affect soil microbial communities, soil pH, available phosphate, electrical conductivity, total nitrogen, organic matter, and cations were analyzed to identify possible differences between the rhizosphere soil of OsCK1 rice and that of Nakdong rice (Table S1).
Growth
Stage Sample pH Pa
(mg/kg)
ECb (dS/m)
T‐Nc (%)
OMd (g/kg)
Cation (cmol/kg)
K+ Ca2+ Mg2+ Na2+
Seedling Stage
ND 6.7±0.02 96.0±1.07 0.3±0.01 0.2±0.01 20.6±0.2 0.7±0.01 7.8±0.25 2.1±0.01 0.3±0.00 OsCK1 6.6±0.01 93.3±3.06 0.3±0.00 0.2±0.00 18.7±0.4 0.5±0.01 8.2±0.10 2.3±0.02 0.2±0.00 Tillering
Stage
ND 6.3±0.02 83.4±1.26 0.3±0.02 0.2±0.01 19.3±0.31 0.5±0.01 7.9±0.15 2.1±0.12 0.2±0.00 OsCK1 6.3±0.03 80.2±1.66 0.3±0.01 0.2±0.01 18.7±0.09 0.4±0.01 8.1±0.34 2.2±0.04 0.2±0.00 Maturity
stage
ND 6.4±0.01 69±1.16 0.2±0.00 0.2±0.00 19.2±0.26 0.4±0.00 7.2±0.20 2.1±0.12 0.2±0.01 OsCK1 6.6±0.01 70±2.83 0.3±0.00 0.2±0.00 18.6±0.30 0.4±0.01 7.4±0.12 2.2±0.12 0.2±0.00
a, Available phosphate; b, Electrical conductivity; c, Total nitrogen; d, Soil organic matter; ND, Nakdong; OsCK1, disease‐
resistant transgenic rice. There was no significant difference between Nakdong and OsCK1 rice soils according to growth stage (t‐test,
p
< 0.05).Table S1. Soil chemical properties in the rhizosphere soil of Nakdong and OsCK1 rice
There was no significant difference in soil pH between OsCK1 (pH 6.3–6.6) and Nakdong rice (pH 6.3–6.7). In this study, the available phosphate was 69–96 mg kg
‐1for OsCK1 rice and 70–93 mg kg
‐1for Nakdong rice soil, which was not significantly different. The soil electrical conductivity for OsCK1 was 0.2–0.3 dS m
‐1and that of Nakdong rice was 0.3 dS m
‐1throughout the growth stages, and the total nitrogen content was similar between the two soils. Moreover, there were no significant differences in either organic matter or cations, such as K
+, Ca
2+, Mg
2+, or Na
2+, between OsCK1 and Nakdong rice soils.
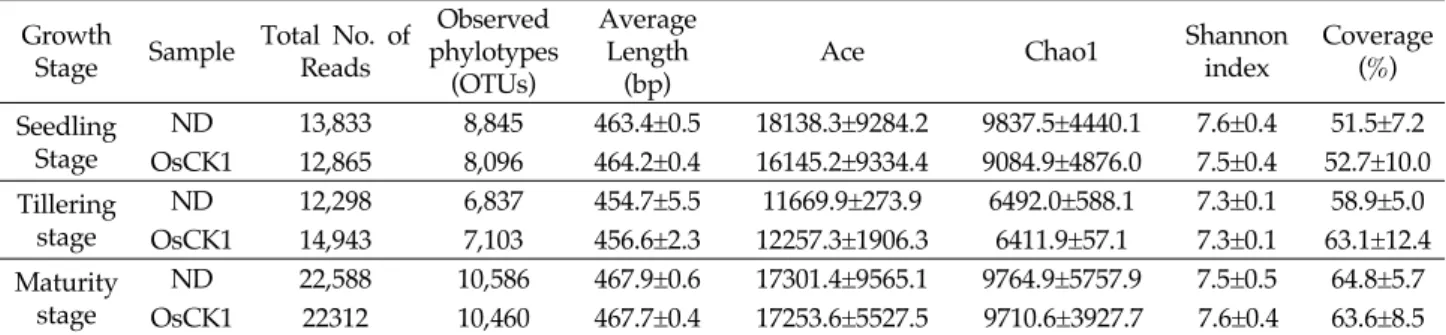
Bacterial community comparative analysis In this study, we did not observe significant difference in bacterial and fungal quantities between OsCK1 and Nakdong rice soil microbial communities (Table S2). The total number of pyrosequencing reads was 98,839, among which 51,927 were high‐quality reads. The results for the OTU richness patterns from the Chao 1 and ACE analyses showed that the pattern for the Nakdong soil at the seedling stage
was the highest, and ACE for the Nakdong rice soil and Chao 1 for the OsCK1 soil at the tillering stage were the lowest (Table 1). The results for the Shannon index values indicated that the diversity of the Nakdong rice soil at the seedling stage and OsCK1 soil at the maturity stage were the highest and those of the Nakdong and OsCK1 rice soils at the tillering stage were the lowest (Table 1).
Taxonomic Analysis of the Bacterial Communities In total, 73 phyla were observed, and all soils contained 8‐11 phyla excluding the phyla with the relative abundance less than 1% (Fig. 1). The major phyla (>5%) in all soils were Chloroflexi , Proteobacteria , Firmicutes , Actinobacteria , and Acidobacteria . At the seedling stage, the relative abundance of Chloroflexi was observed at a similar level as that of Proteobacteria for both soils, while at the tillering stage, the Nakdong rice soil exhibited similar levels for Chloroflexi and Proteobacteria but OsCK1 soil had a higher relative abundance of Chloroflexi (32.1%) compared to Proteobacteria (24.8%) (Fig. 1). Results in Figure 1 also
Growth
Stage Microbes ND OsCK1
Seedling Stage
Bacteria (x106) 21.3±3.2 22±2.6
Fungi (x103) 19.3±2.1 21.3±2.9
Tillering Stage
Bacteria (x106) 82.3±4 79.3.±5.1
Fungi (x103) 18.3±2.5 20.7±2.5
Maturity stage
Bacteria (x106) 63.3±1.5 62±4.6
Fungi (x103) 18±4.4 17.3±2.5
Values indicate the colony‐forming unit (cfu)/g wet weight ± standard deviation from three replications. There was no significant difference between Nakdong and OsCK1 rice soils according to growth stage (t‐test,
p
< 0.05). ND, Nakdong;OsCK1, disease‐resistant transgenic rice
Table S2. Average number of colony‐forming units in the rhizosphere soil
Growth
Stage Sample Total No. of Reads
Observed phylotypes
(OTUs)
Average Length
(bp)
Ace Chao1 Shannon
index
Coverage (%) Seedling
Stage
ND 13,833 8,845 463.4±0.5 18138.3±9284.2 9837.5±4440.1 7.6±0.4 51.5±7.2 OsCK1 12,865 8,096 464.2±0.4 16145.2±9334.4 9084.9±4876.0 7.5±0.4 52.7±10.0 Tillering
stage
ND 12,298 6,837 454.7±5.5 11669.9±273.9 6492.0±588.1 7.3±0.1 58.9±5.0 OsCK1 14,943 7,103 456.6±2.3 12257.3±1906.3 6411.9±57.1 7.3±0.1 63.1±12.4 Maturity
stage
ND 22,588 10,586 467.9±0.6 17301.4±9565.1 9764.9±5757.9 7.5±0.5 64.8±5.7 OsCK1 22312 10,460 467.7±0.4 17253.6±5527.5 9710.6±3927.7 7.6±0.4 63.6±8.5 Estimates of the Shannon index were obtained based on 3% differences in DNA sequence alignments. Values of Ace, Chao1, Shannon and coverage indicate the mean ± standard deviation from three replications. There was no significant difference between Nakdong and OsCK1 rice soils (t‐test,
p
< 0.05). ND, Nakdong; OsCK1, disease‐resistant transgenic rice.Table 1. Bacterial diversity indices in Nakdong and OsCK1 rice rhizosphere soils
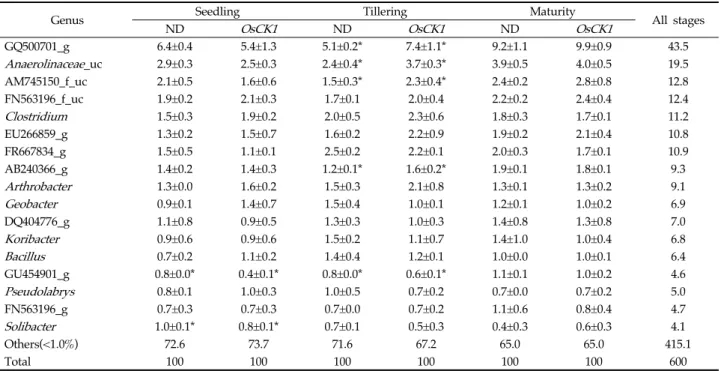
Fig. 1. Comparison of the bacterial composition between Nakdong and OsCK1 rhizosphere soils. SS, seedling stage; TS, tillering stage; MS, maturity stage; ND, Nakdong; OsCK1, pathogen‐resistant transgenic rice.
* indicate a statistically significant difference between two soils (t‐test,
p
< 0.05).Genus Seedling Tillering Maturity
All stages
ND OsCK1 ND OsCK1 ND OsCK1
GQ500701_g 6.4±0.4 5.4±1.3 5.1±0.2* 7.4±1.1* 9.2±1.1 9.9±0.9 43.5
Anaerolinaceae_uc 2.9±0.3 2.5±0.3 2.4±0.4* 3.7±0.3* 3.9±0.5 4.0±0.5 19.5
AM745150_f_uc 2.1±0.5 1.6±0.6 1.5±0.3* 2.3±0.4* 2.4±0.2 2.8±0.8 12.8
FN563196_f_uc 1.9±0.2 2.1±0.3 1.7±0.1 2.0±0.4 2.2±0.2 2.4±0.4 12.4
Clostridium 1.5±0.3 1.9±0.2 2.0±0.5 2.3±0.6 1.8±0.3 1.7±0.1 11.2
EU266859_g 1.3±0.2 1.5±0.7 1.6±0.2 2.2±0.9 1.9±0.2 2.1±0.4 10.8
FR667834_g 1.5±0.5 1.1±0.1 2.5±0.2 2.2±0.1 2.0±0.3 1.7±0.1 10.9
AB240366_g 1.4±0.2 1.4±0.3 1.2±0.1* 1.6±0.2* 1.9±0.1 1.8±0.1 9.3
Arthrobacter 1.3±0.0 1.6±0.2 1.5±0.3 2.1±0.8 1.3±0.1 1.3±0.2 9.1
Geobacter 0.9±0.1 1.4±0.7 1.5±0.4 1.0±0.1 1.2±0.1 1.0±0.2 6.9
DQ404776_g 1.1±0.8 0.9±0.5 1.3±0.3 1.0±0.3 1.4±0.8 1.3±0.8 7.0
Koribacter 0.9±0.6 0.9±0.6 1.5±0.2 1.1±0.7 1.4±1.0 1.0±0.4 6.8
Bacillus 0.7±0.2 1.1±0.2 1.4±0.4 1.2±0.1 1.0±0.0 1.0±0.1 6.4
GU454901_g 0.8±0.0* 0.4±0.1* 0.8±0.0* 0.6±0.1* 1.1±0.1 1.0±0.2 4.6
Pseudolabrys 0.8±0.1 1.0±0.3 1.0±0.5 0.7±0.2 0.7±0.0 0.7±0.2 5.0
FN563196_g 0.7±0.3 0.7±0.3 0.7±0.0 0.7±0.2 1.1±0.6 0.8±0.4 4.7
Solibacter 1.0±0.1* 0.8±0.1* 0.7±0.1 0.5±0.3 0.4±0.3 0.6±0.3 4.1
Others(<1.0%) 72.6 73.7 71.6 67.2 65.0 65.0 415.1
Total 100 100 100 100 100 100 600
Values indicate the mean ± standard deviation from three replications. * indicate a statistically significant difference between two soils (t‐test, p < 0.05). ND, Nakdong; OsCK1, disease‐resistant transgenic rice.
Table 2. Abundances of bacterial genera in Nakdong and OsCK1 soil libraries
showed that Chloroflexi was present at about twice the level of Proteobacteria at the maturity stage. Among phyla showing a relative abundance over 1% in the seedling stage of Nakdong rice and OsCK1, Firmicutes had a significant difference of distribution rate between Nakdong and OsCK1 rice soil (p<0.05). In the tillering stage among phyla showing a relative abundance of over 1%, Cloroflexi , Proteobacteria , Nitrospirae ,
Bacteroidetes , Planctomycetes , and Chlorobi had a significant difference between Nakdong and OsCK1 rice soil (p<0.05). In the maturity stage among phyla showing a relative abundance of over 1%, cyanobacteria had over 20% higher relative abundance in OsCK1 rice soil compared to that of Nakdong rice soil.
At the genus level, 2,442 genera were observed
and 197 genera were found in all soils (Table 2).
Among genera showing a relative abundance of over 1%, the number of genus with significant difference in the relative abundance between Nakdong and OsCK1 rice soils was 2 in the seedling stage, 5 in the tillering stage, and 3 in the maturity stage. The genera with the highest relative abundance difference between Nakdong and OsCK1 rice soils were GU454901_g (Nakdong: 0.8%, OsCK1: 0.4) in the seedling stage, AM745150_f_uc (Nakdong: 1.51%, OsCK1: 2.35) in the tillering stage and Solibacter (Nakdong: 0.41%, OsCK1: 0.61) in the maturity stage.
The sharedness of the OTUs that comprise the
microbial community structure was analyzed through single source tracking analysis (Table 3). When the Nakdong rice soil at the seedling stage was the sink and the rest were the source, the sharedness was 99.6%~99.9% at the phylum level, 96.9~99.8% at the class level, 91.9~99.6% at the order level, 85.8~98.8%
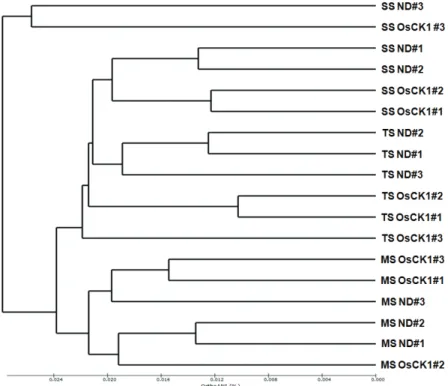
at the family level, 79.8~96.4% at the genus level, and 45.3~76.7% at the species level. The UPGMA dendrogram analysis examining the overall similarity between the two soil bacterial communities showed that the soils grouped by time period (Fig. 2).
Phylo‐
genetic Level
SS ND
#2 SS ND
#3 SS OsCK1
#1 SS OsCK1
#2 SS OsCK1
#3 TS ND
#1 TS ND
#2 TS ND
#3 TS OsCK1
#1 TS OsCK1
#2 TS OsCK1
#3 MS ND
#1 MS ND
#2 MS ND
#3 MS OsCK1
#1 MS OsCK1
#2 MS OsCK1
#3 Phylum 99.93 99.64 99.58 99.69 99.84 99.71 99.64 99.69 99.71 99.71 99.71 99.77 99.72 99.75 99.62 99.72 99.71
Class 99.83 97.64 99 99.33 97.51 99.3 99.14 99.17 99.13 99.13 99.24 98.91 99.04 97.35 99.05 96.91 99.27 Order 99.61 92.11 97.8 98.03 91.94 98.18 98.21 97.83 97.61 97.61 97.5 97.82 97.82 91.80 97.95 92.07 97.67 Family 98.75 86.86 94.51 94.70 85.79 94.9 95.14 95.05 94.28 94.28 93.70 94.31 94.50 87.90 94.92 87.44 95.39 Genus 96.35 79.97 85.62 87.35 79.77 86.24 87.26 87.77 86.03 86.03 86.81 85.88 87.38 81.78 86.71 81.44 88.33 Species 76.67 51.38 51.08 57.37 45.28 52.68 62.29 53.22 50.95 50.95 63.17 52.37 64.25 55.92 50.8 55.49 65.17
* Sink: SSND#1 soil
* Source: SSND#2, SSND#3, SSOsCK1#1, SSOsCK1#2, SSOsCK1#3, TSND#1, TSND#2, TSND#3, TSOsCK1#1, TSOsCK1#2, TSOsCK1#3, MSND#1, MSND#2, MSND#3, MSOsCK1#1, MSOsCK1#2, and MSOsCK1#3 soils
SS, seedling stage; TS, tillering stage; MS, maturity stage; ND, Nakdong; OsCK1, disease‐resistant transgenic rice
Table 3. Sharedness analysis between sink and source soil
Fig. 2. A UPGMA dendrogram based on the unweighted pair‐wise Fast UniFrac distances between the bacterial communities in the ND and OsCK1 rice soil samples. SS, seedling stage; TS, tillering stage; MS, maturity stage; ND, Nakdong; OsCK1, disease‐resistant transgenic rice.