참기름과 혼합유의 성분 및 NIR Spectrum 분석을 통한 품질특성 비교
주재영․여용헌․이남례 국방기술품질원
Comparison of Quality Characteristics of Sesame Oil and Blend Oil by Using Component Analysis and NIR Spectroscopy
Jae-young Joo, Yong-heon Yeo, and Namrye Lee Combat Material Center, Defence Agency for Technology and Quality
ABSTRACT Product distribution and consumption in the military is difficult due to unique contracts and supply systems. It is difficult to change suppliers immediately when quality problem is encountered. Due to these special circumstances, the quality of products must be thoroughly controlled. Sesame oil is used to increase the taste and nutrition of food, but it is more expensive than other cooking oils. Oil producers may blend other cooking oils with sesame oil to make higher profits, so it has become important to identify good and bad products. In this study, pure sesame oil and blend oils were compared by analyzing their smell, taste, chemical components, and near infra-red spectra to determine quality differences between them.
Key words: quality comparison, NIR, sesame oil, military foods, blend oil
Received 28 March 2017; Accepted 10 May 2017
Corresponding author: Namrye Lee, Combat Material Center, De- fence Agency for Technology and Quality, Daejeon 35409, Korea E-mail: [email protected], Phone: +82-42-580-1064
서 론
참기름의 경우 음식에 고소한 맛을 내며, 또한 천연 항산 화 물질이 풍부하여 산화 안정성이 높고 다양한 불포화지방 산을 다량 함유하고 있어 음식의 맛과 영양을 함께 충족시킬 수 있는 훌륭한 재료로 군에서도 소비되고 있다(1). 그러나 참기름은 다른 식용유류에 비해 크게는 10~20배 이상 가격 이 비싸므로(2) 값싼 식용유류를 혼합하여 만든 가짜 참기름 으로 인한 사건들이 매년 발생되어 사회적 물의를 일으키고 있다. 이러한 연유로 군과 계약된 업체들의 제품 생산을 원 자재 단계부터 납품까지 모두 확인한다면 품질에 대해 신뢰 를 할 수 있으나, 현재는 식품공전에 대한 규격치 만족 여부 를 확인하여 군으로 납품이 되고 있어 군납 식품에 대한 진 위판별로 품질 신뢰성 향상을 위한 방안이 필요한 실정이다.
식품 진위판별에는 nuclear magnetic resonance(NMR) (3), infrared spectroscopy(IR)(4), fluorescence spec- troscopy(5), atomic absorption spectrometer(AAS)(6), inductively coupled plasma-mass spectrometer(ICP- MS)(7), high pressure liquid chromatography(HPLC) (8), gas chromatography(GC)(9), 전기영동(10), 전자코 (11), PCR(12)법 등을 활용하여 주요 성분을 검출 또는 분 포 패턴을 진위 판별에 이용하고 있다. 질량분석기술 및 기
기의 발달로 GC/MS, LC/MS 등이 활용되어 정밀도와 정확 도가 크게 향상되었으나(13), 시료의 전처리 과정과 분석에 시간이 소요되기 때문에 최근에는 near infra-red spec- troscopy(NIR)(14-16)를 통한 식품의 분석이 활발하게 진 행되고 있다.
현재 참기름의 진위판별에는 위에 언급한 다양한 방법이 활용되지만(17-20) 본 연구에서는 색도, 산가, 요오드가, 지 방산 조성 등 화학적인 분석과 NIR을 이용한 분광학적 분석 을 통해 참기름과 혼합유에 대한 품질특성을 비교하였고, 3가지 PC를 이용한 3차원 분석을 통해 결과를 입체적이고 직관적으로 확인할 수 있었다. 각 시료 간 비교 분석한 결과 들은 추후 군납 참기름 및 식품의 진위판별 및 품질 신뢰성 향상을 위한 데이터로 활용하고자 하였다.
재료 및 방법
실험재료
실험에 사용한 참기름, 옥수수기름, 콩기름은 동일한 제 조원(CJ CheilJedang, Seoul, Korea)에서 제조되어 시판되 는 제품을 공식 대리점에서 구입하여 사용하였다. 참기름에 섞인 다른 기름에 의한 영향을 확인하기 위해 옥수수기름과 콩기름을 참기름과 일정 비율로 혼합하여 실험하였다.
혼합유 제조
순수 참기름과 혼합유의 물리 화학적 특성을 비교하기 위 해 혼합유를 제조하였다. 기준을 잡기 위해 참기름 100%를
Table 2. Condition of scanning parameters
InstrumentRange Sample cell Detection mode
NIRFlex N-500 (BUCHI Labortechnik AG, Flawil, Switzerland)
4,000∼10,000 cm-1 Petri dish
Reflectance
Table 4. Acidity and iodine value of sesame oil and blend oils
Sample Acid value Iodine value ControlC05 C10 C15 C20 C25 S05 S10 S15 S20 S25
1.673±0.040a1) 1.593±0.008ab 1.517±0.034b 1.416±0.030cd 1.372±0.019de 1.277±0.028e 1.585±0.019ab 1.503±0.004bc 1.391±0.006d 1.319±0.004de 1.272±0.042e
106.990±0.495d 107.585±0.092cd 108.685±0.361bc 108.645±0.092bc 109.105±0.148b 109.975±0.544b 109.040±0.580b 109.755±0.163b 111.420±0.057a 112.455±0.530a 112.290±0.028a
1)Means with different letters (a-e) in the same column are sig- nificantly different (P<0.05).
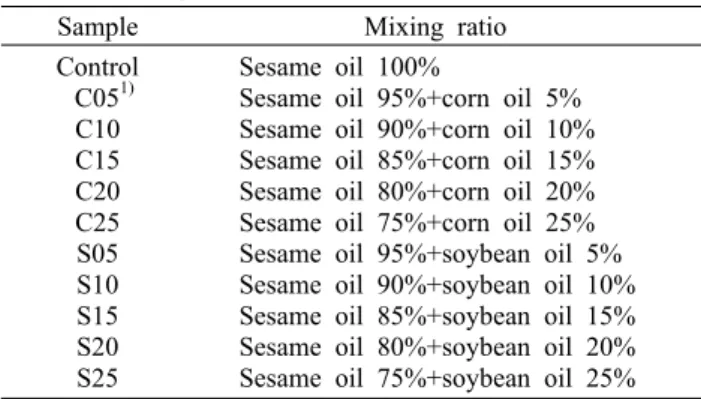
Table 1. Mixing ratio of sesame oil and blend oil
Sample Mixing ratio
Control C051) C10 C15 C20 C25 S05 S10 S15 S20 S25
Sesame oil 100%
Sesame oil 95%+corn oil 5%
Sesame oil 90%+corn oil 10%
Sesame oil 85%+corn oil 15%
Sesame oil 80%+corn oil 20%
Sesame oil 75%+corn oil 25%
Sesame oil 95%+soybean oil 5%
Sesame oil 90%+soybean oil 10%
Sesame oil 85%+soybean oil 15%
Sesame oil 80%+soybean oil 20%
Sesame oil 75%+soybean oil 25%
1)Each symbol means mixing ration of corn or soybean oil to sesame oil.
Table 3. Chromaticity test results of sesame oil and blend oils
Sample L1) a2) b3)
Control C05 C10 C15 C20 C25 S05 S10 S15 S20 S25
30.00±0.10e4) 31.00±0.10d 31.93±0.42c 33.53±0.06b 34.30±0.53b 35.80±0.20a 30.87±0.32d 32.17±0.21c 33.53±0.25b 34.10±0.26b 35.53±0.15a
24.67±0.15a 24.13±0.06ab 23.70±0.17bc 22.97±0.06d 22.23±0.31e 21.50±0.20f 24.00±0.26b 23.47±0.06c 22.63±0.12de 22.43±0.12e 21.27±0.06f
37.83±0.32f 39.33±0.40ef 41.30±0.00d 43.53±0.12c 42.83±1.58cd 45.90±0.20a 39.57±0.40e 41.40±0.26d 43.67±0.67c 44.13±0.55bc 45.67±0.12ab
1)Values mean 0 of blackness to 100 of whiteness.
2)Values mean redness during 0 to 100 and greenness 0 to -80.
3)Values mean yellowness during 0 to 70 and blueness during 0 to -70.
4)Means with different letters (a-f) in the same column are sig- nificantly different (P<0.05).
대조구로 사용하였다. 옥수수기름 혼합에 따른 영향을 알아 보기 위해 참기름 중 옥수수기름 비율(v/v)이 5~25%가 되 도록 제조하였으며, 콩기름 혼합에 따른 영향을 알아보기 위해 참기름 중 콩기름 비율(v/v)이 5~25%가 되도록 제조 하였다(Table 1). 각 혼합유 시료는 실험 및 측정 시마다 필요한 양 만큼을 덜어 자석가열교반기(MS-H280-Pro, Dragon Laboratory Instruments Limited, Beijing, China) 를 이용해 600 rpm으로 5분간 교반 제조하여 사용하였다.
색도 및 NIR 측정
각 시료의 색도 차이를 알아보기 위해 휴대용 색차계(LC 100, LOVIBOND HOUSE Co., Solar Way, Amesbury, UK)를 사용하여 L, a, b 값을 구하였으며, 3번 반복 측정하였 다. NIR 측정을 위해 각 시료를 23 mL씩 담은 후 NIR spec- trometer(NIRFlex N-500, BUCHI Labortechnik AG, Flawil, Switzerland)를 이용하여 800~2,500 nm 파장대의 스펙트럼을 확인하였으며, 3회 반복 측정하였다(Table 2).
화학적 특성 확인
시료 간 화학적 특성을 비교하기 위해 식품공전(21)에서 제시한 시험방법을 적용하여 산가, 요오드가(위이스법), 지 방산 조성(제1법)을 3회 반복 측정하였다. 각 시료를 120 mL씩 제조하고 실온에서 500 rpm으로 교반하였고 NIR spectrometer(NIRFlex N-500, BUCHI Labortechnik AG) 를 이용하여 3회 반복하여 정성분석을 하였다.
결과 및 고찰
참기름과 혼합유 색도
참기름 및 혼합유의 L, a, b 값은 Table 3과 같다. 참기름 에 혼입된 옥수수기름 및 콩기름의 혼합 비율이 증가할수록 참기름의 어두운 정도가 감소하여 밝기(L)가 증가했고 붉은 정도(a)가 감소했으며 노란 정도(b)가 증가하였다 색도의 항 목별 경향은 혼입량의 증가에 따라 비례하여 증감하는 것을 확인할 수 있었다. 이는 옥수수기름과 콩기름이 추출방식을 이용하는 반면에 참기름은 참깨를 볶은 후 압착하여 기름을 얻어내고 탈색을 하지 않아 추출유에 비해 색이 짙기 때문이 다. 이러한 변화는 육안으로 확인은 어렵지만 분석기기를 이용하여 분석한 후 품질확인을 위한 지표로 활용할 수 있을 것으로 기대된다.
참기름과 혼합유 산가, 요오드
참기름에 혼입된 옥수수기름 및 콩기름의 혼합 비율이 증 가할수록 산가는 낮아지고 요오드가는 높아지는 경향을 보 였다(Table 4). 단일 제품으로 보면 옥수수기름과 콩기름의 산가는 참기름에 비해 낮으므로 식품공전에서 규정하는 규 격치 또한 낮게 관리되고(Table 5), 혼합하였을 때 유종에 상관없이 비슷한 경향을 보이며 감소하는 것으로 확인되었
Table 5. Standards of oils on Korean Food Standards Codex
Classify Sesame oil Soybean oil Corn oil
Acid value Iodine value Linolenic acid (%)1) Erucic acid (%)
≤4.0 103∼118
≤0.5 Not be detected
≤0.2 123∼142
-
-
≤0.6 103∼130
-
-
1)
Content of linolenic acid in palmitic acid, stearic acid, oleic acid, linoleic acid, linolenic acid, and arachidic acid.
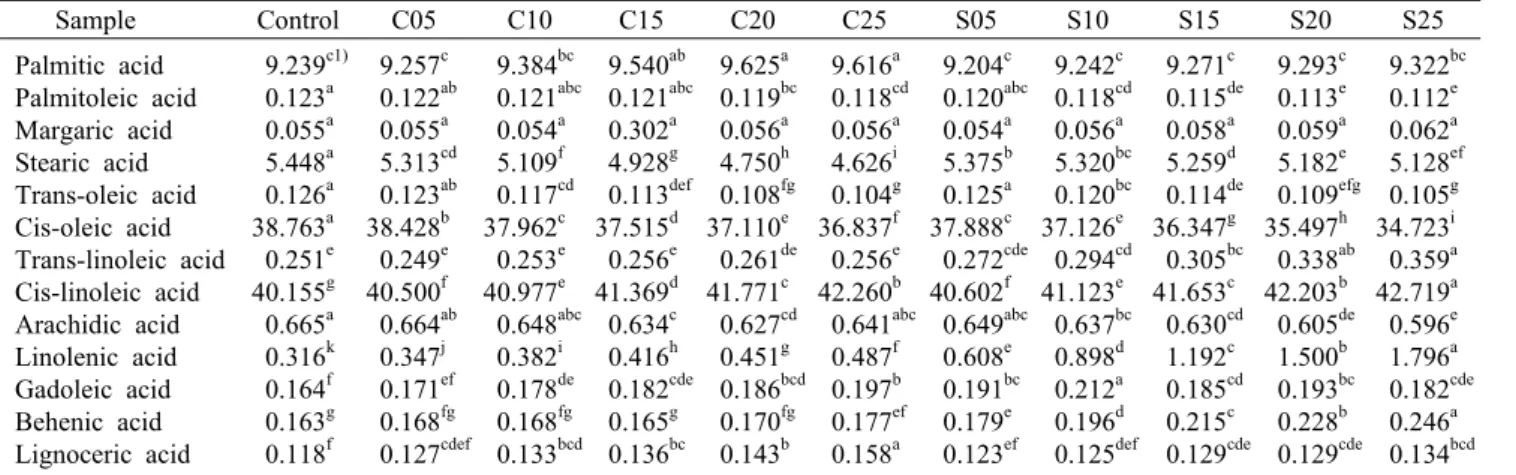
Table 6. Contents of fatty acid in samples
Sample Control C05 C10 C15 C20 C25 S05 S10 S15 S20 S25
Palmitic acid Palmitoleic acid Margaric acid Stearic acid Trans-oleic acid Cis-oleic acid Trans-linoleic acid Cis-linoleic acid Arachidic acid Linolenic acid Gadoleic acid Behenic acid Lignoceric acid
9.239c1) 0.123a 0.055a 5.448a 0.126a 38.763a 0.251e 40.155g 0.665a 0.316k 0.164f 0.163g 0.118f
9.257c 0.122ab 0.055a 5.313cd 0.123ab 38.428b 0.249e 40.500f 0.664ab 0.347j 0.171ef 0.168fg 0.127cdef
9.384bc 0.121abc 0.054a 5.109f 0.117cd 37.962c 0.253e 40.977e 0.648abc 0.382i 0.178de 0.168fg 0.133bcd
9.540ab 0.121abc 0.302a 4.928g 0.113def 37.515d 0.256e 41.369d 0.634c 0.416h 0.182cde 0.165g 0.136bc
9.625a 0.119bc 0.056a 4.750h 0.108fg 37.110e 0.261de 41.771c 0.627cd 0.451g 0.186bcd 0.170fg 0.143b
9.616a 0.118cd 0.056a 4.626i 0.104g 36.837f 0.256e 42.260b 0.641abc 0.487f 0.197b 0.177ef 0.158a
9.204c 0.120abc 0.054a 5.375b 0.125a 37.888c 0.272cde 40.602f 0.649abc 0.608e 0.191bc 0.179e 0.123ef
9.242c 0.118cd 0.056a 5.320bc 0.120bc 37.126e 0.294cd 41.123e 0.637bc 0.898d 0.212a 0.196d 0.125def
9.271c 0.115de 0.058a 5.259d 0.114de 36.347g 0.305bc 41.653c 0.630cd 1.192c 0.185cd 0.215c 0.129cde
9.293c 0.113e 0.059a 5.182e 0.109efg 35.497h 0.338ab 42.203b 0.605de 1.500b 0.193bc 0.228b 0.129cde
9.322bc 0.112e 0.062a 5.128ef 0.105g 34.723i 0.359a 42.719a 0.596e 1.796a 0.182cde 0.246a 0.134bcd
1)Means with different letters (a-k) in the same row are significantly different (P<0.05).
Table 7. Mean coordinate value of sesame oil and corn blend
oils (C05, C15, C25) by using scoreSample PC11) PC2 PC3
C25 C15 C05 Control
0.1397 -0.0374 -0.0931 -0.0049
-0.0334 -0.0812 -0.0174 0.1521
-0.0342 0.1038 -0.1151 0.0366
1)Means principal components of the obtained from NIR data of samples.
Table 8. Mean coordinate value of sesame oil and corn blend
oils (C10, C20) by using scoreSample PC11) PC2
C20 C10 Control
-0.0901 -0.0595 0.1387
-0.0986 0.1536 -0.0179
1)Means principal components of the obtained from NIR data of samples.
다. 반면 요오드가의 경우 옥수수기름을 혼합한 시료에 비해 콩기름을 혼합한 시료의 요오드가 변화가 더 급격히 발생하 였는데, 이는 콩기름의 요오드가가 참기름이나 옥수수기름 에 비해 높기 때문으로 보인다. 이러한 경향과 데이터를 축 적하여 혼합유의 종류 및 혼입량에 따라 산가와 요오드가의 변동이 생기는 것을 활용하면 참기름에 대한 품질 신뢰성을 높일 수 있을 것으로 판단된다.
지방산 조성
참기름, 옥수수기름, 콩기름의 주요 지방산은 linoleic acid, oleic acid, palmitic acid, stearic acid이다. 각 시료 에 대한 지방산 조성을 측정하여 주요 지방산 조성 및 기타 지방산 조성을 확인한 결과, 혼합유의 종류 및 혼합 비율에 따라 지방산 조성이 변하는 것을 확인할 수 있었다(Table 6). 그중 시료마다 linolenic acid와 cis-oleic acid 조성의 변화가 가장 두드러지게 나타나는 것을 확인하였다. Lin- olenic acid는 옥수수기름과 콩기름에 소량 함유되어 있고 제한규격이 없지만 참기름에서는 0.5% 이하로 관리하도록 되어 있으며, cis-oleic acid의 경우 주요 지방산이지만 제 한규격이 없다(22). 분석된 데이터를 토대로 cis-oleic acid 와 linolenic acid 함량 및 기타 지방산 조성 변화를 통해 참기름에 기타 식용유 혼입 여부를 간접적으로 확인할 수 있을 것으로 기대된다.
참기름과 혼합유 NIR
NIR을 이용한 각 시료의 스펙트럼 결과를 2차원 및 3차원
군집 모형도를 이용하여 분석하였으며, 시료 간 편차를 좀 더 명확히 보기 위해 혼합비가 10%씩 차이 나는 시료끼리 비교하였다. 옥수수기름이 혼합된 시료들은 5%, 15%, 25%
로 하나의 그룹으로, 10%와 20% 혼합된 시료를 다른 그룹 으로 나누어 비교하였다. 스펙트럼 특성 피크 분석 결과 1,600~1,800 nm와 2,100~2,200 nm에서 기름의 혼합 정 도에 따른 스펙트럼 변화를 확인할 수 있었으며, 이는 지방 산 조성의 변화에 의한 것임을 확인할 수 있었다(23,24).
참기름과 옥수수기름 혼합유 NIR 분석 결과로 score를 이
Fig. 1. 3-Dimension group figures of sesame oil and corn blend
oils (C05, C15, C25) by using score.Fig. 2. 3-Dimension group figures of sesame oil and corn blend
oils (C10, C20) by using score.0 0.05 0.1 0.15 0.2 0.25 0.3 0.35 0.4 0.45 0.5
800 1300 1800 2300
Wavelength (nm)
Reflectance .
C25 C20 C15 C10 C05 Control
Fig. 3. Original NIR spectra of sesame oil and corn blend oils.
Table 9. Mean coordinate value of sesame oil and soybean blend
oils (S05, S15, S25) by using scoreSample PC11) PC2 PC3 PC4
S25 S15 S05 Control
-0.0082 0.1326 -0.0989 -0.0188
0.1223 -0.0330 -0.0689 -0.0197
-0.0384 -0.0363 -0.0545 0.1366
0.0514 -0.0393 -0.0255 0.0179
Table 10. Mean coordinate value of sesame oil and soybean
blend oils (S10, S20) by using scoreSample PC11) PC2 PC3
S20 S10 Control
0.0876 -0.1450 -0.0320
0.0584 -0.1765 -0.0091
0.0726 -0.2360 0.0087
1)Means principal components of the obtained from NIR data of samples.
Fig. 4. 3-Dimension group figures of sesame oil and soybean
blend oils (S05, S15, S25) by using score.Fig. 5. 3-Dimension group figures of sesame oil and soybean
blend oils (S10, S20) by using score.0 0.05 0.1 0.15 0.2 0.25 0.3 0.35 0.4 0.45 0.5
800 1300 1800 2300
Wavelength (nm)
Reflectance .
S25 S20 S15 S10 S05 Control
Fig. 6. Original NIR spectra of sesame oil and soybean blend
oils.용한 군집 모형으로 확인한 결과, 혼합률이 10%씩 차이 나 는 시료 간의 군집 모형도에서 각 시료의 군집이 서로 겹치는 부분이 없어 NIR 데이터를 통해 각 시료가 정성적으로 다르 다는 것을 확인할 수 있었다(Table 7~8, Fig. 1~3). 옥수수 기름 혼합시료와는 달리 콩기름이 혼합된 시료의 NIR 스펙
트럼을 군집 모형도로 확인한 결과, 각 시료 간의 차이가 뚜 렷이 구분되지는 않는 것을 확인할 수 있었다(Table 9~10, Fig. 4~6).
요 약
참기름에 옥수수기름과 콩기름을 일정비율로 혼합하여 나 타나는 품질특성을 연구하였다. 차이식별검사, 색도, 산가, 요오드가, 지방산 조성 및 NIR을 이용하여 데이터를 분석해 보았다. 색도검사 결과 혼합률이 높아짐에 따라 L, a, b 값이 변하는 것을 확인할 수 있었으나, 혼합된 기름의 종류에 따 른 특이적인 변화는 확인할 수 없었다. 혼합률이 증가함에 따라 산가는 감소하였지만 혼합유 종류에 따른 차이는 확인 하기 어려웠다. 하지만 요오드가의 경우 혼합률에 따른 요오 드가 변화 및 혼합유 종류에 따른 요오드가 변화 정도를 확 인할 수 있었다. 지방산 조성 분석 결과, 혼합률의 변화와 혼합유의 종류에 따라 linolenic acid 및 특정 지방산 값이 확연히 변하는 것을 확인할 수 있었다. NIR 분석은 다른 분 석방법들에 비해 빠른 시간 안에 분석이 완료되었고, 옥수수 기름의 혼합률 변화에 따른 스펙트럼에는 시료 간 차이가 확인되었으나, 콩기름 혼합유 시료에 대해서는 시료 간 차이 가 뚜렷하지 않았다. 결론적으로 참기름의 품질특성을 확인 해 소비자의 먹거리 신뢰도를 향상시키기 위해서는 여러 가 지 분석방법을 이용한 데이터의 축적이 선행되어야 할 것으 로 판단되며, 추가적인 연구를 통해 이를 활용할 수 있는 방안이 마련될 것으로 기대된다.
REFERENCES
1. “Nutrition Facts for sesame oil per 100 g, analysis of fats and fatty acids”. Conde Nast for the USDA National Nutrient Database. http://nutritiondata.self.com/facts/fats-and-oils/511/2 (accessed Dec 2016).
2. Seo HY, Ha J, Shin DB, Shim SL, No KM, Kim KS, Lee KB, Han SB. 2010. Detection of corn oil in adulterated ses- ame oil by chromatography and carbon isotope analysis. J
Am Oil Chem Soc 87: 621-626.
3. Vlahov G, Shaw AD, Kell DB. 1999. Use of 13C nuclear magnetic resonance distortionless enhancement by polar- ization transfer pulse sequence and multivariate analysis to discriminate olive oil cultivars. J Am Oil Chem Soc 76: 1223- 1231.
4. Sinelli N, Casale M, Di Egidio V, Oliveri P, Bassi D, Tura D, Casiraghi E. 2010. Varietal discrimination of extra virgin olive oils by near and mid infrared spectroscopy. Food Res
Int 43: 2126-2131.
5. Guimet F, Ferre J, Boque R. 2005. Rapid detection of olive- pomace oil adulteration in extra virgin olive oils from the protected denomination of origin “Siurana” using excitation emission-fluorescence spectroscopy and three-way methods of analysis. Anal Chim Acta 544: 143-152.
6. Cabrera-Vique C, Bouzas PR, Oliveras-López MJ. 2012.
Determination of trace elements in extra virgin olive oils:
A pilot study on the geographical characterisation. Food
Chem 134: 434-439.
7. Gonzálvez A, Armenta S, Pastor A, de la Guardia M. 2008.
Searching the most appropriate sample pretreatment for the
elemental analysis of wines by inductively coupled plasma- based techniques. J Agric Food Chem 56: 4943-4954.
8. Cunha SC, Oliveira MBPP. 2006. Discrimination of vegeta- ble oils by triacylglycerols evaluation of profile using HPLC/
ELSD. Food Chem 95: 518-524.
9. Jeon H, Kim IH, Lee C, Choi HD, Kim BH, Akoh CC.
2013. Discrimination of origin of sesame oils using fatty acid and lignan profiles in combination with canonical dis- criminant analysis. J Am Oil Chem Soc 90: 337-347.
10. Bazakos C, Dulger AO, Uncu AT, Spaniolas S, Spano T, Kalaitzis P. 2012. A SNP-based PCR-RFLP capillary elec- trophoresis analysis for the identification of the varietal ori- gin of olive oils. Food Chem 134: 2411-2418.
11. Guadarrama A, Rodríguez-Méndez ML, Sanz C, Rios JL, de Saja JA. 2001. Electronic nose based on conducting poly- mers for the quality control of the olive oil aroma: Discrimi- nation of quality, variety of olive and geographic origin
Anal Chim Acta 432: 283-292.
12. Park YC, Kim MR, Lim JY, Park YE, Shin JH, Hwang CR, Lim JD, Kim KH, Lee JH, Cho TY, Lee HJ, Han SB. 2012.
A comparison of gene extraction methods for the identi- fication of raw materials from processed meat products. J
Fd Hyg Safety 27: 146-151.
13. Choi JY, Bang KH, Han KY, Noh BS. 2012. Discrimination analysis of the geographical origin of foods. Korean J Food
Sci Technol 44: 503-525.
14. Bertran E, Blanco M, Coello J, Iturriage H, Maspoch S, Montoliu I. 2000. Near infrared spectrometry and pattern recognition as screening methods for the authentication of virgin olive oils of very close geographical origins. J Near
Infrared Spec 8: 45-52.
15. Takamura H, Hyakumoto N, Endo N, Matoba T, Nishiike T. 1995. Determination of lipid oxidation in edible oils by near infrared spectroscopy. J Near Infrared Spec 3: 219- 225.
16. Jaeho Ha, Koo M, Ok H. 1998. Determination of the con- stituents of sesame oil by near infrared spectroscopy. J Near
Infrared Spec 6: 371-373.
17. Yoo YC, Park YS, Chung HS, Jeoung JI. 1992. Determina- tion of the adulteration of sesame oils sold in markets by gas chromatography. Kor J Food Hygiene 7: 29-36.
18. Shin JA, Lee KT. 2005. Discrimination of sesame oils from imported seeds and their blended ones using electronic-nose system. Korean J Food Sci Technol 37: 856-860.
19. Ser JH, Chung YH, Lee GD, Kwon JH. 1998. Comparison of physicochemical properties and oxidative stability of ses- ame oil mixed with corn oil. J Fd Hyg Safety 3: 24-28.
20. Kang CH, Park JK, Park JU, Chun SS, Lee SC, Ha JU, Hwang YI. 2002. Comparative studies on the fatty acid composition of Korean and Chinese sesame oils and adul- terated sesame oils with commercial edible oils. J Korean
Soc Food Sci Nutr 31: 17-20.
21. Ministry of Food and Drug Safety. 2012. Korean Food Stand-
ards Codex. Cheongju, Korea. Vol 2, p 48-62.
22. Ministry of Food and Drug Safety. 2012. Korean Food
Standards Codex. Cheongju, Korea. Vol 1, p 86.
23. Chung HI, Kim HJ. 2000. Near-infrared spectroscopy: prin- ciples. Anal Sci Technol 13: 1A-14A.
24. Sato T, Kawano S, Iwamoto M. 1991. Near infrared spectral patterns of fatty acid analysis from fats and oils. J Am Oil