https://doi.org/10.7848/ksgpc.2017.35.5.349
Investigation of Topographic Characteristics of Parcels Using UAV and Machine Learning
Lee, Chang Han
1)·Hong, Il Young
2)Abstract
In this study, we propose a method to investigate topographic characteristics by applying machine learning which is an artificial intelligence analysis method based on the spatial data constructed using UAV and the training data created through spatial analysis. This method provides an alternative to the subjective judgment and accuracy of spatial data, which is a problem of existing topographic characteristics survey for officially assessed land price. The analysis method of this study is expected to improve the problems of topographic characteristics survey method of existing field researchers and contribute to more accurate decision of officially assessed land price by providing more objective land survey method.
Keywords : Unmanned Aerial Vehicle, Machine Learning, Spatial Analysis, Topographical Characteristics Original article
Received 2017. 09. 25, Revised 2017. 10. 16, Accepted 2017. 10. 27
1) Member, Dept of GIS Engineering, Namseoul University (E-mail: [email protected])
2) Corresponding Author, Member, Dept of GIS Engineering, Namseoul University (E-mail: [email protected])
This is an Open Access article distributed under the terms of the Creative Commons Attribution Non-Commercial License (http://
1. Introduction
Since the introduction of the officially assessed land price, the land price is estimated by analyzing the characteristics by assessing items. The existing topographic characteristics survey has a problem that objectivity is deteriorated by visiting the parcels and determining through the visual characteristics of the investigator(Lee, 2012). This is caused by subjective judgment at the time of field survey without an instrument or analysis tool. In order to secure objectivity, there have been attempts to apply GIS techniques to the analysis of topographical characteristics(Jung et al., 2015). It is a method to construct the data using the digital topographic map provided by NGII(National Geographic Information Institute) and to investigate the topographic characteristics using the spatial analysis technique.
In recent years, UAV(Unmanned Aerial Vehicle) have become widely used as a tool for on-site surveying. In the case
of surveying with UAV, it has an advantage of securing highly accurate spatial information and immediately reflecting changes in the field. UAV is capable of rapidly constructing topographical data on site and making it possible to build more precise and accurate data compared to existing digital maps. In addition, Machine Learning, which has recently emerged as an artificial intelligence analysis method, has been used in various fields while enabling objective decision making based on training dataset(Shin and Kim, 2016; Song et al., 2016). This method of analysis extends automated applications as an alternative to human decision making.
In this study, we proposed a method to investigate
topographic characteristics by applying machine learning
which is an artificial intelligence analysis method composed
of training data and measurement results using UAV. This
method provides a solution to the subjective judgment and
the accuracy of the spatial data, which is a problem of the
existing topographic survey for the public land price decision.
Through the case study, the topographical characteristics data were collected using the low-cost UAV, Phantom 3, the training dataset was constructed through the spatial analysis using ArcGIS, and the machine learning analysis tool, TensorFlow was applied for objective decision making.
The analytical method of this study is expected to contribute to more accurate estimation of the public land price in the future by improving the problem of survey method of land characteristics of existing field investigators by providing more objective land survey method.
2. Methodology
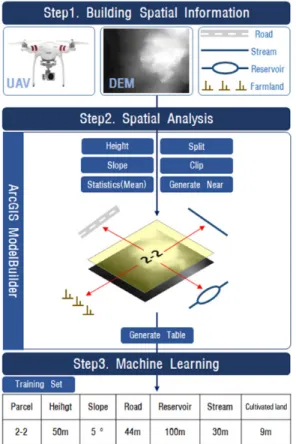
The purpose of this study is to propose a survey method of topographical characteristics among the assessing items of the officially assessed land price. The survey method consists of three stages. The first stage is the data collection using an UAV and construction of spatial information. The
second stage is to generate the training dataset using spatial analysis technique and the third stage is to the presentation of assessed results using machine learning. Fig. 1 presents the process and methodology that are used for this study.
First, the spatial information collections consists of the process of aerial photogrammetry using an UAV. We used DJI Phantom 3 as the unmanned aircraft and Pix4D pro was used to process the captured images. The DSM(Digital Surface Model) created by Pix4D pro was constructed by using the ATIN algorithm in the TerraScan program to classify the ground surface and the non-surface into a DEM(Digital Elevation Model).
Second, ArcGIS tools and ModelBuilder were used for spatial analysis for building the training dataset using collected spatial data from the previous stage(Allen, 2011). The spatial characteristics of the parcels were analyzed through the spatial analysis model and the characteristics of the parcels were tested by applying the machine learning method based on the results of this analysis. In order to investigate the topographic characteristics by machine learning, it is necessary to distinguish independent variables from dependent variables.
The dependent variable used the results of the survey of the topographic characteristics of the parcels made by field survey method. The independent variables are variables that can explain the topographic characteristics of the parcel, which is the relationship between elevation, slope, and features.
The relationship between the independent variables, the
Fig. 1. Methodology of topographic characteristics survey Fig. 2. Process of spatial analysis
Surver of elevation and slope
Generate near feature
topographic features, is the shortest distance between the parcels and features, and the features include the main road, reservoir, stream, and cultivated land. Elevation and slope are known to be important parameters for surveying the topographic of area by many researchers(Weiss, 2001). The main road of the land feature was used as an efficient way to acquire the topographic characteristics of the parcels(Lee, 2012), and the reservoir, stream. The following Fig. 2 shows the process of constructing survey values of the topographic characteristics of the parcels using the elevation and slope of the parcels and the nearby features.
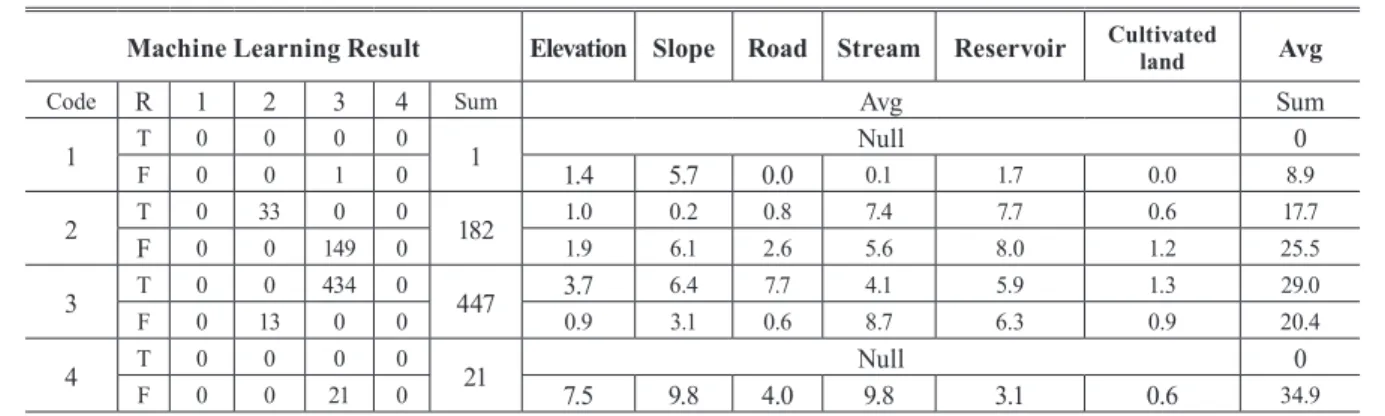
The third step is to construct a model that automatically classifies the topographic features using the training data constructed through spatial analysis. We constructed a model to distinguish multiple classes using multi-variable, and used TensorFlow, a python-based machine learning library. TensorFlow is the machine learning library, available in Google's open source format since 2015, and has been successfully used in areas such as image and speech recognition(Abadi et al., 2016). The TensorFlow provides a specialized feature for computing the multidimensional array of nodes and edges in the form of graphs of data flow.
TensorFlow have the advantage of graphical representation of the flow of data, various computational structures, and python-based interoperability.
3. Spatial Bata Acquisition Using UAV
The study area is shown in Fig. 3(a) and there are some
areas including Doheung-ri and Haam-ri in Asan-si. Forest, farmland, village, and stream are distributed in this area and have various topographic characteristics. The field survey results of the study area were classified as low land, flat land, mild slope, steep slope, which indicate the topographic characteristics of the parcels and there are total 719 parcels which is including with 1 parcel of low land, 182 parcels of flat, 448 parcels of mild slope, 22 parcels of steep slope and 66 parcels such as roads and rivers that do not require survey(See Table 1). In order to investigate the topographic characteristics of the parcel units, the digital cadastral maps were used.
In this study, Phantom3, developed by DJI of China, was used as a rotary wing UAV for the collection of high- resolution spatial data. The UAV images are constructed to DSM in the photogrammetry method.
The accuracy of the position and height of the constructed information is confirmed by the VRS(Virtual Reference
Topographic
characteristics Code Count
Low land 1 1
Flat land 2 182
Mild slope 3 448
Steep slope 4 22
Except research - 66
Total - 719
Table 1. Result of field survey
(a) Satellite image (b) Digital cadastral map (c) Points of VRS survey
Fig. 3. Study area(Asan-si)
Station), which is the virtual reference point system in Network-RTK(Real Time Kinematic), as the check point(Park and Lee, 2016). The equipment used for the VRS survey is a mobile phone that receives GPS information from Trimble R and the observatory, and the location accuracy of the survey is 2-5 cm(See Table 2.).
The study area is about 1.2km and 0.9km(width and height). The details of the images taken in the study area are shown in Fig. 3(c). Fourteen GCP(Ground Control Points) were used before 3D model and DSM modeling by unmanned aerial photogrammetry. Ten checkpoints were selected for
accuracy evaluation.
We shot the image with using UAV and surveyed the ground reference point with VRS in order to make DSM which can make the DEM. We use the Pix4D pro, photogrammetry software, to adjust the position of the UAV's image and ground reference point. The total images captured by UAV was 622 images, and the aerotriangulation was used after the interior orientation of the camera of the UAV in the Table 3(Kim et al., 2017). As a result of the unmanned aerial photogrammetry, 0.187 pixel and 0.248m of Z error were found on average.
DSM produced by photogrammetry software is a model that include terrain and features such as buildings, trees, etc.
This model is not suitable for surveying topographic features and should be converted to the DEM. This is because DSM has characteristics of artificial and topographical feature and we need to create a DEM that has only topographic features.
TerraScan of Terrssolid Inc., commercial software, Adaptive TIN(ATIN), which is a software algorithm, was used to classify the surface and non-artificial surface areas, and point cloud data of the DSM was used. As a result of comparing ATIN algorithm with other algorithms, qualitative and quantitative results can be used regardless of regional characteristics(Kim and Cho, 2012).
In the study area, the maximum size of the bottom of the building is 50m, the maximum slope is 88 degree close to the slope of the general building and the ground, the angle threshold is 5.5 degree and the distance threshold is 1 m. Non- surface point cloud data removed artificial surface is las2dem of Lastool provided as open source, reads LAS formatted file
Survey method Network-RTK(VRS)
Satellite transmitters Trimble R8(GPS) Satellite count More than five satellite
The coordinate system KGD2002
Regular observatory Cheonan
Accuracy 2-5cm
Table 2. Dataset for survey information
Drone Phantom3 professional
Camera DJI(FC300X)
Image size 4,000 × 3,000(pixel)
Flying height 100m
Over lap End overlap(80%)
×Side lap(70%)
Ground sampling distance 4.5cm
Image count 622 images
Table 3. Dataset for drone information
(a) DSM (b) Ground Points (c) DEM
Fig. 4. Process of generate DEM
and constructs delaunay triangular by irregular triangular network algorithm to generate DEM as shown in Fig. 4(c).
4. Spatial Analysis
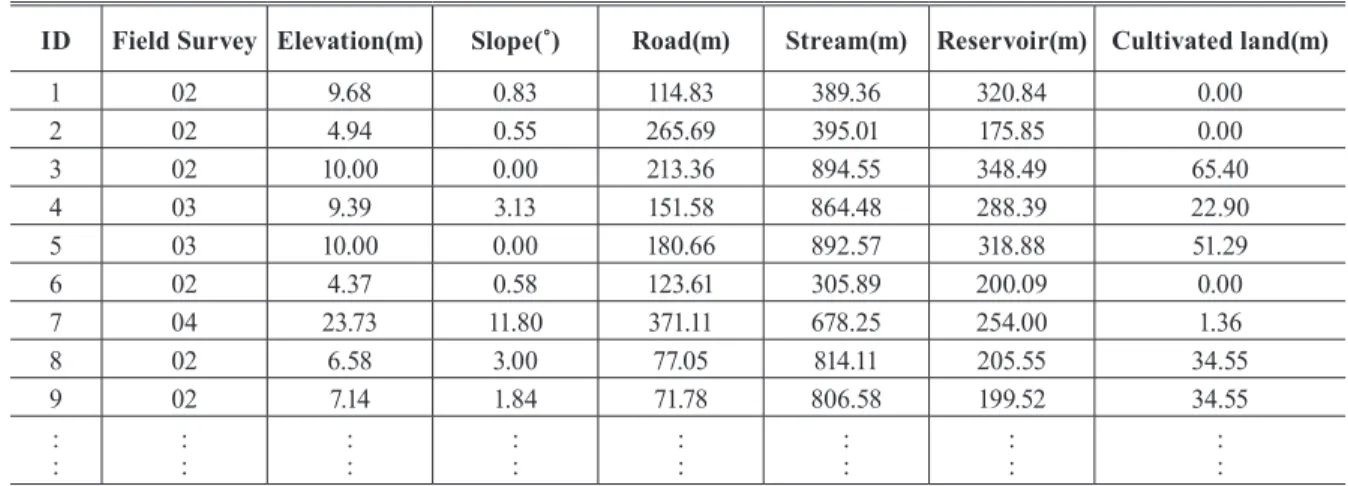
DEM was generated by the unmanned aerial photogrammetry method and spatial information such as road, reservoir, stream, cultivated land, and digital cadastral map were used in the national map. Table 4 shows the spatial information required for the analysis. In the digital cadastral map, a parcel is analyzed to the elevation and slope of the parcels in the DEM, and the shortest distance between the parcels and the features.
In order to analyze on the basis of parcels with the digital cadastral map, the parcels in the study area should be divided into one unit. In order to divide 719 parcels into individual parcels, a 19-digit PNU(Parcel Unique Number) field, which is the unique number of parcels, is used.
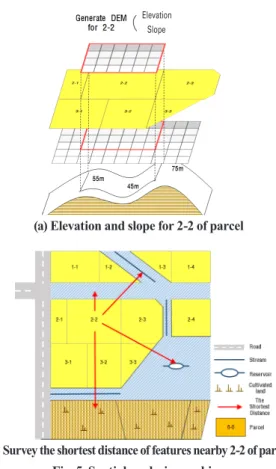
As shown in Fig. 5(a), the 2-2 survey parcel is used to obtain elevation and slope of parcels through DEM. The grid size of the DEM is 1m and considering the capacity and accuracy of spatial information. The representative values of the elevation and slope of the parcel is averaged value of elevation and slope values in the parcel, because they can represent the overall elevation and slope of the parcels. In order to use the information of the DEM and slope model as the parcel, the raster is converted into the raster to point tool and the 2-2 parcel elevation and slope average values was calculated by the summary statistics tool. The slope model
is analyzed by the slope tool with neighborhood algorithm and the algorithm is used where the slope is expressed as smooth curves through averaging instead of expressing slope as steep slope(Zhou and Liu, 2004; Ko et al., 2014; Lee and Sung, 2016).
As shown in Fig. 5(b), the shortest distance relation between features of the 2-2 survey parcel is constructed by clipping the spatial information of the digital topographic map and using it as data that can be used in the study area. The range of the constructed feature data is set to the inhabitant area, which is a higher administrative unit than the study area. Generate Near, which is the analysis tool, calculates the shortest distance between a feature and a parcel.
Table 5 below shows the learning materials used for machine learning. The topographic characteristics such as elevation and slope of the parcels and distance variables with road, reservoir, stream, cultivated land are used for the independent variable and the results of field survey were used as dependent variable.
Table 4. Spatial data information
Source Data Use
UAV DSM DEM Elevation
Slope National
Geographic Information Institute
Digital map
Road
The shortest distance Reservoir
Stream Cultivated land Ministry of Land,
Infrastructure, and Transport
Digital cadastral
map Parcels (a) Elevation and slope for 2-2 of parcel
(b) Survey the shortest distance of features nearby 2-2 of parcell Fig. 5. Spatial analysis graphing
Elevation Slope