pISSN 1738-3544 eISSN 2288-1662
Comparison of the Serum Gamma-Glutamyl Transferase and Serum Uric Acid Levels according to the Obesity
Types Based upon on the Body Mass Index in Korean Men
Kyung A Shin
Department of Clinical Laboratory Science, Shinsung University, Dangjin, Korea
성인 남성에서 체질량지수로 분류한 비만 유형에 따른 혈청 감마 글루타밀 전이효소와 혈청 요산농도의 차이 비교
신경아
신성대학교 임상병리과
This study examined the relationship between the serum GGT (gamma-glutamyl transferase) and uric acid level in obese male adults. A total of 14,283 adult males aged 20 years or more, who visited the health examination center of Gyeonggi Regional General Hospital from January 2017 to August 2018 and underwent a physical examination, were enrolled in this study. The obesity criteria were defined by the Asia-Pacific regional standards. Abdominal obesity was defined as a male waist circumference of more than 90 cm. An increase in the serum uric acid and serum CGT levels of the male subjects was defined as 7.0 mg/dL or more and 56 IU/L or more, respectively.
The results showed that the serum GGT and uric acid levels were higher in the overweight and obese groups than in the normal weight group. In the obese group, the serum GGT and uric acid were significantly higher in the patients with abdominal obesity. On the other hand, there was no difference compared to the low body weight group. The overweight and obesity groups showed a higher risk of elevated serum GGT and hyperuricemia than the normal weight group, but a low body weight did not affect the serum GGT elevation and hyperuricemia. Overall, the serum GGT and uric acid levels are useful for evaluating overweight and obesity in adult males.
Key words: Body mass index, Gamma-glutamyl transferase, Obesity, Uric acid
Corresponding author: Kyung A Shin Department of Clinical Laboratory Science, Shinsung University, 1 Daehak-ro, Jeongmi-myeon, Dangjin 31801, Korea Tel: 82-41-350-1408
Fax: 82-41-350-1355 E-mail: [email protected]
ORCID: https://orcid.org/0000-0001-5266-5627
This is an Open Access article distributed under the terms of the Creative Commons Attribution Non-Commercial License (http://creativecommons.org/licenses/by-nc/4.0) which permits unrestricted non-commercial use, distribution, and reproduction in any medium, provided the original work is properly cited.
Copyright © 2019 The Korean Society for Clinical Laboratory Science. All rights reserved.
Received: November 8, 2018 Revised : November 27, 2018 Accepted: December 2, 2018
서 론
간에서 유래된 혈청 GGT (gamma-glutamyl transferase) 는 간담도계 질환 또는 과도한 알코올 섭취의 임상적 지표로 사 용되어 왔으나, 최근 여러 연구에서 제2형 당뇨병, 고혈압, 이상 지질혈증을 비롯한 심혈관 질환 및 대사성 질환과의 연관성이 제시되고 있다[1]. 또한 GGT는 산화적 스트레스의 민감한 지표
이며, 체지방과 밀접한 관련이 있다[2, 3]. 비만은 만성염증 상 태로 간주되며, 만성염증은 미토콘드리아로부터 활성산소 (reactive oxygen species)를 방출하여 산화적 스트레스를 유 발한다[4, 5]. 또한 체지방 증가는 간에 지방축적을 촉진하고 간 에서의 인슐린 감수성을 손상시켜, 결국은 전신에 인슐린 저항 성을 유도한다[2]. 따라서 비만은 잠재적인 항산화 방어기전에 중요한 역할을 하는 혈청 GGT의 증가를 촉진한다[6].
혈청 요산은 인간에서 크산틴 산화효소(xanthine oxidase), 크산틴 탈수소효소(xanthine dehydrogenase)에 의해 히포크 산틴(hypoxanthine)과 크산틴(xanthine)이 산화되어 생성되 고 퓨린 염기(adenine, guanine)의 최종 대사산물이며, 전통적 으로 고요산혈증은 통풍의 원인으로 알려져 있다[7]. 그러나 최 근의 역학연구에 따르면 혈청 요산농도는 대사증후군 및 심혈 관 질환의 유병율과 관계가 있음이 입증되었다[8-10]. 요산은 산화 질소(nitric oxide)의 생체 이용률을 억제하고 내피기능에 부정적인 영향을 줄 수 있다고 보고된다[11]. 또한 시험관내 연 구에서 고요산혈증은 지방세포에서 산화환원 의존성 신호 (redox-dependent signaling) 및 산화적 스트레스를 유발하 였다[12].
이와 같이 GGT와 요산은 모두 산화 스트레스와 관련이 있으 며, 대사증후군 진단기준에 속하지 않지만 심혈관 위험요소와 의 관련성이 보고되었다[8-10]. 그러나 아직까지 GGT와 요산 의 증가가 비만과 관련이 있음을 시사하는 결과들은 있으나 독 립적인 위험요인이라는 데에는 이견이 있으며, 그에 대한 기전 도 명확하게 밝혀지지 않았다. 또한 마른 체형일지라도 내장지 방이 발달한 경우 간의 지방변성 및 인슐린 감수성이 감소하는 것으로 알려져 있다[13, 14]. 그러나 선행연구들은 비만군에서 의 GGT와 요산농도의 차이를 확인한 연구가 주를 이루고 있으 며, 정상군과 비교해 비만군뿐 아니라 저체중과 과체중군에서 의 GGT와 요산농도의 관련성에 대해서는 알려진 바가 거의 없 다. 또한 비만일지라도 복부비만의 동반 유무에 따른 GGT와 요 산농도에 차이를 비교한 연구는 거의 없다. 따라서 본 연구는 성 인 남성을 대상으로 체질량지수로 분류한 저체중군, 정상체중 군, 과체중군, 비만군의 비만 유형, 복부비만 동반 유무에 따른 혈청 GGT와 요산농도의 차이와 관련성을 확인하여 비만의 조 기 예방 및 치료를 위한 과학적 근거를 제공하고자 하였다.
대상 및 방법
1. 연구대상
2017년 1월부터 2018년 8월까지 경기도내 종합병원 건강검 진센터에서 종합건강검진을 받았던 20세 이상 성인 남성을 대 상으로 하였다. 건강검진 자기 기입식 질문지를 바탕으로 설문 작성하여 간질환이나 통풍질환의 병력자, HBs Ag 또는 Anti- HCV Ab 양성자, 신체계측 및 혈액검사상 결측치를 포함하는 대상자, 질문지 기록이 미비한 경우를 제외한 최종 분석 대상자 는 14,283명이었다. 본 연구는 경기도내 종합병원 생명윤리심 의위원회의 승인을 받아 진행되었다(IRB No: SP-2018-14-
019-128).
2. 연구방법
1) 신체계측 및 혈액검사
신장과 체중은 생체 임피던스를 이용한 Inbody 720 (Bio- space Co., Seoul, Korea) 체성분 분석기로 측정하였다. 몸무 게(kg)를 키(m2)으로 나눠서 체질량지수(body mass index, BMI)를 계산하였다. 허리둘레는 양발을 25∼30 cm 정도 벌리 고 숨을 내쉰 상태에서 갈비뼈 가장 아래 위치와 골반의 가장 높 은 위치의 중간지점인 가장 좁은 부분을 줄자로 측정하였다. 혈 압은 10분가량 안정상태를 유지한 후 2회 반복 측정하여 평균 값을 결과로 제시하였으며, 아네로이드 혈압계(Medisave UK Ltd., Weymouth, UK)로 측정하였다. 혈액분석은 8시간 이상 공복상태에서 오전에 채혈하여 검사하였다. 혈액분석 항목 중 총콜레스테롤, 중성지방, HDL (high density lipoprotein, HDL)-콜레스테롤, LDL (low density lipoprotein, LDL)-콜레 스테롤, 공복혈당, 요산, AST (aspartate aminotransferase), ALT (alanine aminotransferase), GGT, 고감도 C-반응성단백 (high sensitivity C-reactive protein, hs-CRP)은 TBA-2000FR NEO 자동분석기(Toshiba, Tokyo, Japan)로 분석하였으며, 당 화혈색소(hemoglobin A1c, HbA1c)는 Variant II (Bio Rad, CA, USA)로 측정하였다. 또한 인슐린은 Roche Modular Analytics E170 (Roche, Mannheim, Germany)으로 분석하 였다.
2) 비만 진단기준 및 분류
비만 기준은 2000년 제정된 아시아-태평양지역 기준을 적용 하여 체질량지수가 18.5 kg/m2 미만인 경우 저체중(N=199), 18.5∼22.9 kg/m2이면 정상(N=3,055), 23∼24.9 kg/m2이면 과체중(N=3,906), 25 kg/m2 이상인 경우 비만(N=7,123)으로 분류하였다[15]. 복부비만은 남성의 허리둘레 90 cm이상을 기 준치로 정의하였다[15]. 남성 대상자의 혈청 요산농도 상승은 7.0 mg/dL 이상[16], 혈청 GGT 상승은 56 IU/L 이상으로 정의 하였다[17].
3. 통계분석
이 연구는 IBM SPSS Statistics 24.0 (IBM, NY, USA)로 통계 분석을 실시하였으며, P<0.05의 경우 통계적으로 유의하다고 판정하였다. 체질량지수로 분류한 비만 유형에 따른 인체측정 및 생화학적 지표, 특히 혈청 GGT와 요산수치의 차이는 일원변 량분석(one-way ANOVA)을 통해 비교하였으며, 네 집단간 차
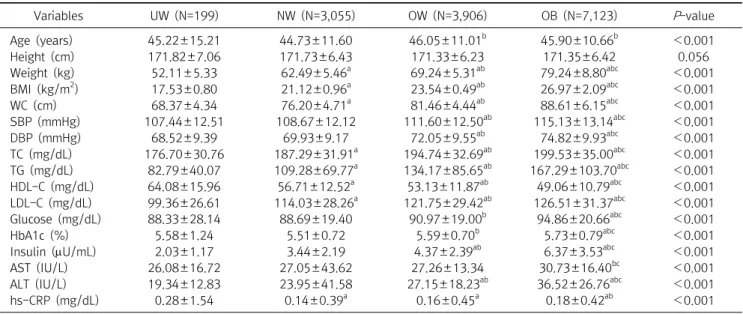
Table 1. Anthropometric and biochemical characteristics of the study subjects according to obesity types
Variables UW (N=199) NW (N=3,055) OW (N=3,906) OB (N=7,123) P-value
Age (years) 45.22±15.21 44.73±11.60 46.05±11.01b 45.90±10.66b <0.001
Height (cm) 171.82±7.06 171.73±6.43 171.33±6.23 171.35±6.42 0.056
Weight (kg) 52.11±5.33 62.49±5.46a 69.24±5.31ab 79.24±8.80abc <0.001
BMI (kg/m2) 17.53±0.80 21.12±0.96a 23.54±0.49ab 26.97±2.09abc <0.001
WC (cm) 68.37±4.34 76.20±4.71a 81.46±4.44ab 88.61±6.15abc <0.001
SBP (mmHg) 107.44±12.51 108.67±12.12 111.60±12.50ab 115.13±13.14abc <0.001
DBP (mmHg) 68.52±9.39 69.93±9.17 72.05±9.55ab 74.82±9.93abc <0.001
TC (mg/dL) 176.70±30.76 187.29±31.91a 194.74±32.69ab 199.53±35.00abc <0.001
TG (mg/dL) 82.79±40.07 109.28±69.77a 134.17±85.65ab 167.29±103.70abc <0.001
HDL-C (mg/dL) 64.08±15.96 56.71±12.52a 53.13±11.87ab 49.06±10.79abc <0.001
LDL-C (mg/dL) 99.36±26.61 114.03±28.26a 121.75±29.42ab 126.51±31.37abc <0.001
Glucose (mg/dL) 88.33±28.14 88.69±19.40 90.97±19.00b 94.86±20.66abc <0.001
HbA1c (%) 5.58±1.24 5.51±0.72 5.59±0.70b 5.73±0.79abc <0.001
Insulin (U/mL) 2.03±1.17 3.44±2.19 4.37±2.39ab 6.37±3.53abc <0.001
AST (IU/L) 26.08±16.72 27.05±43.62 27.26±13.34 30.73±16.40bc <0.001
ALT (IU/L) 19.34±12.83 23.95±41.58 27.15±18.23ab 36.52±26.76abc <0.001
hs-CRP (mg/dL) 0.28±1.54 0.14±0.39a 0.16±0.45a 0.18±0.42ab <0.001
Values are presented as means±standard deviations; a, significantly different from the UW; b, significantly different from NW; c, significantly different from OW; UW, underweight; NW, normal weight; OW, overweigh; OB, obesity; BMI, body mass index; WC, waist circumference; SBP, systolic blood pressure; DBP, diastolic blood pressure; TC, total cholesterol; TG, triglyceride; HDL-C, high density lipoprotein cholesterol; LDL-C, low density lipoprotein cholesterol; HbA1c, hemoglobin A1c; AST, aspartate aminotransferase; ALT, alanine aminotransferase; hs-CRP, high sensitivity C-reactive protein.
이가 있는 경우 사후검정 방법으로 Scheffe 법을 사용하였다.
비만 유형별 복부비만 동반 유무에 따른 집단간 혈청 GGT와 요 산수치의 차이를 비교하기 위해 독립표본 t-검정(independent sample t-test)을 실시하였다. 위의 분석결과는 모두 평균±표 준편차로 제시하였다. 또한 비만 유형에 따른 고요산혈증과 GGT 상승의 발병위험을 예측하기 위해 혈청 GGT와 요산농도 상승에 영향을 미칠 수 있는 연령, 혈압, HDL-콜레스테롤, LDL-콜레스테롤, 총콜레스테롤, 중성지방, 공복혈당을 보정한 후 로지스틱 회귀분석(logistic regression)을 시행하여 교차비 (odds ratio)를 구하였다. 보정방법은 관심 독립변수와 함께 보 정하는 변수를 독립변수로 고려하여 분석하였다.
결 과
1. 비만 유형에 따른 대상자의 인체측정 및 생화학적 지표의 차이
체질량지수로 분류한 비만 유형별 대상자의 인체측정 및 생 화학적 지표의 차이는 Table 1과 같다. 연령은 정상체중군보다 과체중과 비만군에서 높았다(P<0.001). 대상자의 인체측정학 적 변인으로 체중, BMI, 허리둘레는 저체중군에서 비만군으로 진행할수록 점진적인 증가를 보였다(각각 P<0.001). 수축기와 이완기 혈압은 저체중군과 정상체중군보다 과체중과 비만군에 서 높았으며, 비만군은 과체중군보다 높았다(모두 P<0.001).
생화학적 지표인 총콜레스테롤, 중성지방, LDL-콜레스테롤은 저체중군에서 비만군으로 진행할수록 점진적으로 증가하였다 (각각 P<0.001). 공복혈당과 HbA1c는 정상체중군보다 과체 중과 비만군에서 높았으며, 비만군은 저체중과 과체중군보다 높았다(각각 P<0.001). 인슐린은 저체중과 정상체중군보다 과 체중과 비만군에서 높았으며, 비만군은 과체중군보다 높았다(P
<0.001). AST는 정상체중군과 과체중군보다 비만군에서 높게 나타났다(P<0.001). ALT는 정상체중군과 과체중군보다 비만 군에서 높았으며, 비만군은 과체중군보다 높았다(P<0.001).
hs-CRP는 저체중군보다 정상체중군과 과체중, 비만군에서 높 았으며, 비만군은 정상체중군보다 높았다(P<0.001). 또한 HDL-콜레스테롤은 저체중군에서 비만군으로 진행할수록 점 진적인 감소를 보였다(P<0.001). 비만 유형에 따른 GGT의 차 이를 확인한 결과 정상체중군보다 과체중과 비만군에서 높게 나타났으며, 비만군은 저체중과 과체중군보다 높았다(P<0.001) (Figure 1). 요산농도는 저체중군에서 비만군으로 진행할수록 비례하여 증가하였다(P<0.001) (Figure 2).
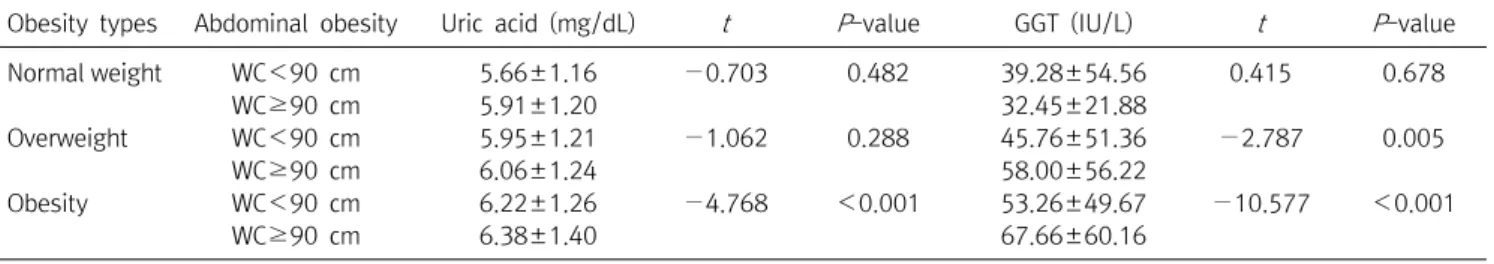
2. 비만 유형별 복부비만 동반 유무에 따른 혈청 GGT 및 요산농도의 차이
비만 유형별 복부비만 동반 유무에 따른 혈청 GGT와 요산농 도의 차이는 Table 2와 같다. 정상체중군은 복부비만 유무에 따 른 혈청 GGT와 요산농도에 차이가 없었다. 과체중군에서 복부
Figure 2. Differences in uric acid according to the obesity types (one-way ANOVA, error bars represent±SD). UW (5.32±1.31), NW (5.66±1.16), OW (5.95±1.21), OB (6.28±1.32). a, significantly different from the UW; b, significantly different from NW; c, significantly different from OW. Abbreviations: See Table 1.
Figure 1. Differences in GGT according to the obesity types (one- way ANOVA, error bars represent±SD). UW (41.41±79.99), NW (39.25±54.48), OW (46.21±51.59), OB (58.95±54.54). a, signi- ficantly different from the UW; b, significantly different from NW;
c, significantly different from OW. Abbreviations: See Table 1; GGT, gamma-glutamyl transferase.
Table 3. Odds ratio (95% CI) for the elevated serum gamma-glutamyl transferase according to the obesity type
Obesity types Unadjusted (95% CI) P-value Adjusted (95% CI) P-value
Normal weight 1 1
Underweight 0.772 (0.494∼1.207) 0.256 0.808 (0.503∼1.299) 0.379
Overweight 1.582 (1.394∼1.795) <0.001 1.354 (1.180∼1.553) <0.001
Obesity 3.239 (2.896∼3.622) <0.001 2.313 (2.039∼2.625) <0.001
Adjusted odds ratios for age, blood pressure, HDL-cholesterol, LDL-cholesterol, total cholesterol, glucose, triglyceride.
Abbreviations: ORs, odds ratio; CI, confidence interval.
Table 2. Differences in serum GGT and uric acid levels with or without abdominal obesity by types of obesity
Obesity types Abdominal obesity Uric acid (mg/dL) t P-value GGT (IU/L) t P-value
Normal weight WC<90 cm 5.66±1.16 −0.703 0.482 39.28±54.56 0.415 0.678
WC≥90 cm 5.91±1.20 32.45±21.88
Overweight WC<90 cm 5.95±1.21 −1.062 0.288 45.76±51.36 −2.787 0.005
WC≥90 cm 6.06±1.24 58.00±56.22
Obesity WC<90 cm 6.22±1.26 −4.768 <0.001 53.26±49.67 −10.577 <0.001
WC≥90 cm 6.38±1.40 67.66±60.16
Abbreviations: GGT, gamma-glutamyl transferase; WC, waist circumference.
비만 동반 유무에 따른 혈청 요산농도는 차이가 없었으나, 혈청 GGT는 과체중군에서 복부비만을 동반한 경우 유의하게 높았 다(45.76±51.36 IU/L vs 58.00±56.22 IU/L, P=0.005). 또한 비만군은 복부비만을 동반한 경우 혈청 GGT (53.26±49.67 IU/L vs 67.66±60.16 IU/L) 및 요산농도(6.22±1.26 mg/dL vs 6.38±1.40 mg/dL)가 유의하게 높았다(각각 P<0.001).
3. 비만 유형에 따른 혈청 GGT 및 고요산혈증 발생 교차비 비만 유형에 따른 혈청 GGT 상승의 발생 확률은 보정하지 않 은 경우 정상체중군을 참고군으로 했을 때 과체중군에서는
1.58배(1.394∼1.795), 비만군에서 3.24배(2.896∼3.622) 높 았으며(각각 P<0.001), 연령, 혈압, HDL-콜레스테롤, LDL-콜 레스테롤, 총콜레스테롤, 중성지방, 공복혈당을 보정한 경우에 는 정상체중군보다 과체중군에서 GGT 상승이 발생할 확률은 1.35배(1.180∼1.553), 비만군에서는 2.31배(2.039∼2.625) 높은 것으로 나타났다(각각 P<0.001) (Table 3). 비만 유형에 따른 고요산혈증의 발생 위험은 보정하지 않은 경우 정상체중 군보다 저체중군에서 0.59배 낮은 것으로 나타났으나(P=0.046), 연령, 혈압, HDL-콜레스테롤, LDL-콜레스테롤, 총콜레스테 롤, 중성지방, 공복혈당을 보정한 후 저체중은 고요산혈증에 통
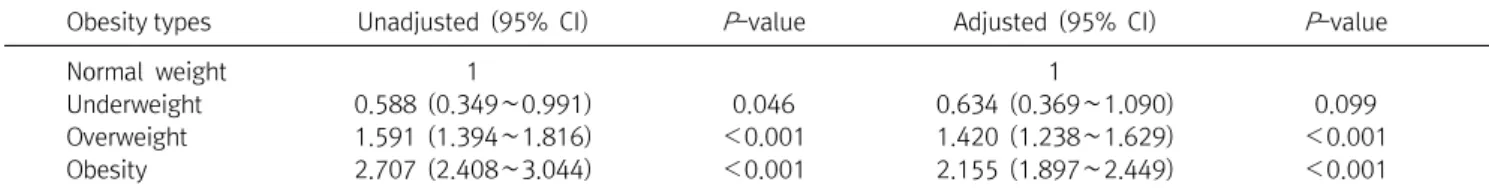
Table 4. Odds ratio (95% CI) for the elevated serum uric acid according to the obesity type
Obesity types Unadjusted (95% CI) P-value Adjusted (95% CI) P-value
Normal weight 1 1
Underweight 0.588 (0.349∼0.991) 0.046 0.634 (0.369∼1.090) 0.099
Overweight 1.591 (1.394∼1.816) <0.001 1.420 (1.238∼1.629) <0.001
Obesity 2.707 (2.408∼3.044) <0.001 2.155 (1.897∼2.449) <0.001
Adjusted odds ratios for age, blood pressure, HDL-cholesterol, LDL-cholesterol, total cholesterol, glucose, triglyceride.
Abbreviations: ORs, odds ratio; CI, confidence interval.
계적으로 유의한 영향을 미치지 않았다. 또한 보정하지 않은 상 태에서 정상체중군보다 과체중군에서 고요산혈증의 발생 가능 성은 1.59배(1.394∼1.816) 높았으며, 연령, 혈압, HDL-콜레 스테롤, LDL-콜레스테롤, 총콜레스테롤, 중성지방, 공복혈당 을 보정한 후에는 1.42배(1.238∼1.629) 높았다(각각 P<0.001).
보정하지 않은 경우 비만군은 정상체중군보다 고요산혈증의 발 생 가능성이 2.71배(2.408∼3.044) 높은 것으로 나타났으나 (P<0.001), 연령, 혈압, HDL-콜레스테롤, LDL-콜레스테롤, 총콜레스테롤, 중성지방, 공복혈당을 보정한 후에는 2.16배 (1.897∼2.449) 높았다(P<0.001) (Table 4).
고 찰
본 연구결과 혈청 GGT와 요산농도는 과체중과 비만군에서 높았으며, 비만군은 복부비만을 동반한 경우 혈청 GGT와 요산 농도가 유의하게 높았다. 또한 과체중과 비만군은 정상체중군 보다 혈청 GGT 상승과 고요산혈증의 위험이 높게 나타났다.
GGT (gamma-glutamyl transferase)는 항산화 물질인 글 루타티온(glutathione)의 대사에 관여하는 효소로 세포 내 항 산화 보호 메커니즘의 구성 요소이다[1]. GGT는 간 지방증 (steatosis)과 산화 스트레스의 지표이지만, GGT의 만성적 증 가는 죽상동맥경화증 등 심혈관계 질환의 위험을 증가시킬 수 있다[18-20]. 비만인은 식사로 섭취하는 지방량과 더불어 지방 세포에서 유리되는 지방산, 간세포에서 지방합성을 촉진하여 간세포 내로 유입되는 유리지방산이 증가함으로써 지방간을 유 발한다[21]. 이규선 등[22]은 지방간과 BMI, 체지방율, 허리둘 레/엉덩이둘레 비, 허리둘레/신장 비와 같은 비만지표간에 관 련성이 크다는 결과를 보고하였다.
본 연구결과에서 정상체중군보다 과체중과 비만군에서 혈청 GGT가 높았으나, 저체중군과는 차이가 없었다. 특히 과체중과 비만군은 복부비만을 동반한 경우 혈청 GGT가 URL (upper reference limit) 이상의 상승을 보여 허리둘레를 줄이기 위한 중재가 무엇보다 중요하겠다. 또한 관련 변인들을 보정한 후 과 체중과 비만은 혈청 GGT 상승의 발생 가능성을 각각 1.35배,
2.31배 높이는 것으로 나타났으나, 저체중은 혈청 GGT 상승에 영향을 미치지 않는 것으로 나타났다. 과체중 및 비만과 혈중 GGT와의 관련성에 대한 기전은 명확하게 설명되고 있지 않으 며, 그 가설로는 혈중 GGT 상승은 비만과 내장지방 축적이 원인 일 수 있다는 것이다[23-25]. 또 다른 가설은 비만이 신체의 산 화 스트레스를 유발하는 요인으로[4, 5] 과도한 산화 스트레스 는 세포 내 글루타티온의 고갈에 따른 혈중 GGT 활성이 증가한 다는 것이다[18-20]. 그러므로 혈중 GGT는 간담도계 질환 또 는 과도한 알코올 섭취의 지표 이외에도 과체중 및 비만을 평가 하는데 임상적 유용성이 있다고 판단된다.
혈청 요산은 신장의 사구체에서 여과되고 근위 세뇨관에서 재흡수되는 퓨린의 산화 부산물이며, 내피세포 기능을 억제함 으로써 인슐린 저항성을 촉진시킨다고 보고된다[26, 27]. 고요 산혈증은 요산 합성의 증가, 요산의 신장 배설 감소, 또는 이 두 가지 메커니즘의 변화에 기인한다[28]. 동물실험에서 지방조직 은 크산틴 산화환원효소(xanthine oxidoreductase)의 발현과 활성이 풍부한 기관으로 비만은 크산틴 산화환원효소의 활성을 증가시켜, 요산의 생성 및 분비를 촉진한다고 보고된다[29]. 비 만과 요산농도간의 관련성에 대한 연구결과 혈중 요산농도가 증가할수록 BMI는 지속적으로 증가하며, 요산농도와 비만간에 유의한 양의 상관관계가 있음이 보고된다[30-32].
본 연구결과 체질량지수로 분류한 저체중군에서 비만군으로 진행할수록 요산농도는 비례하여 증가하는 양상을 나타냈으 며, 비만군에서 복부비만이 동반된 경우 요산농도의 유의한 상 승을 보였다. 체질량지수는 비만을 평가하는 가장 일반적인 지 표이지만, 근육량이나 신체내 지방분포를 반영하는데 어려움 이 있다[33]. 그러므로 비만을 효과적으로 관리하기 위해 허리 둘레 측정을 고려하는 것이 중요하다. 또한 본 연구에서 관련 변 인들을 보정한 후 과체중과 비만에서 고요산혈증 발생 가능성 은 각각 1.42배, 2.16배였으나, 저체중은 고요산혈증에 유의한 영향을 미치지 않았다. 고요산혈증은 통풍의 원인이며, 비만, 이 상지질혈증, 고혈압 및 당뇨병이 있을 때 동반하여 발생하는 것 으로 알려져 있다[34]. 최근 연구를 통해 요산은 항산화제로 작 용하여 자유 라디칼(free radical) 생성에 중요한 역할을 하며,
심혈관계 질환 및 관상동맥 심장질환과 관련이 있음이 입증되 었다[35-37]. 비만은 고요산혈증의 관련요인으로 제시되며, 그 기전으로는 비만에서 인슐린 저항성과 신장에서의 요산 청소율 감소로 혈청 요산이 증가한다고 보고된다[38]. 또한 비만인의 지방조직은 저산소(hypoxia) 상태이며, 이는 세포내 크산틴 산 화환원효소의 활성을 증가시켜 비만에서 요산 생성이 증가할 수 있다고 제안된다[39]. 또 다른 기전은 비만인의 지방조직은 지방산 합성 활성화를 특징으로 하는데, 지방산 합성은 오탄당 인산경로의 활성화를 통해 퓨린 합성과 밀접한 관련이 있다고 추정된다[40]. 요산 생성과 관련한 기전은 아직 완전히 밝혀지 지 않았으며, 향후 비만인에서 혈중 산화질소(nitric oxide)의 측정을 통한 산화적 스트레스와 요산 및 GGT간의 관계를 구체 적으로 설명하는 연구가 필요하겠다.
이상의 결과로 혈청 GGT 상승와 고요산혈증을 유발하는 과 체중과 비만 성인에서 심혈관 질환의 위험을 줄이기 위해 체중 감량을 통한 중재가 필요하며, 과체중 및 비만을 평가하는데 혈 청 GGT와 요산이 유용하다고 판단된다.
본 연구의 제한점은 혈청 GGT와 요산농도에 영향을 미칠 수 있는 약물이나 음주에 관한 조사가 미흡하였다는 점이다. 또한 간질환이나 통풍질환의 병력자를 제외기준으로 제시하였으나, 초음파 검사를 통한 지방간 질환자를 구분 또는 배제하지 못하 였다. 본 연구는 횡단면 연구로써 혈청 GGT 및 요산수치와 비만 유형간의 인과관계를 설명할 수 없었으며, 20세 이상 성인 남성 을 대상으로 하였으므로 결과를 다른 대상자에게 확대 해석하 는 데에는 어려움이 있다.
요 약
본 연구는 성인 남성을 대상으로 체질량지수로 분류한 비만 유형에 따른 혈청 GGT와 요산농도의 차이와 관련성을 확인하 고자 하였다. 2017년 1월부터 2018년 8월까지 경기지역 종합 병원의 건강검진센터를 내원하여 건강검진을 실시한 20세 이 상 성인 남성 14,283명을 대상으로 하였다. 비만 기준은 아시아- 태평양지역 기준을 적용하였으며, 복부비만은 남성의 허리둘 레 90 cm이상을 기준치로 정의하였다. 남성 대상자의 혈청 요 산농도 상승은 7.0 mg/dL 이상, 혈청 GGT 상승은 56 IU/L 이상 으로 정의하였다. 본 연구결과 혈청 GGT와 요산농도는 정상체 중군보다 과체중과 비만군에서 높았으며, 비만군에서는 복부 비만을 동반한 경우 혈청 GGT (53.26±49.67 IU/L vs 67.66±
60.16 IU/L) 및 요산농도(6.22±1.26 mg/dL vs 6.38±1.40 mg/dL)가 유의하게 높았다. 그러나 저체중군과는 차이가 없었
다. 또한 과체중과 비만군은 정상체중군보다 혈청 GGT 상승과 고요산혈증의 위험이 높게 나타났으나, 저체중은 혈청 GGT 상 승과 고요산혈증에 영향을 미치지 않는 것으로 나타났다. 따라 서 성인 남성의 과체중 및 비만을 평가하는데 혈청 GGT와 요산 이 유용하다고 판단된다.
Acknowledgements: None Conflict of interest: None
Author’s information (Position): Shin KA, Professor.
REFERENCES
1. Whitfield JB. Gamma glutamyl transferase. Crit Rev Clin Lab Sci.
2001;38:263-355.
2. Wu J, Qiu L, Yan WH, Cheng XQ, Wu W, Guo XZ, et al. Serum gamma-glutamyl transferase and uric acid levels are associated with impaired fasting glucose in adults from Inner Mongolia, China. BMC Public Health. 2013;13:294.
3. Thamer C, Tschritter O, Haap M, Shirkavand F, Machann J, Fritsche A, et al. Elevated serum GGT concentrations predict reduced insulin sensitivity and increased intrahepatic lipids.
Horm Metab Res. 2005;37:246-251.
4. Lee DH, Ha MH, Kim JH, Christiani DC, Gross MD, Steffes M, et al. Gamma-glutamyl transferase and diabetes-a 4 year fol- low-up study. Diabetologia. 2003;46:359-364.
5. Kerner A, Avizohar O, Sella R, Bartha P, Zinder O, Markiewicz W, et al. Association between elevated liver enzymes and C-re- active protein: possible hepatic contribution to systemic in- flammation in the metabolic syndrome. Arterioscler Thromb Vasc Biol. 2005;25:193-197.
6. Yunus YM, Muniandy W, Lai HI. Comparison of serum uric acid and gamma-glutamyl transpeptidase (GGT) level in obese in- dividuals and non-obese individual. Int J Acad Res Bus Soc Sci.
2017;7:756-769.
7. Feig DI, Madero M, Jalal DI, Sanchez-Lozada LG, Johnson RJ.
Uric acid and the origins of hypertension. J Pediatr. 2013;162:
896-902.
8. Qin L, Yang Z, Gu H, Lu S, Shi Q, Xing Y, et al. Association be- tween serum uric acid levels and cardiovascular disease in mid- dle-aged and elderly Chinese individuals. BMC Cardiovasc Disord.
2014;14:26.
9. Gonçalves JP, Oliveira A, Severo M, Santos AC, Lopes C. Cross- sectional and longitudinal associations between serum uric acid and metabolic syndrome. Endocrine. 2012;41:450-457.
10. Shin KA. Clinical usefulness of serum uric acid and resting heart rate in the diagnosis of metabolic syndrome in Korean adults.
Biomedical Science Letters. 2017;23:118-127.
11. Nakagawa T, Hu H, Zharikov S, Tuttle KR, Short RA, Glushakova O, et al. A causal role for uric acid in fructose-induced meta- bolic syndrome. Am J Physiol Renal Physiol. 2006;290:625-631.
12. Sautin YY, Nakagawa T, Zharikov S, Johnson RJ. Adverse effects of the classic antioxidant uric acid in adipocytes: NADPH oxi-
dase-mediated oxidative/nitrosative stress. Am J Physiol Cell Physiol. 2007;293:584-596.
13. Cnop M, Landchild MJ, Vidal J, Havel PJ, Knowles NG, Carr DR, et al. The concurrent accumulation of intra-abdominal and subcutaneous fat explains the association between insulin re- sistance and plasma leptin concentrations : distinct metabolic effects of two fat compartments. Diabetes. 2002;51:1005-1015.
14. Garg A. Acquired and inherited lipodystrophies. N Engl J Med.
2004;350:1220-1234.
15. WHO; IASO; IOTF. The Asia-Pacific perspective: redefining obesity and its treatment [Internet]. Sydney: Australia; 2000 [cited 2018 September 10]. Available from: http://www.wpro.
who.int/nutrition/documents/docs/Redefiningobesity.pdf.
16. Kang DH. Does hyperuricemia play a causative role in the de- velopment and/or aggravation of renal, cardiovascular and metabolic disease? Korean J Med. 2011;80:524-528.
17. Jalanko H, Ranta T, Lehtonen E, Ruoslahti E. Gamma-glutamyl transpeptidase in human amniotic fluid and in fetal tissues. Clin Chim Acta. 1983;134:337-346.
18. Aksakal E, Tanboga IH, Kurt M, Kaygın MA, Kaya A, Isik T, et al.
The relation of serum gamma-glutamyl transferase levels with coronary lesion complexity and long-term outcome in patients with stable coronary artery disease. Atherosclerosis.
2012;221:596-601.
19. Dogan A, Icli A, Aksoy F, Varol E, Erdogan D, Ozaydin M, et al.
Gamma-glutamyltransferase in acute coronary syndrome pa- tients without ST elevation and its association with stenotic le- sion and cardiac events. Coron Artery Dis. 2012;23:39-44.
20. Akpek M, Elcik D, Kalay N, Yarlioglues M, Dogdu O, Sahin O, et al. The prognostic value of serum gamma-glutamyl transferase activity on admission in patients with STEMI undergoing pri- mary PCI. Angiology. 2012;63:579-585.
21. Fan JG, Zhu J, Li XJ, Chen L, Lu YS, Li L, et al. Fatty liver and the metabolic syndrome among Shanghai adults. J Gastroenterol Hepatol. 2005;20:1825-1832.
22. Lee KS, Kim KH, Cho YC. Prevalence of fatty liver and its asso- ciation with indices of obesity, liver function and hyper- lipidemia among adult males. J Korea Acad Industr Coop Soc.
2009;10:1414-1423.
23. Marchesini G, Brizi M, Bianchi G, Tomassetti S, Bugianesi E, Lenzi M, et al. Nonalcoholic fatty liver disease: a feature of the metabolic syndrome. Diabetes. 2001;50:1844-1850.
24. Yokoyama H, Hirose H, Moriya S, Saito I. Significant correlation between insulin resistance and serum gamma-glutamyl trans- peptidase (gamma-GTP) activity in non-drinkers. Alcohol Clin Exp Res. 2002;26(8 Suppl):91-94.
25. Ortega E, Koska J, Salbe AD, Tataranni PA, Bunt JC. Serum gam- ma-glutamyl transpeptidase is a determinant of insulin resist- ance independently of adiposity in Pima Indian children. J Clin Endocrinol Metab. 2006;91:1419-1422.
26. Feig DI, Kang DH, Johnson RJ. Uric acid and cardiovascular risk.
N Engl J Med. 2008;359:1811-1821.
27. Tsouli SG, Liberopoulos EN, Mikhailidis DP, Athyros VG, Elisaf MS. Elevated serum uric acid levels in metabolic syndrome: an active component or an innocent bystander? Metabolism.
2006;55:1293-1301.
28. Ya Z, Fei L, Yue Z, Dan L, Neng-Bo L, Yi L, et al. Association be- tween serum gamma-glutamyl transferase and serum uric acid levels in Chinese females: a cross-sectional study. Endocr Res.
2017;42:296-301.
29. Tsushima Y, Nishizawa H, Tochino Y, Nakatsuji H, Sekimoto R, Nagao H, et al. Uric acid secretion from adipose tissue and its increase in obesity. J Biol Chem. 2013;288:27138-27149.
30. Hong SJ, Kim YS, Kim HS. Prevalence and clinical features of hyperuricemia in Gwangju and Jeonnam territories. J Rheum Dis. 2012;19:138-146.
31. Kim MS, Moon YT, Kim MS. The relationship between obesity and the risk factors of urolithiasis. Korean J Urol. 2007;48:
505-511.
32. Ali N, Perveen R, Rahman S, Mahmood S, Rahman S, Islam S, et al. Prevalence of hyperuricemia and the relationship between serum uric acid and obesity: A study on Bangladeshi adults.
PLoS One. 2018;13:e0206850.
33. Dalton M, Cameron AJ, Zimmet PZ, Shaw JE, Jolley D, Dunstan DW, et al. Waist circumference, waist-hip ratio and body mass index and their correlation with cardiovascular disease risk factors in Australian adults. J Intern Med. 2003;254:555-563.
34. Yano K, Rhoads G, Kagan A. Epidemiology of serum uric acid among 8000 Japanese-American men in Hawaii. J Chronic Dis.
1977;30:171-184.
35. Chen JH, Chuang SY, Chen HJ, Yeh WT, Pan WH. Serum uric acid level as an independent risk factor for all-cause, car- diovascular, and ischemic stroke mortality: a Chinese cohort study. Arthritis Rheum. 2009;61:225-232.
36. Strasak A, Ruttmann E, Brant L, Kelleher C, Klenk J, Concin H, et al. Serum uric acid and risk of cardiovascular mortality: a pro- spective long-term study of 83,683 Austrian men. Clin Chem.
2008;54:273-284.
37. Jin M, Yang F, Yang I, Yin Y, Luo JJ, Wang H, et al. Uric acid, hy- peruricemia and vascular diseases. Front Biosci (Landmark Ed).
2012;17:656-669.
38. Folsom AR, Burke GL, Ballew C, Jacobs DR Jr, Haskell WL, Donahue RP, et al. Relation of body fatness and its distribution to cardiovascular risk factors in young blacks and whites. The role of insulin. Am J Epidemiol. 1989;130:911-924.
39. Ye J, Gao Z, Yin J, He Q. Hypoxia is a potential risk factor for chronic inflammation and adiponectin reduction in adipose tis- sue of ob/ob and dietary obese mice. Am J Physiol Endocrinol Metab. 2007;293:1118-1128.
40. Spiegelman BM, Flier JS. Adipogenesis and obesity: rounding out the big picture. Cell. 1996;87:377-389.