INTRODUCTION
Primary percutaneous coronary intervention (PCI) is an estab- lished treatment for patients with ST-segment elevation myo- cardial infarction (STEMI). However, after successful PCI many patients continue to have microvascular dysfunction docu-
mented by various invasive and non-invasive tests.1-3 Impaired microcirculation after successful reperfusion therapy corre- lates strongly with a poor prognosis.4-7
The index of microcirculatory resistance (IMR) is a simple and standard method of assessing microvascular integrity by using a pressure sensor/thermistor-tipped guidewire, and it is a strong predictor of microvascular damage, especially 3 months after STEMI.8 Using contrast-cardiac magnetic resonance im- aging, it has also been shown that IMR can independently pre- dict left ventricular function and infarct volume following STE- MI.9,10 In a recent study, an elevated IMR measured immediately after primary PCI was a strong predictor of poor long-term out- comes.11
Multiple clinical-, angiographic-, and procedure-related fac- tors could affect microcirculation in STEMI patients prior to or during primary PCI; however, data on which of these factors
Clinical and Angiographic Predictors of Microvascular Dysfunction in ST-Segment Elevation Myocardial Infarction
Yong-Soo Baek*, Sang-Don Park*, Soo-Han Kim, Man-Jong Lee, Sung-Hee Shin, Dae-Hyeok Kim, Jun Kwan, Keum-Soo Park, and Seong-Ill Woo
Division of Cardiology, Inha University Hospital, Incheon, Korea.
Purpose: We aimed to discover clinical and angiographic predictors of microvascular dysfunction using the index of microcircu- latory resistance (IMR) in patients with ST-segment elevation myocardial infarction (STEMI).
Materials and Methods: We enrolled 113 patients with STEMI (age, 56±11 years; 95 men) who underwent primary percutaneous coronary intervention (PCI). The IMR was measured with a pressure sensor/thermistor-tipped guidewire after primary PCI. The patients were divided into three groups based on IMR values: Low IMR [<18 U (12.9±2.6 U), n=38], Mid IMR [18–31 U (23.9±4.0 U), n=38], and High IMR [>31 U (48.1±17.1 U), n=37].
Results: The age of the Low IMR group was significantly lower than that of the Mid and High IMR groups. The door-to-balloon time was <90 minutes in all patients, and it was not significantly different between groups. Meanwhile, the symptom-onset-to- balloon time was significantly longer in the High IMR group, compared to the Mid and Low IMR groups (p<0.001). In the high IMR group, the culprit lesion was found in a proximal location significantly more often than in a non-proximal location (p=0.008).
In multivariate regression analysis, age and symptom-onset-to-balloon time were independent determinants of a high IMR (p=0.013 and p=0.003, respectively).
Conclusion: Our data suggest that age and symptom-onset-to-balloon time might be the major predictors of microvascular dys- function in STEMI patients with a door-to-balloon time of <90 minutes.
Key Words: Microvascular dysfunction, ST-segment elevation myocardial infarction, index of microcirculatory resistance, door- to-balloon time, symptom-onset-to-balloon time
Yonsei Med J 2015 Sep;56(5):1235-1243
http://dx.doi.org/10.3349/ymj.2015.56.5.1235 pISSN: 0513-5796 · eISSN: 1976-2437
Received: August 29, 2014 Revised: November 3, 2014 Accepted: November 20, 2014
Corresponding author: Dr. Seong-Ill Woo, Division of Cardiology, Inha University Hospital, 27 Inhang-ro, Jung-gu, Incheon 400-711, Korea.
Tel: 82-32-890-2445, Fax: 82-32-890-2447, E-mail: [email protected]
*Yong-Soo Baek and Sang-Don Park contributed equally to this work.
•The authors have no financial conflicts of interest.
© Copyright: Yonsei University College of Medicine 2015
This is an Open Access article distributed under the terms of the Creative Com- mons Attribution Non-Commercial License (http://creativecommons.org/ licenses/
by-nc/3.0) which permits unrestricted non-commercial use, distribution, and repro- duction in any medium, provided the original work is properly cited.
has the most influence on microvascular integrity are limited.
In the present study, we used IMR to assess microvascular in- tegrity in STEMI patients who underwent primary PCI. We aimed to assess the clinical and angiographic predictors of mi- crovascular dysfunction in STEMI patients.
MATERIALS AND METHODS
Study design
The present study is a retrospective cohort study designed to find out the clinical and angiographic determinants of micro- vascular dysfunction in STEMI patients. We enrolled STEMI patients who underwent primary PCI and coronary physiolog- ic measurements from 2011 to 2014 at Inha University Hospi- tal. IMR, a parameter of hyperemic microvascular resistance, was measured with a pressure sensor/thermistor-tipped guide- wire immediately after successful primary PCI. A transthoracic echocardiogram (TTE) was obtained within 24 hours. This study was approved by Inha University Hospital’s Institutional Review Board, and written informed consent was obtained from each patient.
Study population
We enrolled 113 patients with STEMI who underwent primary PCI. The IMR was measured immediately after successful pri- mary PCI. The patients were divided into three groups based on IMR values as tertiles: Low IMR (<18 U, n=38), Mid IMR (18–31 U, n=38), and High IMR (>31 U, n=37). Patients with STEMI were diagnosed based on symptoms of myocardial ischemia in association with ST-segment elevation and subsequent re- lease of cardiac biomarkers. ST elevation was defined as new ST elevation at J point of ≥2 mm (0.2 mV) in men or ≥1.5 mm (0.15 mV) in women in at least two contiguous leads on elec- trocardiography.12 We excluded patients with prior myocardial infarction in order to focus on de novo coronary microvascular resistance, and also excluded patients with cardiogenic shock, Killip Class IV, and atrioventricular block, as they were contra- indicated to an invasive coronary physiologic study using ade- nosine.13
Angiographic analysis
Lesion length and reference diameter (RD) were measured us- ing an automated edge-detection algorithm (CASS 5.7.1, Pie Medical Imaging Systems, Maastricht, the Netherlands). Auto- mated distance calibration was used to determine pixel size.
Angiographic views with the least foreshortening and the best depiction of the stenosis were used. Thrombolysis in Myocardi- al Infarction (TIMI) grade and TIMI myocardial perfusion grade (TMPG) were obtained using a grading scale of 0–3. Le- sions of the coronary artery were classified by the American College of Cardiology/American Heart Association (ACC/
AHA) grading system as type A, B1, B2, and C.
Measurement of IMR
After successful primary PCI, a pressure sensor/thermistor- tipped guidewire (Radi Medical System, Uppsala, Sweden) was calibrated outside the body, equalized to the guiding catheter, and advanced to the distal two-thirds of the culprit vessel.
Three bolus injections of 3 mL room temperature saline were administrated at the culprit vessel, and the mean transit time was obtained using a thermodilution technique.14 After intra- venous adenosine (140 μg/kg/min) was administered to induce maximal hyperemia; the hyperemic mean transit time (hTmn) was measured again using the same method above. Simultane- ously, mean aortic pressure (Pa) and mean distal pressure (Pd) were measured during the resting and maximal hyperemic state. The IMR value was calculated as Pd×hTmn.2 Fractional flow reserve (FFR) was derived from the ratio of Pd to Pa dur- ing maximal hyperemia.15 In addition, thermodilution coronary flow reserve (CFR) was calculated by dividing the resting mean transit time by the hTmn.16
Echocardiographic analysis
A TTE was obtained within 24 hours after the index PCI. Left ventricular ejection fraction (LVEF) was measured using the modified Simpson method. As recommended by the American Society of Echocardiography, the wall motion score index (WMSI) was assessed in a 16-segment model.17 An experi- enced cardiologist blinded to the IMR values scored segmental wall motion and the WMSI.
Statistical analysis
Statistical analysis was performed using SPSS 21.0 statistical software (SPSS Inc., Chicago, IL, USA). Data are presented as mean±SD for continuous variables and as proportions for cat- egorical variables. Continuous variables were compared using the Student’s t-test. Analysis of categorical variables was per- formed using the chi-square test. Continuous variables were compared using one-way analysis of variance (ANOVA) and Fisher’s exact test as a post hoc test for each IMR group. Uni- variate correlations between variables were assessed by Pear- son’s correlation coefficients (r). Linear regression analyses were performed to assess the relationships between IMR and clinical, angiographic, and anatomical factors. Univariate re- gression analysis was used to identify relationships between each clinical and angiographic factor and increased IMR. The clinical and angiographic predictors of impaired microvascu- lar function were assessed using multivariate logistic regres- sion analysis. Figures were created by using GraphPad Prism v.5.01 (GraphPad Software, Inc., San Diego, CA, USA).
RESULTS
Patient characteristics between IMR groups
The mean age of the 113 study population was 56±11 years; 95
patients (84.1%) were men. The mean IMR in the study popula- tion was 28.2±17.8 U (range, 7.3–98.4 U). To determine the pre- dictive factors for microvascular dysfunction, the study popula- tion was classified into three groups based on IMR values: Low IMR [<18 U (12.9±2.6 U), n=38], Mid IMR [18–31 U (23.9±4.0 U), n=38], and High IMR [>31 U (48.1±17.1 U), n=37] (Table 1).
Clinical and laboratory findings
The mean age of the Low IMR group was significantly lower than that of the Mid and High IMR groups (51±9 vs. 57±11 vs.
61±10, p=0.031) (Table 1). There were no significant differenc- es in the presence of hypertension, diabetes, dyslipidemia, or smoking history between the three IMR groups.
The door-to-balloon time was <90 minutes for all patients.
The High IMR group tended to have longer door-to-balloon times, compared to the Low and Mid IMR groups, although the difference was not statistically significant (65.7±14.6 min vs. 74.8±19.8 min vs. 82.0±44.6 min, p=0.068). However, the symptom-onset-to-balloon time of the high IMR group was significantly longer than that of the Low IMR and Mid IMR groups (172.2±80.1 min vs. 197.4±104.1 min vs. 299.8±195.1 min, p<0.001) (Table 1). The levels of cardiac enzymes, includ- ing creatine kinase (CK), creatine kinase-myocardial band (CK-MB), and troponin I, were significantly higher in the high IMR group, compared to the other groups (Table 1). The base- line LVEF of the High IMR group was lower than that of the Low and Mid IMR groups, although the difference was not sig- nificant (p=0.246). The high IMR group tended to have higher
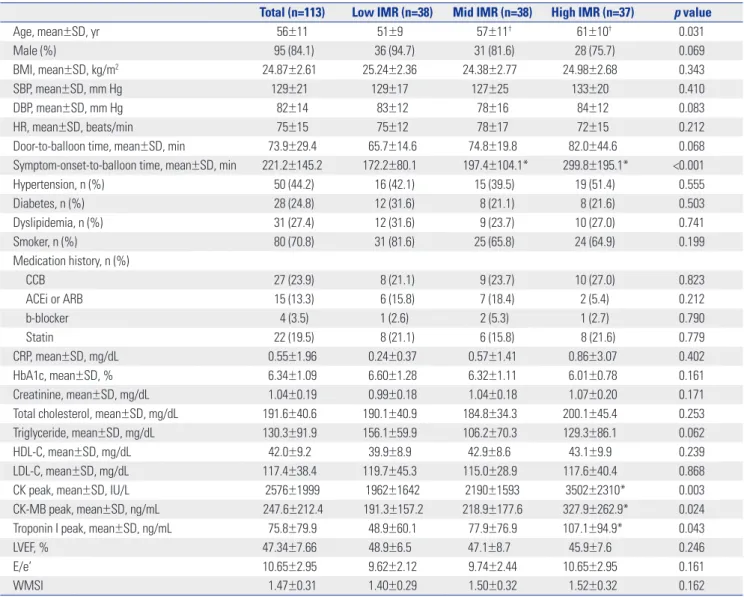
Table 1. Clinical Characteristic and Laboratory and Echocardiographic Findings of Patients in the Different IMR Groups
Total (n=113) Low IMR (n=38) Mid IMR (n=38) High IMR (n=37) p value
Age, mean±SD, yr 56±11 51±9 57±11† 61±10† 0.031
Male (%) 95 (84.1) 36 (94.7) 31 (81.6) 28 (75.7) 0.069
BMI, mean±SD, kg/m2 24.87±2.61 25.24±2.36 24.38±2.77 24.98±2.68 0.343
SBP, mean±SD, mm Hg 129±21 129±17 127±25 133±20 0.410
DBP, mean±SD, mm Hg 82±14 83±12 78±16 84±12 0.083
HR, mean±SD, beats/min 75±15 75±12 78±17 72±15 0.212
Door-to-balloon time, mean±SD, min 73.9±29.4 65.7±14.6 74.8±19.8 82.0±44.6 0.068
Symptom-onset-to-balloon time, mean±SD, min 221.2±145.2 172.2±80.1 197.4±104.1* 299.8±195.1* <0.001
Hypertension, n (%) 50 (44.2) 16 (42.1) 15 (39.5) 19 (51.4) 0.555
Diabetes, n (%) 28 (24.8) 12 (31.6) 8 (21.1) 8 (21.6) 0.503
Dyslipidemia, n (%) 31 (27.4) 12 (31.6) 9 (23.7) 10 (27.0) 0.741
Smoker, n (%) 80 (70.8) 31 (81.6) 25 (65.8) 24 (64.9) 0.199
Medication history, n (%)
CCB 27 (23.9) 8 (21.1) 9 (23.7) 10 (27.0) 0.823
ACEi or ARB 15 (13.3) 6 (15.8) 7 (18.4) 2 (5.4) 0.212
b-blocker 4 (3.5) 1 (2.6) 2 (5.3) 1 (2.7) 0.790
Statin 22 (19.5) 8 (21.1) 6 (15.8) 8 (21.6) 0.779
CRP, mean±SD, mg/dL 0.55±1.96 0.24±0.37 0.57±1.41 0.86±3.07 0.402
HbA1c, mean±SD, % 6.34±1.09 6.60±1.28 6.32±1.11 6.01±0.78 0.161
Creatinine, mean±SD, mg/dL 1.04±0.19 0.99±0.18 1.04±0.18 1.07±0.20 0.171
Total cholesterol, mean±SD, mg/dL 191.6±40.6 190.1±40.9 184.8±34.3 200.1±45.4 0.253
Triglyceride, mean±SD, mg/dL 130.3±91.9 156.1±59.9 106.2±70.3 129.3±86.1 0.062
HDL-C, mean±SD, mg/dL 42.0±9.2 39.9±8.9 42.9±8.6 43.1±9.9 0.239
LDL-C, mean±SD, mg/dL 117.4±38.4 119.7±45.3 115.0±28.9 117.6±40.4 0.868
CK peak, mean±SD, IU/L 2576±1999 1962±1642 2190±1593 3502±2310* 0.003
CK-MB peak, mean±SD, ng/mL 247.6±212.4 191.3±157.2 218.9±177.6 327.9±262.9* 0.024
Troponin I peak, mean±SD, ng/mL 75.8±79.9 48.9±60.1 77.9±76.9 107.1±94.9* 0.043
LVEF, % 47.34±7.66 48.9±6.5 47.1±8.7 45.9±7.6 0.246
E/e’ 10.65±2.95 9.62±2.12 9.74±2.44 10.65±2.95 0.161
WMSI 1.47±0.31 1.40±0.29 1.50±0.32 1.52±0.32 0.162
IMR, index of microcirculatory resistance; SD, standard deviation; BMI, body mass index; SBP, systolic blood pressure; DBP, diastolic blood pressure; HR, heart rate; CCB, calcium channel blocker; ACEi, angiotensin angiotensin-converting-enzyme inhibitor; ARB, angiotensin II receptor blocker; b-blocker, beta blocker; CRP, C-reactive protein; HbA1c, hemoglobin A1c; HDL-C, high-density lipoprotein cholesterol; LDL-C, low-density lipoprotein cholesterol; CK, creatine kinase; CK-MB, creatine kinase-myocardial band; LVEF, left ventricular ejection fraction; E, early diastolic velocity of the mitral annulus; E/e’, ratio of E velocity to e‘; WMSI, wall motion score index.
*p<0.05 versus Low IMR by post hoc test by analysis of variance (ANOVA), Fisher’s exact.
WMSI values than the Low and Mid IMR groups, although the difference in the values was not significant (p=0.162) (Table 1).
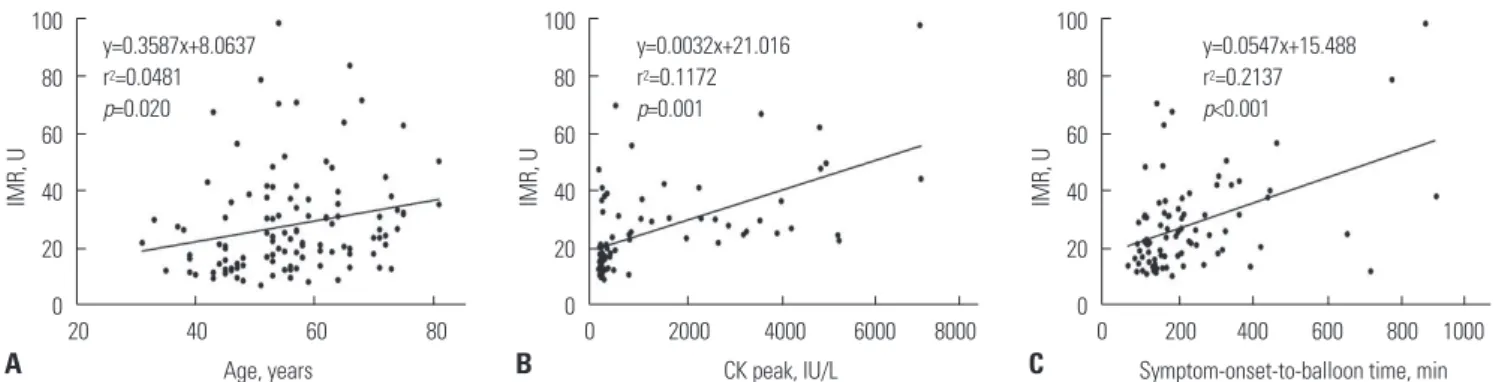
In correlation analysis, significant association was found be- tween IMR values and age (r=0.219, p=0.020), CK level (r=0.342, p=0.010), and the symptom-onset-to-balloon time (r=0.463, p<0.001) (Fig. 1).
Angiographic findings
The culprit artery and coronary intervention including throm- bus aspiration, direct stenting, the use of glycoprotein IIb/IIIa inhibitors, and lesion characteristics, including length, RD, and ACC/AHA lesion classification, were not significantly different between the IMR groups (Table 2). Culprit lesions located in the proximal portion of the target vessel were more frequent in the High IMR group than the Low IMR group (28.9% vs. 59.5%, p=0.008). The initial TIMI 0/1 flow before PCI was seen more frequently in the High than in the Low IMR group (55.3% vs.
81.1%, p=0.008). The achievement of a TIMI 3 (86.8% vs. 56.8%, p=0.015) and TMPG 3 (68.4% vs. 27.0%, p=0.008) after primary PCI was observed more frequently in the Low IMR than the High IMR group (Table 2).
Physiologic parameters
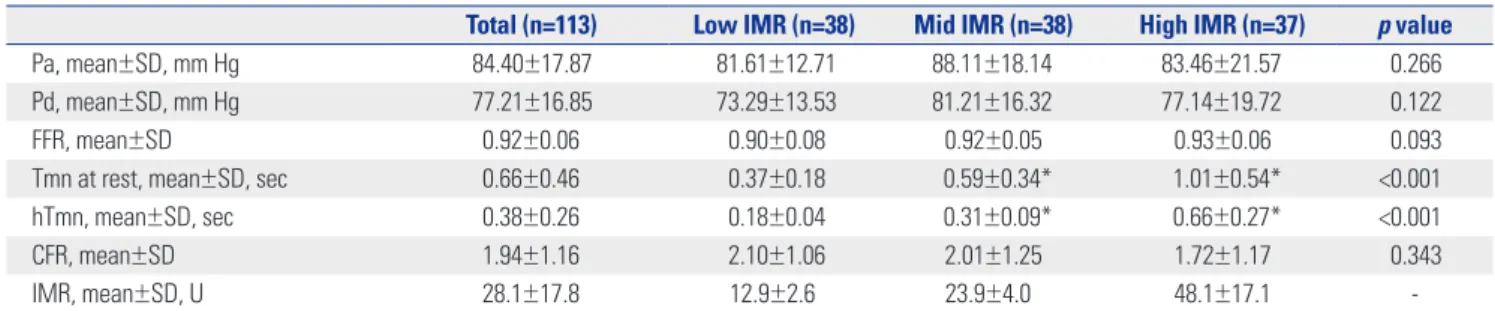
The baseline Pa and Pd showed no differences between the IMR groups. There were significant differences in Tmn at rest (0.37±0.18 vs. 0.59±0.34 vs. 1.01±0.54, p<0.001) and hTmn (0.18±0.04 vs. 0.31±0.09 vs. 0.66±0.27, p<0.001) (Table 3). The High IMR group tended to have higher FFR and lower CFR than the Low IMR and Mid IMR groups; however, the differ- ences were not significant (Table 3).
Comparison of IMR according to clinical and angiographic parameters
To determine whether certain parameters could influence mi- crovascular dysfunction, we compared the IMR groups accord- ing to the presence or criteria of various parameters. As shown in Fig. 2, there were no significant differences in IMR regard- less of major cardiovascular risk factors. However, our data did not show significant differences in IMR according to culprit ar-
teries, the IMR values were significantly higher in proximal lo- cations of the culprit lesion, as compared with non-proximal lesion (31.8±19.1 U vs. 24.6±15.8 U, p=0.033) and initial TIMI 0/1, as compared with initial TIMI 2/3 (23.0±12.8 U vs.
20.6±11.5 U, p=0.031) (Fig. 2). Since the door-to-balloon times were <90 minutes for all patients, we divided the patients into two groups (>60 minutes and ≤60 minutes). The two groups did not show a significant difference in IMR values (Fig. 2). There- after, the patients were divided according to a symptom-onset- to-balloon time of 180 minutes, and we observed that the IMR of those with a symptom-onset-to-balloon time of >180 min- utes was significantly higher than the IMR of those with a symptom-onset-to-balloon time of ≤180 minutes (Fig. 2).
Predictors of microvascular dysfunction
As shown in Table 4, age, symptom-onset-to-balloon time, car- diac biomarker, such as CK-MB and final TMPG level, showed a significant correlation with increasing IMR. Our data showed that a symptom-onset-to-balloon time of >180 minutes had a significant odds ratio (OR) for higher IMR between those with a symptom-onset-to-balloon time of >180 minutes and those with a symptom-onset-to-balloon time of ≤180 minutes [OR, 4.376; 95% confidence interval (CI): 1.851–10.347; p=0.001]. Car- diac biomarkers, such as CK-MB, was also significantly corre- lated to increasing IMR (Table 4). In multivariate regression analysis, age and symptom-onset-to-balloon time remained independent determinants for High IMR [Exp (β)=1.085, 95%
CI: 1.016–1.158, p=0.016; Exp (β)=1.007, 95% CI: 1.001–1.014, p=0.018, respectively] (Table 4).
DISCUSSION
The main findings of the present study are as follows: First, the High IMR group was older, had a longer symptom-onset-to-bal- loon time, and more frequently had a culprit lesion in a proxi- mal location. Second, age and symptom-onset-to-balloon time were independent predictors of high IMR, reflecting the pres- ence of microvascular dysfunction in patients with STEMI.
Fig. 1. Relations of age (A), CK peak (B), and symptom-onset-to-balloon time (C) to increasing IMR. Solid lines represent linear regression lines. IMR, index of microcirculatory resistance; CK, creatine kinase.
A B C
100 80 60 40 20 0
100 80 60 40 20 0
100 80 60 40 20 0
IMR, U IMR, U IMR, U
Age, years CK peak, IU/L Symptom-onset-to-balloon time, min
y=0.3587x+8.0637 r2=0.0481 p=0.020
y=0.0032x+21.016 r2=0.1172 p=0.001
y=0.0547x+15.488 r2=0.2137 p<0.001
20 40 60 80 0 2000 4000 6000 8000 0 200 400 600 800 1000
Table 2. Angiographic and Procedural Findings of Patients in the Different IMR Groups
Total (n=113) Low IMR (n=38) Mid IMR (n=38) High IMR (n=37) p value
QCA, mean±SD, mm
RD 2.86±0.50 2.86±0.43 2.83±0.56 2.88±0.52 0.901
Lesion length 16.82±5.26 16.19±4.95 16.81±5.26 17.46±5.61 0.584
Stent diameter 3.12±0.33 3.16±0.31 3.13±0.35 3.07±0.32 0.472
Stent length 25.37±8.60 23.16±6.83 26.80±9.43 26.11±9.06 0.143
Coronary territory, n (%) 0.266
LAD 80 (70.8) 25 (65.8) 26 (68.4) 29 (78.4)
LCX 9 (8.0) 5 (13.2) 1 (2.6) 3 (8.1)
RCA 24 (21.2) 8 (21.1) 11 (28.9) 5 (13.5)
Coronary intervention, n (%)
Thrombus aspiration 57 (50.4) 15 (39.5) 20 (52.6) 22 (59.5) 0.212
Direct stenting 50 (44.2) 12 (31.6) 20 (52.6) 18 (48.6) 0.146
Use of GP IIb/IIIa inhibitors 18 (15.9) 6 (15.8) 6 (15.8) 6 (16.2) 0.998
Lesion location 0.008
Proximal lesion 56 (49.6) 11 (28.9) 23 (60.5) 22 (59.5)
Non-proximal lesion 57 (50.4) 27 (71.1) 15 (39.5) 15 (40.5)
ACC/AHA classification, n (%) 0.566
A 9 (8.0) 3 (7.9) 3 (7.9) 3 (8.1)
B1 16 (14.2) 8 (21.1) 6 (15.8) 2 (5.4)
B2 60 (53.1) 20 (52.6) 18 (47.4) 22 (59.5)
C 28 (24.8) 7 (18.4) 11 (28.9) 10 (27.0)
TIMI grade and TMPG, n (%)
Initial TIMI 0.008
0/1 77 (68.1) 21 (55.3) 26 (68.4) 30 (81.1)
2 18 (15.9) 6 (15.8) 10 (26.3) 2 (5.4)
3 18 (15.9) 11 (28.9) 2 (5.3) 5 (13.5)
Final TIMI 0.015
0/1 0 0 0 0
2 31 (27.4) 5 (13.2) 10 (26.3) 16 (43.2)
3 82 (72.6) 33 (86.8) 28 (73.7) 21 (56.8)
TMPG 0.008
0/1 15 (13.3) 2 (5.3) 5 (13.2) 8 (21.6)
2 45 (39.8) 10 (26.3) 16 (42.1) 19 (51.4)
3 53 (46.9) 26 (68.4) 17 (44.7) 10 (27.0)
IMR, index of microcirculatory resistance; QCA, quantitative coronary angiography; SD, standard deviation; RD, reference diameter; LAD, left anterior descend- ing artery; LCX, left circumflex artery; RCA, right coronary artery; GP IIb/IIIa, glycoprotein IIb/IIIa; ACC/AHA, American College of Cardiology/American Heart As- sociation; TIMI, Thrombolysis in Myocardial Infarction; TMPG, TIMI myocardial perfusion grade.
Table 3. Physiologic Parameters of Patients in the Different IMR Groups
Total (n=113) Low IMR (n=38) Mid IMR (n=38) High IMR (n=37) p value
Pa, mean±SD, mm Hg 84.40±17.87 81.61±12.71 88.11±18.14 83.46±21.57 0.266
Pd, mean±SD, mm Hg 77.21±16.85 73.29±13.53 81.21±16.32 77.14±19.72 0.122
FFR, mean±SD 0.92±0.06 0.90±0.08 0.92±0.05 0.93±0.06 0.093
Tmn at rest, mean±SD, sec 0.66±0.46 0.37±0.18 0.59±0.34* 1.01±0.54* <0.001
hTmn, mean±SD, sec 0.38±0.26 0.18±0.04 0.31±0.09* 0.66±0.27* <0.001
CFR, mean±SD 1.94±1.16 2.10±1.06 2.01±1.25 1.72±1.17 0.343
IMR, mean±SD, U 28.1±17.8 12.9±2.6 23.9±4.0 48.1±17.1 -
IMR, index of microcirculatory resistance; Pa, mean aortic pressure; SD, standard deviation; Pd, mean distal coronary pressure; FFR, fractional flow reserve; Tmn, mean transit time; hTmn, hyperemic mean transit time; CFR, coronary flow reserve.
*p<0.05 versus Low IMR by post hoc test by analysis of variance (ANOVA), Fisher’s exact.
Aging is an important factor contributing to atherosclerosis and arteriosclerosis.18 It has been reported that arterial aging is associated not only macrovascular resistance but also with im-
paired microcirculation due to the diminution of the capillary bed, which accompanies atrophy of subcutaneous and other tissues.18,19 The presence of structural alterations in the micro-
Table 4. Predictors Related to Increasing Index of Microcirculatory Resistance
OR 95% CI p value
Univariate regression analysis
Age, yr 1.065 1.022±1.108 0.020
Female 2.393 0.860±6.661 0.095
Hypertension 1.532 0.695±3.378 0.290
Diabetes 0.772 0.303±1.967 0.588
Dyslipidemia 0.970 0.401±2.345 0.946
Smoker 0.455 0.196±1.057 0.067
Door-to-balloon time, min 1.013 0.999±1.028 0.075
Symptom-onset-to-balloon time, min 1.007 1.002±1.011 0.002
Symptom-onset-to-balloon time≤180 min 0.229 0.097±0.540 0.001
Symptom-onset-to-balloon time>180 min 4.376 1.851±10.347 0.001
Proximal location of culprit lesion 1.812 0.817±4.020 0.144
Final TMPG 3 0.203 0.060±0.693 0.011
CK-MB peak, ng/mL 1.003 1.000±1.005 0.019
Multivariate regression analysis
Age 1.085 1.016±1.158 0.016
Symptom-onset-to-balloon time 1.007 1.001±1.014 0.018
Final TMPG 3 0.323 0.040±2.600 0.288
CK-MB peak, ng/mL 1.002 0.999±1.006 0.105
OR, odds ratio; CI, confidence interval; TIMI, thrombolysis in myocardial infarction; TMPG, TIMI myocardial perfusion grade; CK-MB, creatine kinase-myocardial band.
Fig. 2. Comparison of IMR according to clinical and angiographic factors. *The IMR of patients with symptom-onset-to-balloon time of >180 minutes was significantly higher than the IMR of those with a symptom-onset-to-balloon ≤180 minutes, †The IMR was significantly higher in proximal lesion than in non-proximal lesion, ‡The IMR was significantly higher in initial TIMI 0/1 group, as compared initial TIMI 2/3. IMR, index of microcirculatory resistance;
LAD, left anterior descending artery; LCX, left circumflex artery; RCA, right coronary artery; P, proximal location of culprit artery; NP, non-proximal location of culprit artery; TIMI, thrombolysis in myocardial infarction.
IMR, U
50
40
30
20
10
0
M F
p= 0.165 0.785 0.278 0.591 0.065 0.188 0.001 0.866 0.033 0.031 Gender
Hypertension Diabetes
Dyslipidemia Smoker
Door-to-balloon time, min
Symptom-onset-to-balloon time, min
Coronary territory Proximal culprit Initial TIMI
27.1 27.7
28.7 29.2 24.9
28.726.7 32.9
26.2 25.129.7 22.5
33.9 28.6
25.227.8 31.8
24.6 31.1
23.0 20.6 33.5
- + - + - + - + ≤60 >60 ≤180 >180 LAD LCX RCA P NP 0/1 2 3
‡
‡
* †
n= 95 18 63 50 85 28 82 31 33 80 39 74 57 56 80 9 24 56 57 77 18 18
circulation may be an important link to ischemic heart dis- ease.18,20 Most studies about IMR do not describe the relation- ships between age and IMR well. Our study suggests that aging may be related to impaired microcirculatory resistance, as esti- mated by IMR in patients with STEMI.
Coronary microvascular dysfunction in diabetes mellitus has been explained by various mechanisms of endothelial dys- function including insulin resistance, hyperglycemia, impaired vasodilatation, autonomic dysfunction, and inflammation.21,22 Our data did not show a significant difference between individ- ual IMR groups and diabetes mellitus. This may be due to the lack of adjusting for confounding factors such as medication, patient characteristics, and major risk factors, including hyper- tension, dyslipidemia, and smoking. The present data indicat- ed that the IMR values do not significantly differ according to the presence of diabetes, as well as according to the presence of major cardiovascular risk factors, such as hypertension, dys- lipidemia, and smoking. These results may be explained by the relatively small sample size of our study. In addition, as the IMR was measured shortly after the primary PCI, the angiographic- and procedure-related factors may have a greater effect on the IMR than classic cardiovascular risk factors.
Door-to-balloon time is associated with mortality in patients undergoing primary PCI for STEMI. Previous studies have shown a strong correlation between door-to-balloon time and clinical outcome.23-25 The ACC/AHA guidelines for the man- agement of patients with STEMI recommend a door-to-balloon time of ≤90 minutes.26 However, it has recently been reported that, despite reducing the door-to-balloon time from 83 min- utes to 67 minutes, there has been no significant change in in- hospital mortality and 30-day mortality.27 In our data, the door-to-balloon times were <90 minutes in all patients, and no significant differences in door-to-balloon time were noted be- tween the IMR groups. However, the symptom-onset-to-bal- loon time in the present study showed significant differences between individual IMR groups. Therefore, the IMR correlated well with the symptom-onset-to-balloon time but not the door- to-balloon time of <90 minutes. In multivariate analysis, age and symptom-onset-to-balloon time remained independent determinants for impaired microvascular resistance. This sug- gests that, in patients with a door-to-balloon time of <90 min- utes, decreasing the absolute door-to-balloon time does not affect the microvascular resistance in patients with STEMI.
Therefore, the symptom-onset-to-balloon time might be more important for determining microcirculatory resistance in STE- MI patients with a door-to-balloon time of <90 minutes.
Angiographic findings have been used as the classical pa- rameter for microvascular dysfunction. Coronary blood flow and microvascular integrity have been estimated by using TIMI and TMPG in many previous studies,4,28,29 and previous studies have shown that the final TIMI or TMPG score is related to mortality in patients with acute myocardial infarction.5 How- ever, there are some limitations due to inter-observer variation
since it is graded by visual estimation. In the present study, IMR was strongly correlated with TIMI and TMPG, as well as with the levels of cardiac biomarkers, such as peak CK, peak CK-MB, and peak troponin I. The achievement of the final TIMI 3 or TMPG 3 was much less frequent in the High IMR group than in the Low IMR group. These findings are consistent with previous studies that suggest that IMR predicts clinical out- come and prognosis.8,9,11,30-32 In contrast, the IMR requires less inter- and intra-observer variability than the visual estimation of the TIMI or TMPG system; therefore, IMR may be a more objective method for assessing microvascular dysfunction.
Some recent studies have shown that increased microvascu- lar resistance and dysfunction in patients with STEMI might lead to an alteration in flow dynamics associated with a small- er pressure drop through the culprit lesion. FFR would be over- estimated in this setting.33-35 Our data showed that the High IMR group tended to have a higher FFR than the Low IMR and Mid IMR groups, although the difference was not statistically significant.
To find out the relevant factors for microvascular dysfunction in STEMI, our study population was classified into three groups based on IMR value as tertiles. A definite cut-off value of IMR to determine LV recovery and clinical outcomes in STEMI pa- tients has not yet been established. However, it is interesting that our cut-off value (>31 U) for the High IMR group was simi- lar to suggested IMR values in previous studies on predicting myocardial dysfunction in STEMI patients.8,30 To apply the cut- off value of IMR for predicting a clinical outcome in STEMI pa- tients, further large-scaled studies may be needed in the future.
Murai, et al.36 reported that right coronary artery lesion loca- tion was significantly associated with increased IMR in patients with intermediate coronary artery lesions. Our data did not show significant differences in IMR according to culprit arter- ies. The proximal location of the culprit lesion in STEMI is asso- ciated with greater myocardial damage. It has been reported that patients with proximal culprit lesions are more likely to have a poorer clinical outcome and prognosis than patients with non-proximal culprit lesions.37 Proximal culprit lesions were found more frequently in the High IMR group than in the Low IMR group in the present study, and the mean IMR in pa- tients with proximal culprit lesions was significantly higher than that in patients with non-proximal culprit lesions. This suggests that a proximal location of culprit lesion might play an important role in deteriorating microcirculatory resistance in patients with STEMI.
The Thrombus Aspiration during Percutaneous coronary in- tervention in Acute myocardial infarction Study (TAPAS) dem- onstrated that aspiration of the thrombus before stenting seemed to improve 1-year clinical outcomes following primary PCI for STEMI.38 However, a recent study showed that, com- pared with PCI alone, routine thrombus aspiration before PCI did not reduce the 30-day mortality in patients with STEMI.39 In a recent randomized study, it was reported that thrombus
aspiration as an adjunctive therapy to primary PCI for STEMI may reduce IMR and have beneficial effects on myocardial microcirculation.40 Our data showed that thrombus aspiration was more frequent in the High IMR group, compared with the Low IMR group; however, the difference was not significant, although there may be an operator-dependent bias in the thrombus aspiration, which was determined by operator at the time of the primary PCI. Although the use of glycoprotein IIb/
IIIa inhibitor may reduce mortality in high-risk patients with STEMI,41 the use of glycoprotein IIb/IIIa inhibitors did not dif- fer between the IMR groups in the present study.
Study limitations
Our study consisted of a relatively small number of STEMI pa- tients who underwent primary PCI. Because patients with car- diogenic shock, prior myocardial infarction, and hemodynam- ic instability were excluded, our results may not represent all patients with STEMI. Moreover, this study is a retrospective analysis and was performed at a single center. We need more data and randomized control study to better understand de- terminants of microvascular dysfunction in STEMI patients.
The 113 study subjects were relatively small as a study group and most of our enrolled STEMI patients had mild LV systolic dysfunction or preserved LV function with a LVEF of approxi- mately 50%. Therefore, there were no significant differences in LVEF and WMSI among the IMR groups, although the High IMR group tended to have lower LVEF and higher WMSI than the Low and Mid IMR groups. If more patients presenting se- vere LV systolic dysfunction in STEMI patients were included, the differences of LVEF and WMSI might be clarified among the IMR groups. Furthermore, the present study was not per- formed using a randomization study protocol for intervention- al techniques and medications such as direct stenting, throm- bus aspiration, and glycoprotein IIb/IIIa inhibitors; therefore, it is possible that an operation-dependent bias may be present in these variables. These variables might play a role as con- founding factors. In the multivariate analysis, it would have been ideal to exclude all factors in order to avoid selection bias and confounding factors; however, this was not ensured in the pres- ent study, except for age, gender, comorbidities, lesion location, and symptom-onset-to-balloon time.
In conclusion, our study suggests that age, proximal location of the culprit vessel, and symptom-to-onset-balloon time are correlated with microvascular dysfunction estimated using IMR. In STEMI patients undergoing primary PCI with a door- to-balloon time of <90 minutes, age and symptom-onset-to- balloon time might be major predictors of microvascular dys- function.
REFERENCES
1. Herrmann J, Kaski JC, Lerman A. Coronary microvascular dysfunc- tion in the clinical setting: from mystery to reality. Eur Heart J
2012;33:2771-82b.
2. Fearon WF, Balsam LB, Farouque HM, Caffarelli AD, Robbins RC, Fitzgerald PJ, et al. Novel index for invasively assessing the coro- nary microcirculation. Circulation 2003;107:3129-32.
3. Leung DY, Leung M. Non-invasive/invasive imaging: significance and assessment of coronary microvascular dysfunction. Heart 2011;97:587-95.
4. Niccoli G, Burzotta F, Galiuto L, Crea F. Myocardial no-reflow in humans. J Am Coll Cardiol 2009;54:281-92.
5. Gibson CM, Cannon CP, Murphy SA, Ryan KA, Mesley R, Marble SJ, et al. Relationship of TIMI myocardial perfusion grade to mor- tality after administration of thrombolytic drugs. Circulation 2000;
101:125-30.
6. Wu KC, Zerhouni EA, Judd RM, Lugo-Olivieri CH, Barouch LA, Schulman SP, et al. Prognostic significance of microvascular ob- struction by magnetic resonance imaging in patients with acute myocardial infarction. Circulation 1998;97:765-72.
7. Herzog BA, Husmann L, Valenta I, Gaemperli O, Siegrist PT, Tay FM, et al. Long-term prognostic value of 13N-ammonia myocardi- al perfusion positron emission tomography added value of coro- nary flow reserve. J Am Coll Cardiol 2009;54:150-6.
8. Fearon WF, Shah M, Ng M, Brinton T, Wilson A, Tremmel JA, et al.
Predictive value of the index of microcirculatory resistance in pa- tients with ST-segment elevation myocardial infarction. J Am Coll Cardiol 2008;51:560-5.
9. McGeoch R, Watkins S, Berry C, Steedman T, Davie A, Byrne J, et al. The index of microcirculatory resistance measured acutely pre- dicts the extent and severity of myocardial infarction in patients with ST-segment elevation myocardial infarction. JACC Cardio- vasc Interv 2010;3:715-22.
10. Yoo SH, Yoo TK, Lim HS, Kim MY, Koh JH. Index of microcircula- tory resistance as predictor for microvascular functional recovery in patients with anterior myocardial infarction. J Korean Med Sci 2012;27:1044-50.
11. Fearon WF, Low AF, Yong AS, McGeoch R, Berry C, Shah MG, et al. Prognostic value of the Index of Microcirculatory Resistance measured after primary percutaneous coronary intervention. Cir- culation 2013;127:2436-41.
12. O’Gara PT, Kushner FG, Ascheim DD, Casey DE Jr, Chung MK, de Lemos JA, et al. 2013 ACCF/AHA guideline for the management of ST-elevation myocardial infarction: a report of the American College of Cardiology Foundation/American Heart Association Task Force on Practice Guidelines. Circulation 2013;127:e362-425.
13. Wilson RF, Wyche K, Christensen BV, Zimmer S, Laxson DD. Ef- fects of adenosine on human coronary arterial circulation. Circu- lation 1990;82:1595-606.
14. Pijls NH, De Bruyne B, Smith L, Aarnoudse W, Barbato E, Bar- tunek J, et al. Coronary thermodilution to assess flow reserve: val- idation in humans. Circulation 2002;105:2482-6.
15. Pijls NH, De Bruyne B, Peels K, Van Der Voort PH, Bonnier HJ, Bartunek J Koolen JJ, et al. Measurement of fractional flow reserve to assess the functional severity of coronary-artery stenoses. N Engl J Med 1996;334:1703-8.
16. De Bruyne B, Pijls NH, Smith L, Wievegg M, Heyndrickx GR. Cor- onary thermodilution to assess flow reserve: experimental valida- tion. Circulation 2001;104:2003-6.
17. Lang RM, Bierig M, Devereux RB, Flachskampf FA, Foster E, Pel- likka PA, et al. Recommendations for chamber quantification: a report from the American Society of Echocardiography’s Guide- lines and Standards Committee and the Chamber Quantification Writing Group, developed in conjunction with the European As- sociation of Echocardiography, a branch of the European Society of Cardiology. J Am Soc Echocardiogr 2005;18:1440-63.
18. O’Rourke MF. Arterial aging: pathophysiological principles. Vasc Med 2007;12:329-41.
19. Rizzoni D, Porteri E, Boari GE, De Ciuceis C, Sleiman I, Muiesan ML, et al. Prognostic significance of small-artery structure in hy- pertension. Circulation 2003;108:2230-5.
20. Safar ME. Peripheral pulse pressure, large arteries, and microves- sels. Hypertension 2004;44:121-2.
21. Potenza MA, Gagliardi S, Nacci C, Carratu’ MR, Montagnani M.
Endothelial dysfunction in diabetes: from mechanisms to thera- peutic targets. Curr Med Chem 2009;16:94-112.
22. Marciano C, Galderisi M, Gargiulo P, Acampa W, D’Amore C, Es- posito R, et al. Effects of type 2 diabetes mellitus on coronary mi- crovascular function and myocardial perfusion in patients without obstructive coronary artery disease. Eur J Nucl Med Mol Imaging 2012;39:1199-206.
23. Rathore SS, Curtis JP, Chen J, Wang Y, Nallamothu BK, Epstein AJ, et al. Association of door-to-balloon time and mortality in patients admitted to hospital with ST elevation myocardial infarction: na- tional cohort study. BMJ 2009;338:b1807.
24. McNamara RL, Wang Y, Herrin J, Curtis JP, Bradley EH, Magid DJ, et al. Effect of door-to-balloon time on mortality in patients with ST-segment elevation myocardial infarction. J Am Coll Cardiol 2006;
47:2180-6.
25. De Luca G, Suryapranata H, Ottervanger JP, Antman EM. Time de- lay to treatment and mortality in primary angioplasty for acute myocardial infarction: every minute of delay counts. Circulation 2004;109:1223-5.
26. O’Gara PT, Kushner FG, Ascheim DD, Casey DE Jr, Chung MK, de Lemos JA, et al. 2013 ACCF/AHA guideline for the management of ST-elevation myocardial infarction: executive summary: a report of the American College of Cardiology Foundation/American Heart Association Task Force on Practice Guidelines. Circulation 2013;127:529-55.
27. Menees DS, Peterson ED, Wang Y, Curtis JP, Messenger JC, Rums- feld JS, et al. Door-to-balloon time and mortality among patients undergoing primary PCI. N Engl J Med 2013;369:901-9.
28. Gibson CM, Schömig A. Coronary and myocardial angiography:
angiographic assessment of both epicardial and myocardial per- fusion. Circulation 2004;109:3096-105.
29. Angeja BG, Gunda M, Murphy SA, Sobel BE, Rundle AC, Syed M, et al. TIMI myocardial perfusion grade and ST segment resolution:
association with infarct size as assessed by single photon emis- sion computed tomography imaging. Circulation 2002;105:282-5.
30. Lim HS, Yoon MH, Tahk SJ, Yang HM, Choi BJ, Choi SY, et al. Use- fulness of the index of microcirculatory resistance for invasively as- sessing myocardial viability immediately after primary angioplasty for anterior myocardial infarction. Eur Heart J 2009;30:2854-60.
31. Byrne RA, Ndrepepa G, Braun S, Tiroch K, Mehilli J, Schulz S, et al.
Peak cardiac troponin-T level, scintigraphic myocardial infarct size and one-year prognosis in patients undergoing primary percuta- neous coronary intervention for acute myocardial infarction. Am J Cardiol 2010;106:1212-7.
32. Chin CT, Wang TY, Li S, Wiviott SD, deLemos JA, Kontos MC, et al.
Comparison of the prognostic value of peak creatine kinase-MB and troponin levels among patients with acute myocardial infarc- tion: a report from the Acute Coronary Treatment and Interven- tion Outcomes Network Registry-get with the guidelines. Clin Car- diol 2012;35:424-9.
33. Tamita K, Akasaka T, Takagi T, Yamamuro A, Yamabe K, Katayama M, et al. Effects of microvascular dysfunction on myocardial frac- tional flow reserve after percutaneous coronary intervention in patients with acute myocardial infarction. Catheter Cardiovasc In- terv 2002;57:452-9.
34. Ntalianis A, Sels JW, Davidavicius G, Tanaka N, Muller O, Trana C, et al. Fractional flow reserve for the assessment of nonculprit coro- nary artery stenoses in patients with acute myocardial infarction.
JACC Cardiovasc Interv 2010;3:1274-81.
35. Gibson CM, Pinto D. Fractional flow reserve: a new set of lenses for the occulostenotic reflex? JACC Cardiovasc Interv 2010;3:1282-3.
36. Murai T, Lee T, Yonetsu T, Iwai T, Takagi T, Hishikari K, et al. Vari- ability of microcirculatory resistance index and its relationship with fractional flow reserve in patients with intermediate coronary artery lesions. Circ J 2013;77:1769-76.
37. Harjai KJ, Mehta RH, Stone GW, Boura JA, Grines L, Brodie BR, et al. Does proximal location of culprit lesion confer worse prognosis in patients undergoing primary percutaneous coronary interven- tion for ST elevation myocardial infarction? J Interv Cardiol 2006;
19:285-94.
38. Vlaar PJ, Svilaas T, van der Horst IC, Diercks GF, Fokkema ML, de Smet BJ, et al. Cardiac death and reinfarction after 1 year in the Thrombus Aspiration during Percutaneous coronary intervention in Acute myocardial infarction Study (TAPAS): a 1-year follow-up study. Lancet 2008;371:1915-20.
39. Fröbert O, Lagerqvist B, Olivecrona GK, Omerovic E, Gudnason T, Maeng M, et al. Thrombus aspiration during ST-segment elevation myocardial infarction. N Engl J Med 2013;369:1587-97.
40. Woo SI, Park SD, Kim DH, Kwan J, Shin SH, Park KS, et al. Throm- bus aspiration during primary percutaneous coronary interven- tion for preserving the index of microcirculatory resistance: a ran- domised study. EuroIntervention 2014;9:1057-62.
41. Sethi A, Bajaj A, Bahekar A, Bhuriya R, Singh M, Ahmed A, et al.
Glycoprotein IIb/IIIa inhibitors with or without thienopyridine pretreatment improve outcomes after primary percutaneous cor- onary intervention in high-risk patients with ST elevation myocar- dial infarction--a meta-regression of randomized controlled trials.
Catheter Cardiovasc Interv 2013;82:171-81.