Original Article
pISSN 2233-9019 · eISSN 2233-9116
Korean J Fam Pract. 2015;5(3, suppl. 2):604-609
KJFP
Korean Journal of Family Practicewww.kafm.or.kr
605 604
www.kafm.or.kr서 론
비만은 전 세계적으로 여러 노력을 하고 있으나 그 유병률은 점점 높아져 가고 있다.1) 비만은 삶의 질을 떨어뜨릴 뿐 아니라 이상 지질 혈증, 당뇨, 고혈압과 같은 대표적인 질환 뿐만 아니라 기타 만성 질 환과 심혈관 질환 및 암의 위험인자로 알려져 있다.2, 3) 비만의 원인 으로 고지방 식이 및 고탄수화물 식이를 기반으로 한 칼로리의 섭취 및 신체활동 감소가 그 원인으로 생각되고 있다. 이러한 잘못된 생 활 습관을 개선하기 위해서는 흡연, 음주, 운동부족과 같은 생활습 관 교정 뿐만 아니라 올바른 영양 섭취가 중요하다.4, 5) 비만 치료를 위한 영양 섭취의 개선은 총 섭취열량의 감소, 저지방, 저탄수화물
식이를 기반으로 하고 있으며, 이를 위해 올바른 식이 교육이 필요
하다.6, 7) 이를 위해 여러 나라에서 식품의 영양표시 제도를 시행하고
있으며,8) 한국에서도 ‘식품위생법’에 따라 식품의
1
회 제공량에 대한 영양소 함량과 영양소 기준치,9
가지 의무 표시 영양소(열량, 탄수화 물, 단백질, 포화지방, 트랜스지방, 콜레스테롤, 나트륨, 기타)를 제 품에 표기하고 있다.9) 이러한 영양소 표시의 사용은 젊은 연령, 높은 사회경제적 지표에서 높게 나타나며, 기저 질환 등 여러 요인에 따라 영향을 받는다고 알려져 있다.10, 11) 한국의 한 연구에서는 이러한 영 양표시의 사용이 대사 증후군의 발생 감소와 관련이 있다고 보고 하 였다.12)이에 본 연구에서는 비만의 측정 방법 중 하나인 총지방으로 본
총 신체 체지방과 영양표시 사용의 연관성:
제 5기 국민건강영양자료 2010~2011
방명희, 이창윤, 김지현, 조경환, 김양현
*고려대학교 의료원 가정의학과
The percentage of total body fat and nutrition label use in Korean Adults: The Fifth Korea National Health and Nutrition Examination Survey 2010~2011(KNHANES V)
Myung Hee Bang, Chang Yun Lee, Ji Hyeon Kim, Kyung-Hwan Cho, Yang Hyeon Kim
* Department of Family Medicine, Korea University School of Medicine, Seoul, KoreaBackground: Proper recognition and analysis of nutrition labels is one of the most important strategic approaches to eating healthily. This study examined the relationship between the total body fat and nutrition label use in the 2010~2011 Korea National Health and Nutrition Examination Survey(KNHANES).
Methods: A total of 11,827 subjects(4,905 men and 6,922 women) participated in the study. Subjects were divided into 3 groups by gender, non-recognition of nutrition label(NR), recognition but non-use of nutrition label(RNU), and recognition and use of nutrition label(RU). Nutrition label use was assessed by a self-questionnaire included in the KNHANES.
Multivariable logistic regression analysis was used to examine the relationship between total body fat and nutrition label use.
Results: The relationship between nutrition label use and total body fat differed according to gender. After adjusting for age, household income, education level, nutrition education, smoking, drinking, and regular exercise, nutrition label use showed a statistically significant relationship with prevalence of obesity, as indicated by total body fat.
Conclusion: Prevalence of obesity was associated with nutrition label use in Korean men. Therefore, a nutritional education program should be implemented in order to instruct consumers on proper use of nutrition labels.
Keywords: Obesity, Total body fat, Nutrition label, Korea National Health and Nutrition Examination Survey
Received August 24, 2015 Revised August 24, 2015 Accepted September 7, 2015 Corresponding Author Yang Hyeon Kim
Tel: +82-2-920-5027 E-mail: [email protected]
Copyright © 2015 The Korean Academy of Family Medicine
This is an open-access article distributed under the terms of the Creative Commons Attribution Non-Commercial License (http://creativecommons.org/licenses/by-nc/3.0) which permits unrestricted noncommercial use, distribution, and reproduction in any medium, provided the original work is properly cited.
비만 유병률과 영양 표시 이용과의 관계를 전체 한국인을 대상으로 알아보았다.
방 법
1. 연구대상
국민건강영양조사(
KNHANES
) 제5
기1
차,2
차년도(2010
년~
2011
년)에서 만19
세 이상의 성인12
,575
명(남자5
.395
명, 여자7
,180
명)을 본 연구대상으로 선정하였으며, 영양표시에 대한 질문 (인식, 이용 문항)에 답하지 않은 대상자를 제외하여 총11
,827
명 (남자4
,905
명, 여자6
,922
명)을 연구에 포함시켰다.2. 인구-사회학적 요인
국민건강영양조사 설문지를 이용하여 영양표시 인식과 연령, 성 별, 가계수입수준, 교육수준, 배우자 유무, 직업의 유무, 거주지의 상관관계를 분석하였다. 가계수입수준은 가족의 수를 보정하여
4
분 위로 계산하였으며 교육수준은 초졸 이하, 중졸, 고졸, 대졸이상으 로 분류하여 분석하였다. 배우자와 직업은 유무로 나누어 분석하였 고 거주지역은 도시와 지방으로 나누어 분석하였다.3. 일반 건강 행태 요인
일반 건강 행태로는 현재 흡연 유무, 음주 유무, 주기적 운동 유 무를 작성된 설문지를 이용하여 분석하였다. 현재 흡연자는 최근 흡연을 지속하고
100
개피 이상을 담배를 흡연한 자로 정의하였으 며, 고위험 음주자는 하루30g
이상의 알코올을 섭취하는 자로 정의 하였다. 규칙적인 운동은 주5
회 이상 증등도의 강도로30
분 이상 운동을 하는 자 또는 주3
회 이상 격렬한 운동을20
분 이상 하는 자 로 정의하여 분석에 이용하였다.4. 신체 계측과 총 지방량 측정
훈련된 신체 계측자로부터 체중(
Kg
)과 신장(m
)을 특정하였 다. 총 지방량은whole
-body DEXA
(QDR 4500A fan
-beam densitometer
,Hologic Inc
.,Bedford
,MA
)를 이용하여 측정하고 한국 골다공증학회의Hologic Discovery Software
(version 13
.1
,Hologic Inc
.,Bedford
,MA
)를 이용한 표준 방법에 의해 분석하 였다. 총 지방량은 다음 공식을 이용하여 계산하였으며Total body fat percentage
(pTBF
):total body fat mass
/total body mass
(fat mass
±lean mass
±total body mineral content
) *100
. 총 지방량 을 통한 비만의 기준은 남성은pTBF
>25
%, 여성은pTBF
>32
%로 정하여 분석하였다.5. 영양 섭취 조사와 영양 표시 인식
국민건강영양조사의 영양조사 부분 중
24
시간 회상법을 통한 영 양소 섭취 기록을 분석하여1
일 영양소 섭취량을 분석하였으며, ‘영 양표시를 알고 계십니까?’, ‘가공식품을 사거나 고를 때 영양표시를 읽으십니까?’’ 에 대한 답변을 이용하여 ‘영양표시를 알지 못하는 그 룹(NR
)’, ‘영양표시를 알고 있으나 사용하지 않는 그룹(RNU
)’, ‘영 양표시를 알고 있고 사용하는 그룹(RU
)’으로 나누어 비만과의 연관 성을 분석하였고 ‘영양표시 항목에서 가장 관심 있게 보는 영양소는 무엇입니까?; 질문을 이용하여 영양표시 사용 그룹에서 관심 있는 영양소를 정상과 비만군으로 나누어 분석하였다.6. 통계분석
연구 결과의 통계 분석을 위하여
SAS university version
을 사 용하였으며 국민건강영양조사시 사용된 각 개인별 가중치를 적 용하여 집착 추출 변수(Psu
), 분산 추정치(Kstrata
)를 이용한 통 계처리 하였다. 영양표시 사용에 따른 대상자의 기본적인 특성은chi
-square test
와t
-test
를 이용하여 평균과 표준오차 또는 백분 율을 사용하여 제시하였으며, 다중회귀 분석(Multivariate logistic regression analyses
)을 통해odds ratios
(ORs
)and 95
%confidence index
(CI
) 로 영양표시와 총 체지방량과의 관련성을 분석하였다.모든 분석에서 유의수준은
p
<0
.05
로 하였다.결 과
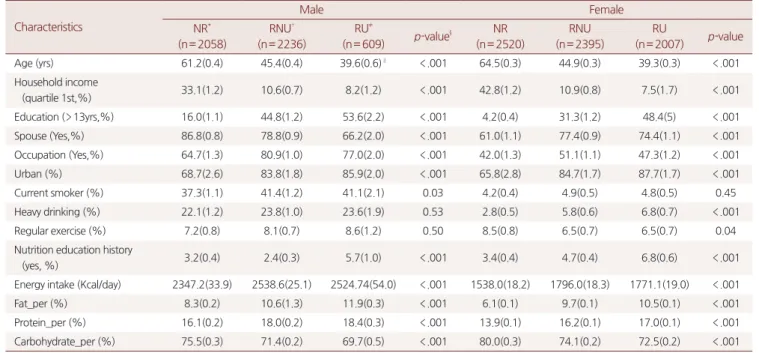
연구 대상자들의 성별에 따른 영양표시 인지 및 이용에 따른 일 반적 특성을 표
1
에 제시하였다. 남성과 여성 대상자 모두 공통적으 로NR
그룹에 비하여RU
그룹에서 대상군의 평균 연령이 유의적으 로 감소하였으며, 가계소득 수준과 교육 수준이 증가하였으며, 도 시 거주자와 영양교육을 받은 과거력이 있는 대상자의 비율이 증가 하였다. 차이점으로는 남성의 경우 배우자가 있다고 응답한 비율이NR
군에서 가장 높게 나타났으나(86
.8
%), 여성의 경우RNU
군에 서 가장 높게 나타났다(77
.4
%). 영양섭취 조사에서는 남녀 모두NR
군에서 에너지 섭취량이 가장 낮게 나타났으며(2347
.2Kcal
/day
,1538
.0Kcal
/day
)RNU
에 비하여RU
군에서 에너지 섭취량은 감소 하였으나 지방과 단백질의 비율이 증가하고 당류의 비율은NR
군 에 비하여RU
군에서 모두 유의적으로 감소하는 것으로 나타났다 (P
<0
.001
).Table 2
에서는 대상자를 성별로 나누어 남자pTBF 25
% 이상, 여 자32
%이상을 기준으로 한 비만의 유병률을 영양 표시인지 및 활 용에 따라 알아보았다. 남성비만의 경우RNU
군의 비율이 가장 높 았으며(48
%),RU
군에서 크게 감소하는 것으로 나타났다(14
.7
%), 여성에서도 비만의 유병률은RNU
(36
.3
%)군에서 가장 높았고606
www.kafm.or.krMyung Hee Bang, et al. The percentage of total body fat and nutrition label use in Korean Adults:
The Fifth Korea National Health and Nutrition Examination Survey 2010~2011(KNHANES V)
Korean Journal of Family Practice
KJFP
Korean J Fam Pract. 2015;5(3, suppl. 2):604-609
RU
(32
.6
%)로 남성에 비해 영양표시 사용 비율은 높은 것으로 나타 났다(14
.7
%vs 32
.6
%).Table 3
에서는 다중 회귀분석을 이용하여 연령, 경제수준, 교육 수준, 영양교육 유뮤, 건강 행태등을보정하여 영양표시 사용이 총 체지방량으로 본 비만 유병률과 통계적 관련이 있는지를 분석하였 다. 여성에서는 모든 그룹에서 변수 보정에 따라 체지방량에 따른 비만 유병률과 관련이 없었으나, 남성에서는RNU
군에서 모든 변 수를 보정한 후에RU
군에 비해서39
% 정도 비만유병이 더 증가하 는 것으로 나타났다(OR 1
.39 and 95
%CI 1
.05
~1
.84
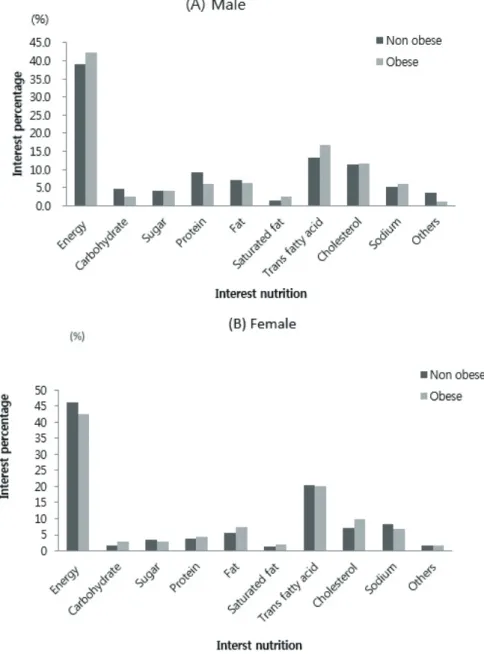
).Figure 1
에서는 영양표시를 사용한다고 답한 대상자(RU
군) 중비 만군과 정상군에서 영양표시 중 관심 영양소의 차이가 있는지 분석하였다. 국민건강영양조사 설문지 상의 관심 영양소
10
가지를 전체 백분율로 나누어 정상과 비만의 경우 관심도를 살펴보았다. 남성의 경우 정상에 비해 비만군에서 에너지와 트랜스 지방, 포화지방산, 나트륨의 관심도가 증가하였으나 당류와 단백질에 대한 관심도는 감소된 것으로 나타났다. 여성의 경우에는 정상군에 비해 비만군에 서 당류과 지방, 콜레스테롤, 포화지방산의 관심도는 증가하였으나 에너지, 당류, 나트륨에 대한 관심도는 감소하는 것으로 나타났다.위 결과로 남녀가 관심 있는 영양소의 차이를 보이고 비만과 관련된 에너지, 당류, 지방에 대해 남성의 경우 에너지에 대한 관심만 증가 하였고, 여성은 에너지에 대한 관심도가 오히려 감소된 것으로 나 타났다.
Table 1. General characteristics of study participants
Characteristics
Male Female
NR* (n= 2058)
RNU† (n= 2236)
RU≠
(n= 609) p-value§ NR (n= 2520)
RNU (n= 2395)
RU
(n= 2007) p-value
Age (yrs) 61.2(0.4) 45.4(0.4) 39.6(0.6)‖ <.001 64.5(0.3) 44.9(0.3) 39.3(0.3) <.001
Household income
(quartile 1st,%) 33.1(1.2) 10.6(0.7) 8.2(1.2) <.001 42.8(1.2) 10.9(0.8) 7.5(1.7) <.001
Education (>13yrs,%) 16.0(1.1) 44.8(1.2) 53.6(2.2) <.001 4.2(0.4) 31.3(1.2) 48.4(5) <.001
Spouse (Yes,%) 86.8(0.8) 78.8(0.9) 66.2(2.0) <.001 61.0(1.1) 77.4(0.9) 74.4(1.1) <.001
Occupation (Yes,%) 64.7(1.3) 80.9(1.0) 77.0(2.0) <.001 42.0(1.3) 51.1(1.1) 47.3(1.2) <.001
Urban (%) 68.7(2.6) 83.8(1.8) 85.9(2.0) <.001 65.8(2.8) 84.7(1.7) 87.7(1.7) <.001
Current smoker (%) 37.3(1.1) 41.4(1.2) 41.1(2.1) 0.03 4.2(0.4) 4.9(0.5) 4.8(0.5) 0.45
Heavy drinking (%) 22.1(1.2) 23.8(1.0) 23.6(1.9) 0.53 2.8(0.5) 5.8(0.6) 6.8(0.7) <.001
Regular exercise (%) 7.2(0.8) 8.1(0.7) 8.6(1.2) 0.50 8.5(0.8) 6.5(0.7) 6.5(0.7) 0.04
Nutrition education history
(yes, %) 3.2(0.4) 2.4(0.3) 5.7(1.0) <.001 3.4(0.4) 4.7(0.4) 6.8(0.6) <.001
Energy intake (Kcal/day) 2347.2(33.9) 2538.6(25.1) 2524.74(54.0) <.001 1538.0(18.2) 1796.0(18.3) 1771.1(19.0) <.001
Fat_per (%) 8.3(0.2) 10.6(1.3) 11.9(0.3) <.001 6.1(0.1) 9.7(0.1) 10.5(0.1) <.001
Protein_per (%) 16.1(0.2) 18.0(0.2) 18.4(0.3) <.001 13.9(0.1) 16.2(0.1) 17.0(0.1) <.001
Carbohydrate_per (%) 75.5(0.3) 71.4(0.2) 69.7(0.5) <.001 80.0(0.3) 74.1(0.2) 72.5(0.2) <.001
* NR: non-recognition of nutrition label
† RNU: recognition but non-use of nutrition label
≠ RU: recognition and use of nutrition label
§ P values were obtained by chi-square test for categorical variables.
‖ Data are presented as Mean±SE or percentages(%)
Table 2. Obesity percentage by the definition of total body fat according to the nutrition labels
Characteristics Male Female
NR* RNU† RU≠ p-value§ NR RNU RU p-value
pTBF¶ 37.1(1.3)‖ 48.0(1.2) 14.7(0.8) 0.01 31.0(1.5) 36.3(1.3) 32.6(1.3) <0.001
* NR: non-recognition of nutrition label
† RNU: recognition but non-use of nutrition label
≠ RU: recognition and use of nutrition label
§ P values were obtained by chi-square test for categorical variables
‖ Data are presented as Mean±SE or percentages (%)
¶ pTBF: percentage of total body fat: percentage of total body fat was calculated as follows
: total body fat mass/total body mass(fat mass + lean mass + total body mineral content) *100. (Male>25%, Female>32%)
Table 3. Subject characteristic according to awareness of nutrition labels by obesity prevalence in adults
Characteristics
Male Female
NR* OR(95% CI)
RNU† OR(95% CI) §
RU≠
OR(95% CI)
NR OR(95% CI)
RNU OR (95% CI)
RU OR (95% CI)
Model 1 1.04(0.80-1.35) 1.15(0.93-1.42) 1 0.82(0.64-1.04) 0.89(0.74-1.06) 1
Model 2 1.07(0.81-1.40) 1.14(0.89-1.44) 1 0.83(0.65-1.08) 0.93(0.76-1.11) 1
Model 3 1.32(0.96-1.81) 1.39(1.05-1.84) 1 0.83(0.60-1.15) 0.91(0.72-1.14) 1
* NR: non-recognition of nutrition label
† RNU: recognition but non-use of nutrition label
≠ RU: recognition and use of nutrition label
§ OR (95% CI) (Odd ratio(95 % confidence index)) were obtained by multivariable logistic regression analysis compared to RU Model 1 is adjusted for age.
Model 2 is adjusted for model 1 plus household-income, education and nutrition education Model 3 is adjusted for model 2 plus current smoking, heavy drinking and regular exercise
Figure 1. Interest nutrient in nutrition label between non-obese and obese participants in RU group. (A) Male, (B) Female.
The participants who responded to use nutrition label(RU group), select the one interest nutrient in nutrition labeling, and analyzed in order to compare sex and obesity and normal (A): results of male, (B): results of female
608
www.kafm.or.krMyung Hee Bang, et al. The percentage of total body fat and nutrition label use in Korean Adults:
The Fifth Korea National Health and Nutrition Examination Survey 2010~2011(KNHANES V)
Korean Journal of Family Practice
KJFP
Korean J Fam Pract. 2015;5(3, suppl. 2):604-609
고 찰
본 연구에서는 국민건강영양조사를 토대로 영양표시 사용과 총 체지방으로 본 비만의 유병률에 관한 연관성을 분석하였다. 남성은 전체 대상자 중
RNU
군의 비율이48
%로 가장 높게 나타났으며 그 이유로 남성은 여성에 비해 보통 만들어진 식품이나 가공식품의 섭 취가 높기 때문1, 13)에 영양 표시에 따른 관심이 높은 것으로 보여진 다. 하지만, 대상자 중RU
군의 비율이15
.5
%로 실제로 이러한 관심 이 음식을 주문하고 섭취하는 데에는 영향을 미치지 못하고, 그 결 과로 영양표시를 사용하는 그룹에 비해 영양표시를 사용하지 않는 그룹에서 유의적으로 비만 유병률이 증가하는 것으로 생각할 수 있 으며, 이는 다른 연구들의 결과14, 15)와 비슷하다. 여성 비만인의 경 우 영양표시 인지 비율은 남성보다 낮으나 영양표시 사용하는 비율 이 남성보다2
배 가량 높게 나타났으며, 이는 남성보다 여성에서 체 중에 대한 관심이 높고, 여성의 경우 영양표시를 사용하는 것이 좀 더 건강한 식품 정보를 얻을 수 있다는 믿음이 크게 작용하는 것으 로 보여진다.16, 17) 그러나 여성의 경우 체지방으로 본 비만 유병률과 영양표시 사용간에서는 유의적 상관성이 없는 것으로 나타났으며, 이는 체지방량으로만 측정한 비만의 측정 방법의 제한성이 있으며, 실제 식품 섭취량에 대한 분석이 추가로 필요할 것으로 보인다.영 양 표시 사용은 선행연구들에서18,19) 지방의 섭취를 감소 시키고, 총 열량섭취 감소 효과를 보인다고 하였으나 본 연구에서는 영양표시 사용에 따라 총 열량 감소 효과와 지방 섭취 감소 효과는 보이지 않 았으며, 오히려 지방이나 칼로리 섭취가 영양표시를 인지하거나 실 천하는 군에서 높음을 알 수 있었다. 이는 영양표시 사용 유무에 따 른 각 군의 평균 연령의 유의적 차이에 기인하는 것으로 볼 수 있으 며, 영양표시 사용 그룹에서 탄수화물의 섭취 비율이 감소하고 단 백질의 섭취비율은 증가하여 영양표시 사용이 영양소 섭취 비율에 는 영향을 미치는 것으로 볼 수 있으며, 영양 표시 사용하는 그룹에 서 좀 더 건강한 식품을 구매하고 섭취한다는 연구와 비슷하다고 볼 수 있겠다.20)본 연구에서 남성의 경우에 한하기는 하나 영양표시 사용이 비만 유병률에 영향을 미치는 것으로 나타나 영양표시 사용이 비만을 개 선하기 위한 방법으로 사용될 수 있음을 확인하였으며 좀 더 적극적 인 활용을 위해서 영양표시 사용을 위한 교육이 좀 더 필요할 것으 로 보인다.
이 연구는 단면연구로 영양표시 인지와 체지방량의 증가와의 인 과관계를 알기 어렵고, 실제 식사량과 영양소 섭취량, 외식이나 가 공식품의 섭취가 얼마나 되는지를 알기 어려운 단점이 있다. 하지 만, 대규모의 국민건강영양조사를 사용하여 한국 전체 인구를 대상 으로 남녀 체지방률과 이를 통한 비만의 유병률을 영양표시 사용을 통해 알아본 최초의 연구로 그 의미가 있다고 할 수 있다.
요 약
연구배경: 비만 교정에 있어, 영양표시의 인지는 건강한 식품을 선 택하는 중요한 방법 중 하나이다. 이 연구는
2010
~2011
년 국민건 강영양조사(KNHANES
)를 이용하여 총 체지방과 영양표시 사용의 연관관계를 연구하였다.방법: 총
11
,827
명의 대상자(남성4
,905
명과 여성6
,922
명)를 연 구하였다. 대상자는 성별로 분류하고 영양표시 인지하지 않는 군 (NR
), 영양표시를 인지는 하나 사용하지 않는 군(RNU
), 그리고 영 양표시를 사용하는 군(RU
)로3
군으로 나누었다. 영양표시 사용은KNHANES
에 포함된 설문지를 사용하였으며 상관관계 분석을 위 해 다중회귀분석을 이용하였다.결과: 영양표시 사용과 비만의 상관관계는 성별에 따라 차이를 보 였다. 연령, 소득수준, 교육수준,영양교육, 건강 형태를 보정한 후 남성에서 영양표시 사용과 체지방으로 정의된 비만의 유병률간의 상관관계를 보였다.
결론: 이 연구를 통하여 남성에서 영양표시의 사용과 비만 유병률 을 낮출 수 있음을 확인하였으며, 영양표시의 적극적 사용을 위한 올바른 영양 표시 사용을을 위한 영양교육이 필요하겠다.
중심단어: 총 체지방, 비만, 영양표시, 한국국민건강영양조사
REFERENCES
1. Lagerros YT, Rössner S. Obesity management: what brings success?
Therapeutic Advances in Gastroenterology 2013;6:77-88.
2. Zapico AG, Benito PJ, González-Gross M, Peinado AB, Morencos E, Romero B, et al. Nutrition and physical activity programs for obesity treatment (PRONAF study): methodological approach of the project. BMC Public Health 2012;12:1100-.
3. Wirth A, Wabitsch M, Hauner H. The Prevention and Treatment of Obesity. Deutsches Ärzteblatt International 2014;111:705-13.
4. Mesas AE, Guallar-Castillon P, Leon-Munoz LM, Graciani A, Lopez-Garcia E, Gutierrez-Fisac JL, et al. Obesity-related eating behaviors are associated with low physical activity and poor diet quality in Spain. J Nutr 2012;142:1321-8.
5. Ness-Abramof R, Apovian CM. Diet modification for treatment and prevention of obesity. Endocrine 2006;29:5-9.
6. Wirth A, Wabitsch M, Hauner H. The prevention and treatment of obesity. Dtsch Arztebl Int 2014;111:705-13.
7. Safer DJ. Diet, behavior modification, and exercise: a review of obesity treatments from a long-term perspective. South Med J 1991;84:1470-4.
8. Graham DJ, Laska MN. Nutrition label use partially mediates the relationship between attitude toward healthy eating and overall dietary quality among college students. J Acad Nutr Diet 2012;112:414-8.
9. Food labeling regulations. Ministry of Health and Welfare (KR).
1995.
10. Roberto CA, Khandpur N. Improving the design of nutrition labels to promote healthier food choices and reasonable portion sizes. Int J Obes (Lond) 2014;38 Suppl 1:S25-33.
11. Variyam JN. Do nutrition labels improve dietary outcomes? Health Econ 2008;17:695-708.
12. Kang HT, Shim JY, Lee YJ, Linton JA, Park BJ, Lee HR. Reading nutrition labels is associated with a lower risk of metabolic syndrome in Korean adults: The 2007–2008 Korean NHANES.
Nutrition, Metabolism and Cardiovascular Diseases;23:876-82.
13. Kim MG, Oh SW, Han NR, Song DJ, Um JY, Bae SH, et al.
Association between Nutrition Label Reading and Nutrient Intake in Korean Adults: Korea National Health and Nutritional Examination Survey, 2007-2009 (KNHANES IV). Korean J Fam Med 2014;35:190-8.
14. Kiszko K, Martinez O, Abrams C, Elbel B. The Influence of Calorie
Labeling on Food Orders and Consumption: A Review of the Literature. Journal of Community Health 2014;39:1248-69.
15. Elbel B, Mijanovich T, Dixon LB, Abrams C, Weitzman B, Kersh R, et al. Calorie labeling, Fast food purchasing and restaurant visits.
Obesity 2013;21:2172-9.
16. Jung JY, Kim MJ. Using and Understanding of Nutrition Labels and Related Factors among Female Adults in the Seoul Area. Korean Journal of Community Nutrition 2007;12:417-25.
17. Neuhouser ML, Kristal AR, Patterson RE. Use Of Food Nutrition Labels is Associated with Lower Fat Intake. Journal of the American Dietetic Association 1999;99:45-53.
19. Ollberding NJ, Wolf RL, Contento I. Food Label Use and Its Relation to Dietary Intake among US Adults. Journal of the American Dietetic Association 2010;110:1233-7.
19. Temple JL, Johnson K, Recupero K, Suders H. Nutrition labels decrease energy intake in adults consuming lunch in the laboratory.
J Am Diet Assoc 2011;111:S52-5.
20. Thorndike AN, Riis J, Sonnenberg LM, Levy DE. Traffic-light labels and choice architecture: promoting healthy food choices. Am J Prev Med. 2014;46:143-9