ISSN 2234-3806 • eISSN 2234-3814
190 www.annlabmed.org http://dx.doi.org/10.3343/alm.2013.33.3.190 Ann Lab Med 2013;33:190-192
http://dx.doi.org/10.3343/alm.2013.33.3.190
Brief Communication
Clinical Chemistry
Analysis of the Stability of Urea in Dried Blood Spots Collected and Stored on Filter Paper
Rizwana Quraishi, Ph.D.1, Ramakrishnan Lakshmy, Ph.D.2, Ashok Kumar Mukhopadhyay, M.D.3, and Bansi Lal Jailkhani, Ph.D.4
National Drug Dependence Treatment Centre1, Department of Psychiatry, All Indian Institute of Medical Sciences (AIIMS); Department of Cardiac Biochemistry2, Cardio-Neuro Centre, AIIMS; Department of Laboratory Medicine3, AIIMS; North-East Region, Biotechnology Programme Management Cell, Department of Biotechnology4, New Delhi, India
The ability to use dry blood spots (DBSs) on filter paper for the analysis of urea levels could be an important diagnostic tool for areas that have limited access to laboratory facili- ties. We developed a method for the extraction and quantification of urea from DBSs that were stored on 3M Whatman filter paper and investigated the effect of long-term storage on the level of urea in DBSs. DBSs of 4.5 mm in diameter were used for our assay, and we determined the urea levels in blood using a commercially available enzymatic kit (UV GLDH-method; Randox laboratories Ltd., UK). The DBSs on filter discs were stored at 4°C or at 37°C for 120 days. The mean intra- and inter-assay coefficient of variance for our method of urea extraction from dried blood was 4.2% and 6.3%, respectively. We collect- ed 75 fresh blood samples and compared the urea content of each fresh sample with the urea content of DBSs taken from corresponding fresh blood samples. Regression analysis reported a regression coefficient (r) value of 0.97 and a recovery of urea from dried spots was 102.2%. Urea concentrations in DBSs were stable for up to 120 and 90 days when stored at 4°C and 37°C, respectively. Our results show that urea can be stored and quanti- tatively recovered from small volumes of blood that was collected on filter paper.
Key Words: Urea, Filter Paper, Dried blood spot, Stability
Received: October 26, 2012
Revision received: December 17, 2012 Accepted: February 16, 2013
Corresponding author: Rizwana Quraishi National Drug Dependence Treatment Centre, Department of Psychiatry, All Indian Institute of Medical Sciences (AIIMS), New Delhi 110029, India
Tel: +91-11-26593236 Fax: +91-120-2788979
E-mail: [email protected]
© The Korean Society for Laboratory Medicine.
This is an Open Access article distributed under the terms of the Creative Commons Attribution Non-Commercial License (http://creativecom- mons.org/licenses/by-nc/3.0) which permits unrestricted non-commercial use, distribution, and reproduction in any medium, provided the original work is properly cited.
Many epidemiological studies and screening programmes over- come the problems associated with the transportation of physio- logical specimens by using filter paper as a matrix for the collec- tion and storage of cellular tissue and body fluids [1-6]. The ability to store dried blood for later analysis would be a valuable diagnostic tool in areas that have limited access to laboratory fa- cilities. We investigated the clinical usefulness and stability of urea in dried blood specimens collected and stored on filter pa- per. The study was given ethical clearance by the institutional ethics committee.
We collected 75 blood samples that were kept in anti-coagu- lant-coated vacutainers (for one hour) from the outpatient col- lection counter at the Laboratory Medicine, All India Institute of Medical Sciences (AIIMS). An aliquot of each of the blood sam-
ples was immediately analyzed for urea levels, while the remain- der of the blood was used for spotting on filter paper. We gener- ated multiple spots by dripping single drops of blood (~10 μL) on 3M Whatman filter paper (Whatman International Ltd., Maid- stone, UK). After the blood spots dried, the filter paper discs were stored in low-gas-permeable, zip-lock plastic bags and stored at 37˚C or at 4˚C.
We tested the efficacy of (1) phosphate buffer saline with 1% Tween (PBST), (2) 0.9% sodium chloride, and (3) 5% trichlolro- acetic acid (TCA) for the extraction of urea from the dried blood spots (DBSs). For this, one 4.5-mm diameter disc was punched with a manual punch, out of a DBS, and each disc was placed in an uncoated microtiter plate well. Each well was filled with 100 µL of one of the extraction agents, and the plate was incu-
Quraishi R, et al.
Stability of urea in dried blood spots
191
http://dx.doi.org/10.3343/alm.2013.33.3.190 www.annlabmed.org
bated overnight (for 10-12 hr) at 4˚C. The microtiter plates were placed on an environ shaker (Lab Line Inc., Melrose Park, IL, USA), and the contents mixed at 100 rpm for 1 hour before, and for 1 hr after incubation.
In this study, 5% TCA was the best agent for urea extraction without elution of hemoglobin. Urea analysis was performed us- ing a commercially available kit (UV GLDH-method; Randox laboratories Ltd., Crumlin, UK) [7]. For urea estimation, plasma was added to the urease reagent in the phosphate buffer. The final absorbance was read at 600 nm (OD600) on a spectropho- tometer (Spectronic Instruments Inc., Rochester, NY, USA). For dried blood urea estimation, 50 µL of the extract was added to the commercially available enzymatic reagent (Randox; Randox laboratories Ltd., Crumlin, UK). The reaction mixture was stirred and incubated at 37˚C for 15 min and measured at 600 nm us- ing a whole-blood zero standard as blank.
We compared the urea levels of the DBSs with the urea levels of the fresh plasma samples as measured on the day of blood collection. The urea levels of the fresh plasma samples varied between 8 (2.85) and 230 (82.11) mg/dL (mmol/L). Mean±SD urea levels in plasma and the corresponding DBSs were 34.13± 36.49 (12.18±13.03) and 34.87±33.47 (12.45±11.95) mg/dL (mmol/L), respectively (P =0.475). Linear regression analysis was used to assess the relationship between DBSs and plasma samples collected simultaneously. Intra-class correlation was calculated to estimate the limits of agreement. The urea levels obtained by the 2 methods were well correlated. Regression analysis reported an r-value of 0.97 and an intra-class correla- tion value of 0.96. The mean urea recovery from dried blood was 102.2% on the day of sample collection. The mean intra- and inter-assay coefficients of variance for urea in DBSs were 4.2 and 6.3%, respectively.
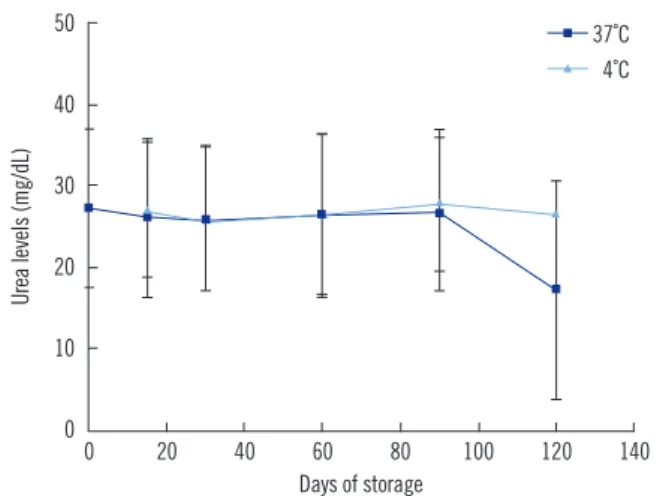
To assess the stability of urea in the DBSs, filter paper discs were punched from 20 of the DBSs, and the urea level of each DBS was estimated at 0, 15, 30, 60, and 90 days. We found that the urea levels remained stable for up to 120 and 90 days in DBSs kept at 4˚C and 37˚C, respectively. The level of urea de- clined by 36% between 90 and 120 days in DBSs stored at 37˚C (Fig. 1).
To assess the effect of hematocrit on the level of urea in dried blood samples, we prepared a blood-based control by mixing washed red blood cells with serum, which had known urea lev- els (40-120 mg/dL). The hematocrit concentration of our sam- ples was 30%, 40%, and 50%. This blood was spotted on filter paper and dried, and the urea level of each DBS determined in the same way as described earlier. There was no statistically sig-
nificant difference in the urea level of blood with different hema- tocrit concentrations (rANOVA (P =0.867 for 40 mg/dL of urea and P =0.054 for 120 mg/dL of urea).
A previous study that estimated urea levels in DBSs used an extraction method of 0.9% (w/v) saline [8]. This method had 2 problems. First, the repeated analysis of serum-based calibra- tors showed elevated urea levels when compared to the actual levels. Second, it showed the presence of hemoglobin in eluate, without any interference in the estimation of urea levels from DBSs. The method described in the present study used a blood-based calibrator throughout, and no elution of hemoglo- bin occurred when 5% TCA was used as extraction method.
Therefore, the method used in this study has a better analytical performance than the method previously described.
We found that changes in the hematocrit concentration be- tween 30-50% did not affect the dried-blood assay. A wide range of blood samples can therefore be screened with the method that we developed. Furthermore, the stability of urea in DBSs for up to 90 days at ambient temperatures of 4˚C and 37˚C make this method applicable for sample collection over long periods of time.
Authors’ Disclosures of Potential Conflicts of Interest
No potential conflicts of interest relevant to this article were re- ported.
Fig. 1. Effect of storage of dried blood on urea levels. The figure represents mean (+/-SD) blood urea levels measured after storage of filter disc for 15, 30, 60 and 90 days at 37˚C and at 4˚C (N=20).
The values obtained at different time periods were compared by within-subject ANOVA (F=1.56, P =0.25 at 37˚C and F=1.60, P = 0.24 at 4˚C).
Urea levels (mg/dL)
50 40 30 20 10
00 20 40 60 80 100 120 140 Days of storage
37˚C 4˚C
Quraishi R, et al.
Stability of urea in dried blood spots
192 www.annlabmed.org http://dx.doi.org/10.3343/alm.2013.33.3.190
Acknowledgement
The Indian Council of Medical Research provided financial as- sistance for this study.
REFERENCES
1. Skovby F, Micic S, Jepsen B, Larsen SO, Hansen B, Tegllund L, et al.
Screening for familial hypercholesterolemia by measurement of apolipo- proteins in capillary blood. Arch Dis Child 1991;66:844-7.
2. Howe CJ and Handelsman DJ. Use of filter paper for sample collection and transport in steroid pharmacology. Ciln Chem 1997;43:1408-15. 3. Ramakrishnan L, Reddy KS, Jailkani BL. Measurement of cholesterol
and triglycerides in dried serum and effect of storage. Clin Chem 2001; 47:113-5.
4. Quraishi R, Lakshmy R, Prabhakaran D, Mukhopadhyay AK, Jailkhani BL. Use of filter paper stored dried blood for measurement of triglycer- ide. Lipids Health Dis 2006;5:20.
5. Quraishi R, Lakshmy R, Prabhakaran D, Irshad M, Mukhopadhyay AK, Jailkhani BL. Effect of storage temperature on cholesterol measurement from dried blood. Indian J Med Res 2007;126:228-9.
6. Quraishi R, Lakshmy R, Mukhopadhyay AK, Jailkhani BL. Creatinine measurement and stability in dried serum. J Diabetes Sci Technol 2012; 6:988-9.
7. Fawvett JK and Scott JE. A rapid and precise method for the determi- nation of urea. J Clin Pathol 1960;13:156-9.
8. Plumbe RM and Worth HG. Dried blood spot test estimation of urea.
Ann Clin Biochem 1985;22:408-11.