INTRODUCTION
Prader-Willi syndrome (PWS) is a contiguous gene syn- drome that results from the non-expression of paternal alle- les at the PWS locus; it is characterized clinically by uncon- trollable hyperphagia, results in morbid obesity with the asso- ciated somatic and psychological problems (1-3). Several stud- ies have confirmed that plasma ghrelin levels are markedly elevated in PWS adults (4, 5) and children (6, 7). Because ghrelin acutely stimulates food intake and GH secretion in rodents and humans, and because its chronic administration to rodents causes obesity (8-12), it is possible that the increased appetite in PWS might be due to the ghrelin level enhance- ment. However, a direct anorexigenic effect of ghrelin, in its physiologic range, has not been demonstrated in either ro- dents or humans to date. The study of anorexigenic hormones is of interest because appetite is also regulated by negative sig- nals (13). Moreover, the response patterns of hormones to meals
have not been examined in detail in patients with PWS.
Peptide YY (PYY), an anorectic peptide, is secreted post- prandially from the distal gastrointestinal tract. Moreover, PYY3-36, the major form of circulating PYY, binds to the hypothalamic NPY Y2 receptor (Y2-R) with a high affinity, and has been shown to reduce food intake in rodents and hu- mans (14-17). It has been reported that endogenous PYY levels are low in obese subjects, suggesting that PYY defici- ency may contribute to the pathogenesis of obesity (18). Cho- lecystokinin (CCK) is an important feedback signal that con- trols meal size; it is released from intestinal endocrine cells both locally and into the plasma in response to the intralu- minal presence of nutrient digestion products. CCK acts to coordinate the digestive process in both an endocrine and a paracrine/neurocrine manner by stimulating pancreatic and gallbladder secretions, inhibiting gastric emptying, and by modifying intestinal motility. In addition, CCK also plays a major role in satiety (19).
Kyung Hoon Paik, Dong-Kyu Jin, Kyung Han Lee*, Lee Armstrong�, Ji Eun Lee�, Yoo Joung Oh�, Seonwoo Kim�, Eun Kyung Kwon, Yon Ho Choe
Departments of Pediatrics, Nuclear Medicine*, Samsung Medical Center, Sungkyunkwan University School of Medicine, Seoul; Clinical Research Center�, Samsung Biomedical Research Institute, Seoul;
Department of Pediatrics�, College of Medicine, Inha University, Incheon, Korea; Royal Hospitals Trust and Queen’s University�, Belfast, U.K.
Address for correspondence Dong-Kyu Jin, M.D.
Department of Pediatrics, Samsung Medical Center, Sungkyunkwan University School of Medicine, 50 Irwon-dong, Gangnam-gu, Seoul 135-710, Korea Tel : +82.2-3410-3525, Fax : +82.2-3410-0043 E-mail : [email protected]
*This Research was supported by a grant from the Samsung Medical Center Clinical Research Development Program grant (#CRS 104-382).
436
Peptide YY, Cholecystokinin, Insulin and Ghrelin Response to Meal did not Change, but Mean Serum Levels of Insulin is Reduced in Children with Prader-Willi Syndrome
Prader-Willi syndrome (PWS) is a contiguous gene syndrome characterized by uncontrollable eating or hyperphagia. Several studies have confirmed that plasma ghrelin levels are markedly elevated in PWS adults and children. The study of ano- rexigenic hormones is of interest because of their regulation of appetite by negative signals. To study the pattern and response of the anorexigenic hormones such as cholecystokinin (CCK) and peptide YY (PYY) to a meal in PWS, we measured the plasma CCK, PYY, ghrelin and serum insulin levels in PWS patients (n=4) and in controls (n=4) hourly for a day, and analyzed hormone levels and hormonal respon- ses to meals. Repeated measures of ANOVA of hormone levels demonstrated that only insulin levels decreased (p=0.013) and CCK (p=0.005) and ghrelin (p=0.0007) increased in PWS over 24 hr. However, no significant group x time interactions (ghrelin: p=0.89, CCK: p=0.93, PYY: p=0.68 and insulin: p=0.85) were observed;
in addition, there were no differences in an assessment of a three-hour area under the curve after breakfast. These results suggest that the response pattern of hor- mones to meals in PWS patients parallels that of normal controls. In addition, the decrease of insulin levels over 24 hr, in spite of obesity and elevated ghrelin levels, suggests that the baseline insulin level, not the insulin response to meals, may be abnormal in patients with PWS.
Key Words : Ghrelin; Cholecystokinin; Peptide YY; Insulin; Prader-Willi Syndrome
Received : 11 August 2006 Accepted : 10 November 2006
Insulin is a physiological and dynamic modulator of plas- ma ghrelin and glucose levels, and possibly mediates their effect on nutritional status (10). Moreover, it has been reported that insulin has an inhibitory effect on ghrelin secretion that is independent of plasma glucose levels, although these mole- cules may have additional effects (20, 21).
In this study, the 24-hr PYY, CCK, insulin and ghrelin profiles of children with PWS (n=4) were compared with those of age, gender, and BMI matched controls (n=4); the responses of these hormones to meals were evaluated.
MATERIALS AND METHODS Subjects
Four PWS patients (n=4, mean body mass index (BMI)=
39±5.9 kg/m2, mean fat %=58.4±5.9%) and four age, gender and BMI matched controls (n=4, mean BMI=39± 5.7 kg/m2, mean fat %=51.2±3.7%) were enrolled in the present study. Patients with diabetes mellitus (fasting plas- ma glucose >126 mg/dL with a 2-hr post-prandial glucose value of >200 mg/dL) were excluded. The patient clinical characteristics are detailed in Table 1. Informed consent was obtained from all participants or parents, as appropriate. The study design was reviewed and approved by the Samsung Medical Center Institutional Review Board.
For controls, several middle and high schools located in the southern part of Seoul were recruited. We explained the purpose of the study to teachers, and a written study protocol was sent to all parents. Of 23 volunteers, four controls were selected on the basis of age, sex, and BMI. All study subjects were males. We explained the purpose and methods of the study, and informed consent was obtained from all parents.
Experimental design
For this 24-hr study, all subjects were admitted to the Pedi- atric Ward at the Samsung Medical Center; they ate a stan- dard hospital diet [meals served at 7:30 AM, 12:00 PM, and 18:00 PM, total calories 2100 calories consisting of 60%
carbohydrate (310 g), 20% protein (100 g) and 20% fat (50 g)]and were allowed to sleep (lights-off) between 11:00 PM and 7:00 AM. During the remainder of the day, lights were on and sleeping and snacking were not allowed. Blood was drawn to measure hormones through an indwelling venous cannula and was collected in EDTA and SST tubes every hour for 24 hr without the addition of aprotinin. After taking a baseline sample, which was collected at 7:00 AM before break- fast, a total of 23 additional samples were collected at hourly intervals from each patient. Samples were stored at 4℃dur- ing the collection period, centrifuged for plasma within two hours of collection, and stored at -70℃until assayed.
Hormonal assay
Plasma immunoreactive ghrelin was measured in duplicate using a commercial ELISA kit (Phoenix Pharmaceuticals, Belmont, CA); the inter- and intra-assay coefficients of vari- ance were <10%. The lower and upper detection limits for this assay were 0.75 ng/mL and 100 ng/mL.
Plasma immunoreactive PYY was measured in duplicate using a commercial ELISA kit (Peninsula Laboratories, Inc.);
inter- and intra-assay coefficients of variance were <10%, and the assay detection range was 0-25 ng/mL. The antibody against human PYY(3-36)exhibited 100% cross-reactivity with full-length PYY.
CCK was measured by radioimmunoassay using synthetic CCK8 (sulphated) [Bachem]as a standard, antibody code R7 (3) (final dilution 1:100,000); the intra-assay CVs were 8.2 and 6.6% at 5 ng/L and 15 ng/L, respectively, and the inter-assay CVs were 13.3 and 11.5% at 5 ng/L and 15 ng/L, respectively, with a lower detection limit of 1.5 ng/L.
Serum insulin was measured using a commercially avail- able immunoradiometric assay kit (BioSource Europe S.A.) with a detection limit of 1 IU/mL and intra- and inter-assay coefficients of variation of <10%.
Statistical analysis
All values are expressed as means±SE. Repeated measures of ANOVA was used to compare the 24-hr hormone profiles of the two groups. Increments or decrements in areas under the curve (AUC) for each hormone profile (from 7:00 AM to 10:00 AM) were calculated using the trapezoid method after subtracting the basal AUC from the calculated AUC, and Mann-Whitney test was used to compare them between the two groups. p values of <0.05 were regarded as statistically significant. All statistical analyses were performed using SAS
Percent body fat
(%) Subject Age (yr) % of the
ideal wt BMI (kg/m2)
BMI per- centile
Geno- type
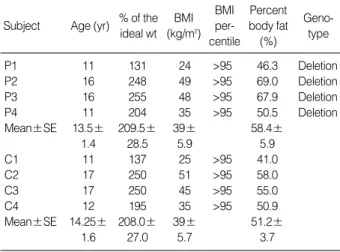
P1 11 131 24 >95 46.3 Deletion
P2 16 248 49 >95 69.0 Deletion
P3 16 255 48 >95 67.9 Deletion
P4 11 204 35 >95 50.5 Deletion
Mean±SE 13.5± 209.5± 39± 58.4±
1.4 28.5 5.9 5.9
C1 11 137 25 >95 41.0
C2 17 250 51 >95 58.0
C3 17 250 45 >95 55.0
C4 12 195 35 >95 50.9
Mean±SE 14.25± 208.0± 39± 51.2±
1.6 27.0 5.7 3.7
Table 1.Characteristics of the study subjects (all males, P1-4:
PWS, C1-4: control)
BMI, body mass index.
version 8.2 (SAS Corporation, Cary, NC).
RESULTS
The characteristics of the study subjects are detailed in Table 1. The PWS and control groups did not differ signifi- cantly with respect to age, % of ideal body weight, BMI, BMI percentile, or in terms of percent body fat as determined by a dual energy absorptiometry (DEXA).
Twenty-four hour PYY levels are illustrated in Fig. 1. Re- peated measures of ANOVA of PYY levels showed no sig- nificant difference between the two groups (p=0.06). There was no significant group×time interaction (p=0.68). There-
fore, the PYY levels were similar in the two groups over 24 hr; their PYY responses to meals were also similar, and in- creases in the AUC of PYY after breakfast (7 AM-10 AM) were not significantly different in comparisons between PWS (0.14±0.14 ng/mL×3 hr) and controls (0.008±0.18 ng/
mL×3 hr, p=0.31) (Table 2).
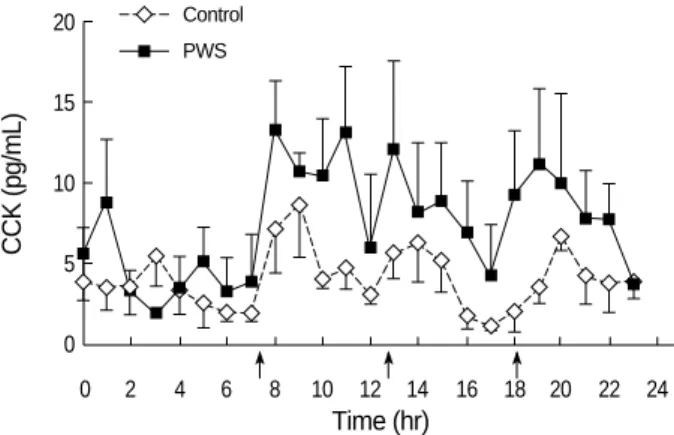
Fig. 2 shows the 24 hr CCK profiles. Repeated measures of ANOVA of the CCK profiles identified a significant dif- ference between the two groups (p=0.0051) but without a significant group x time interaction (p=0.9311). These results indicate that the mean CCK levels were elevated over 24 hr, but that the CCK response to meals was not different in com- parisons between the two groups. In addition, increments in AUC of CCK after breakfast (7 AM-10 AM) were not significantly different (Table 2). We interpreted these results to mean that although there was an elevation in the mean
PYY (ng/mL)
0.6 0.55 0.5 0.45 0.4 0.35 0.3
0 2 4 6 8 10 12 14 16 18 20 22 24
Time (hr)
PWS Control
Fig. 1.24-hr mean plasma peptide YY (PYY) profiles (mean±SE) in Prader-Willi syndrome (PWS) (n=4) and sex- and age- matched controls (n=4). Hourly PYY values (0.46±0.01 ng/mL) were com- pared with those of controls 1-4 (0.48±0.01 ng/mL). PYY levels were not different over 24 hr, and PYY responses to meals were similar in the PWS and control groups (p=0.68). Arrows indicate meal times.
CCK (pg/mL)
20
15
10
5
0
0 2 4 6 8 10 12 14 16 18 20 22 24
Time (hr)
PWS Control
Fig. 2.24-hr mean plasma cholecystokinin (CCK) profiles (mean± SE) in Prader-Willi syndrome (PWS) (n=4) and in sex- and age- matched controls (n=4). The hourly CCK values of PWS patients (7.21±0.68 pg/mL) were compared with those of controls (4.16
±0.35 pg/mL).
These results indicate that mean CCK levels were elevated over 24 hr (p=0.0051), but the CCK response to meals was similar in the two groups (p=0.9311).
PWS Controls p-value
PYY
Incremental AUC 0.14±0.07 0.008±0.09 0.312 (ng/mL×3 hr)
CCK
Incremental AUC 9.0±2.61 8.6±5.89 1.0 (pg/mL×3 hr)
Insulin
Incremental AUC 128.85±98.87 55.55±68.59 0.194 ( IU/mL×3 hr)
Ghrelin
Decremental AUC 0.026±2.30 -0.41±0.79 0.665 (ng/mL×3 hr)
Table 2.Comparison of ghrelin, PYY, CCK and insulin responses to breakfast (mean±S.E) in PWS patients and controls (basal time 7 AM)
Insulin (IU/mL)
160 140 120 100 80 60 40 20 0
0 2 4 6 8 10 12 14 16 18 20 22 24
Time (hr)
PWS Control
Fig. 3.24-hr mean plasma insulin profiles (mean±SE) in Prader- Willi syndrome (PWS) (n=4) and in sex- and age- matched con- trols (n=4). Hourly insulin values were compared between the two groups. Plasma insulin levels in the PWS group were lower (mean 29.19±3.23 IU/mL) than in controls (mean 43.12±3.53 IU/mL) throughout the 24-hr insulin monitoring period (p=0.01).
However, insulin response to meals were similar in the two groups (p=0.85).
PWS, Prader-Willi syndrome; PYY, peptide YY; CCK, cholecystokinin.
CCK levels over 24 hr, the CCK response to meals was not significantly different in comparisons between the two groups.
Twenty-four hour insulin levels are shown in Fig. 3. The repeated measures of ANOVA of the insulin levels demon- strated a significant difference between the two groups (p=
0.013), but there was no significant difference between the two in terms of group×time interaction (p=0.85). These data show that insulin responses to meals were similar in the two groups; however, the levels of insulin over 24 hr were relatively lower in the PWS patients. Increments in the AUC of insulin after breakfast (7 AM-10 AM) were similar in the two groups (Table 2).
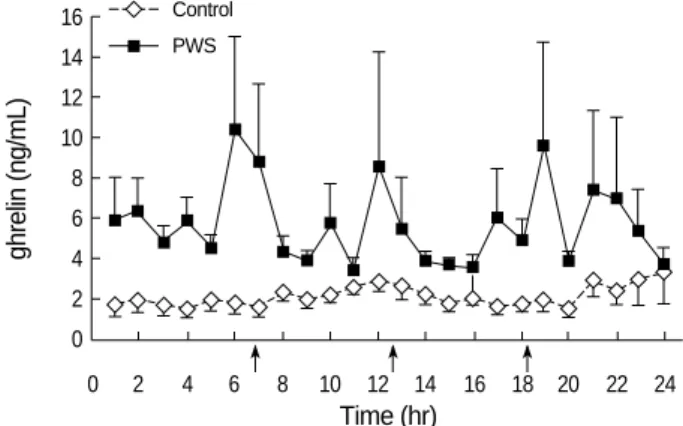
In addition, we measured the 24-hr ghrelin levels; they were higher in PWS than in controls (p=0.0007). However, no significant difference was found in terms of the group×
time interaction (p=0.89) or between decrements in the AUC of ghrelin after breakfast (7 AM-10 AM, Table 2). These results show that ghrelin suppression after meals was simi- lar in the two groups.
DISCUSSION
Our results show that the response pattern of CCK, PYY, insulin and ghrelin to meals in PWS patients was not differ- ent from that of controls. In addition, we demonstrated that only insulin levels decreased (p=0.013), while the other hor- mone levels either increased or did not change. Therefore, reduced mean levels of insulin as well as elevated mean levels of ghrelin were the major results in the PWS patients.
It has been repeatedly reported that plasma ghrelin is ele- vated in both adults and children with PWS, which is in contrast to the ghrelin levels found in other causes of obesi- ty, where ghrelin levels have been shown to be decreased (4, 22). Based on rodent and human studies elevated ghrelin
levels might be associated with an increase in appetite, (8- 11) although the direct orexigenic effects of ghrelin, in its physiologic range, have not been demonstrated in rodents or humans. However, studies showing an increased appetite in PWS are insufficient without an understanding of the effects of anorexigenic hormones; this is because appetite is also negatively influenced by several hormones. Thus, if ano- rexigenic hormones are reduced, the increased appetite asso- ciated with PWS could be explained by another mechanism.
However, these hormones fluctuate widely after meals. Thus, a single determination of hormone levels in a given day is not adequate for understanding appetite-related hormonal changes in PWS.
CCK levels in PWS have been reported several times. One report emphasized a significant increase in serum CCK levels during meals in PWS patients, indicating that a failure of peripheral CCK release in response to food intake does not explain the impaired satiety response in PWS (23); however, two additional reports did not find CCK elevation in PWS (24, 25). In our study, hourly CCK monitoring data suggest- ed that CCK secretion in response to a meal was similar in PWS patients and in controls. However, we did note an ele- vation in serum CCK levels in PWS. These results showed that in PWS the failure of peripheral CCK release, in response to food intake, cannot explain the impaired satiety response.
Our data suggest that anorexigenic hormones may potentially influence the gastrointestinal tract peripherally and appetite centrally. Recently, we reported that gastric emptying in PWS was not elevated, and that actually it tended to be delayed, despite the presence of higher ghrelin levels, which generally promote gastric emptying (26). CCK may potentially delay gastric emptying; however, further evidence is needed to con- firm this.
Batterham et al. reported that the gut hormone fragment peptide YY3-36reduces appetite, food intake, and plasma ghre- lin levels when infused into both normal weight and obese subjects (18, 27). Endogenous PYY levels were depressed in obese subjects, and the fasting PYY levels were found to cor- relate negatively with BMI (26).
Moreover, plasma PYY levels in PWS were reported to be lower than those of similarly aged individuals without PWS;
however, other reports did not confirm this (28, 29). In the present study, we observed that these hormones fluctuate widely according to meal times; however, we found no sig- nificant difference between the PWS patients and controls in regard to the PYY levels. Our data shows that PYY response to meals and basal PYY levels are similar in PWS patients and normal controls; this suggests that a failure to secrete PYY in response to food is not an explanation for the impaired satiety response observed in PWS. Our data are consistent with the recent observation that there is no deficiency of the anorex- igenic intestinal hormone PYY in PWS (29).
As for insulin, we observed lower insulin levels in PWS than in controls over the 24-hr monitoring period. This find-
ghrelin (ng/mL)
16 14 12 10 8 6 4 2 0
0 2 4 6 8 10 12 14 16 18 20 22 24
Time (hr)
PWS Control
Fig. 4.24 hr mean plasma ghrelin profiles (mean±SE) in Prader- Willi syndrome (n=4) and in sex-age matched controls (n=4).
Plasma ghrelin levels in the PWS group were higher (mean 5.61± 0.5 g/mL) than in controls (mean 2.08±0.13 ng/mL) (p<0.001) throughout the 24 hr monitoring period, but ghrelin suppression after meals was similar in the two groups (p=0.89).
ing is consistent with previous reports, which found that insulin resistance is lower in PWS subjects, and that insulin sensitivity is higher than in obese controls (30-33). Unfor- tunately, we did not measure the 24-hr serum glucose pro- file, which is a limitation of this study. However, because fast- ing and post-prandial two-hour glucose levels were normal in all subjects and standard hospital diet was served to all of them, this limitation may not have influenced our results.
Recently, it was reported that deficits in insulin and glu- cagons, during fetal and postnatal life, are prominent find- ings in the TgPWS deletion mouse model, and that a pan- creatic defect may be the primary lesion (34). Consistent with these findings is the presence of type 2 diabetes in PWS, which may partly result from the lowered insulin levels observed compared to the expected levels for the degree of increased body mass index (35-37). In addition, this model showed that increased plasma ghrelin levels occurred in the postna- tal TgPWS mice and appeared to begin at the onset of severe hypoglycemia; this suggests that the hyperghrelinemia, ob- served in PWS, might be a physiological adaptive mecha- nism of increased eating in response to hypoglycemia (32).
However, insulin alone is insufficient to lower the ghrelin levels to control levels, i.e., the ghrelin baseline in PWS was almost always higher than in controls. Therefore, elevated ghrelin levels may be explained by at least two mechanisms, i.e., by insufficient insulin levels and by an adaptive response to hypoglycemia during the postnatal period. However, the precise mechanism of hyperghrelinemia in PWS remains to be determined.
In conclusion, our results suggest that the response pattern of hormones to meals in PWS patients parallels that of nor- mal controls. In addition, a decrease of the insulin level over 24 hr, in spite of obesity and elevated ghrelin levels, suggests that the baseline insulin level, not the insulin response to meals, may be the important abnormality in PWS.
REFERENCES
1. Ishikawa T, Kibe T, Wada Y. Deletion of small nuclear ribonucleo- protein polypeptide N (SNRPN) in Prader-Willi syndrome detected by fluorescence in situ hybridization: two sibs with the typical phe- notype without a cytogenetic deletion in chromosome 15q. Am J Med Genet 1996; 62: 350-2.
2. MacDonald HR, Wevrick R. The necdin gene is deleted in Prader- Willi syndrome and is imprinted in human and mouse. Hum Mol Genet 1997; 6: 1873-8.
3. Prader A LA, Willi H. Ein Syndrom von Adipositas, Kleinwuchs, Kry- ptorchismus und Oligophrenie nach Myatonieartigem Zustand im Neugeborenenalter. Schweiz Med Wochenschr 1956; 86: 1260-1.
4. Cummings DE, Clement K, Purnell JQ, Vaisse C, Foster KE, Frayo RS, Schwartz MW, Basdevant A, Weigle DS. Elevated plasma ghre- lin levels in Prader Willi syndrome. Nat Med 2002; 8: 643-4.
5. DelParigi A, Tschop M, Heiman ML, Salbe AD, Vozarova B, Sell
SM, Bunt JC, Tataranni PA. High circulating ghrelin: a potential cause for hyperphagia and obesity in prader-willi syndrome. J Clin Endocrinol Metab 2002; 87: 5461-4.
6. Haqq AM, Farooqi IS, O’Rahilly S, Stadler DD, Rosenfeld RG, Pratt KL, LaFranchi SH, Purnell JQ. Serum ghrelin levels are inversely correlated with body mass index, age, and insulin concentrations in normal children and are markedly increased in Prader-Willi syn- drome. J Clin Endocrinol Metab 2003; 88: 174-8.
7. Jin DK. Ghrelin in the Prader-Willi Syndrome. J Korean Soc Pedi- atr Endocrinol 2003; 8: 119-25.
8. Kojima M, Hosoda H, Date Y, Nakazato M, Matsuo H, Kangawa K.
Ghrelin is a growth-hormone-releasing acylated peptide from stom- ach. Nature 1999; 402: 656-60.
9. Nakazato M, Murakami N, Date Y, Kojima M, Matsuo H, Kangawa K, Matsukura S. A role for ghrelin in the central regulation of feed- ing. Nature 2001; 409: 194-8.
10. Paik KH, Jin DK, Song SY, Lee JE, Ko SH, Song SM, Kim JS, Oh YJ, Kim SW, Lee SH, Kim SH, Kwon EK, Choe YH. Correlation between fasting plasma ghrelin levels and age, body mass index (BMI), BMI percentiles, and 24-hour plasma ghrelin profiles in Prader-Willi syndrome. J Clin Endocrinol Metab 2004; 89: 3885-9.
11. Tschop M, Smiley DL, Heiman ML. Ghrelin induces adiposity in rodents. Nature 2000; 407: 908-13.
12. Wren AM, Seal LJ, Cohen MA, Brynes AE, Frost GS, Murphy KG, Dhillo WS, Ghatei MA, Bloom SR. Ghrelin enhances appetite and increases food intake in humans. J Clin Endocrinol Metab 2001; 86:
5992.
13. Park A, Bloom SR. Peptides and obesity: the PYY3-36 story. Regul Pept 2004; 119: 1-2.
14. Keire DA, Mannon P, Kobayashi M, Walsh JH, Solomon TE, Reeve JR Jr. Primary structures of PYY, [Pro(34)]PYY, and PYY-(3-36) confer different conformations and receptor selectivity. Am J Physi- ol Gastrointest Liver Physiol 2000; 279: 126-31.
15. Pedersen-Bjergaard U, Host U, Kelbaek H, Schifter S, Rehfeld JF, Faber J, Christensen NJ. Influence of meal composition on postpran- dial peripheral plasma concentrations of vasoactive peptides in man.
Scand J Clin Lab Invest 1996; 56: 497-503.
16. Adrian TE, Ferri GL, Bacarese-Hamilton AJ, Fuessl HS, Polak JM, Bloom SR. Human distribution and release of a putative new gut hormone, peptide YY. Gastroenterology 1985; 89: 1070-7.
17. Grandt D, Schimiczek M, Beglinger C, Layer P, Goebell H, Eysse- lein VE, Reeve JR Jr. Two molecular forms of peptide YY (PYY) are abundant in human blood: characterization of a radioimmunoassay recognizing PYY 1-36 and PYY 3-36. Regul Pept 1994; 51: 151-9.
18. Batterham RL, Cohen MA, Ellis SM, Le Roux CW, Withers DJ, Frost GS, Ghatei MA, Bloom SR. Inhibition of food intake in obese sub- jects by peptide YY3-36. N Engl J Med 2003; 349: 941-8.
19. Moran TH, Kinzig KP. Gastrointestinal satiety signals II. Cholecys- tokinin. Am J Physiol Gastrointest Liver Physiol 2004; 286: 183-8.
20. Saad MF, Bernaba B, Hwu CM, Jinagouda S, Fahmi S, Kogosov E, Boyadjian R. Insulin regulates plasma ghrelin concentration. J Clin Endocrinol Metab 2002; 87: 3997-4000.
21. Mohlig M, Spranger J, Otto B, Ristow M, Tschop M, Pfeiffer AF.
Euglycemic hyperinsulinemia, but not lipid infusion, decreases circu-
lating ghrelin levels in humans. J Endocrinol Invest 2002; 25: 36-8.
22. Butler MG, Moore J, Morawiecki A, Nicolson M. Comparison of leptin protein levels in Prader-Willi syndrome and control individu- als. Am J Med Genet 1998; 75: 7-12.
23. Tschop M, Weyer C, Tataranni PA, Devanarayan V, Ravussin E, Heiman ML. Circulating ghrelin levels are decreased in human obe- sity. Diabetes 2001; 50: 707-9.
24. Holland AJ, Treasure J, Coskeran P, Dallow J, Milton N, Hillhouse E. Measurement of excessive appetite and metabolic changes in Prad- er-Willi syndrome. Int J Obes Relat Metab Disord 1993; 17: 527-32.
25. Tomita T, Greeley G Jr, Watt L, Doull V, Chance R. Protein meal- stimulated pancreatic polypeptide secretion in Prader-Willi syndrome of adults. Pancreas 1989; 4: 395-400.
26. Choe YH, Jin DK, Kim SE, Song SY, Paik KH, Park HY, Oh YJ, Kim AH, Kim JS, Kim CW, Chu SH, Kwon EK, Lee KH. Hyper- ghrelinemia does not accelerate gastric emptying in Prader-Willi syndrome patients. J Clin Endocrinol Metab 2005; 90: 3367-70.
27. Butler MG, Carlson MG, Schmidt DE, Feurer ID, Thompson T. Plas- ma cholecystokinin levels in Prader-Willi syndrome and obese sub- jects. Am J Med Genet 2000; 95: 67-70.
28. Butler MG, Bittel DC, Talebizadeh Z. Plasma peptide YY and ghre- lin levels in infants and children with Prader-Willi syndrome. J Pedi- atr Endocrinol Metab 2004; 17: 1177-84.
29. Goldstone AP, Patterson M, Kalingag N, Ghatei MA, Brynes AE, Bloom SR, Grossman AB, Korbonits M. Fasting and post-prandial hyperghrelinemia in Prader-Willi syndrome is partially explained by hypoinsulinemia, and is not due to pyy deficiency or seen in hypotha- lamic obesity due to craniopharyngioma. J Clin Endocrinol Metab 2005; 90: 2681-90.
30. Talebizadeh Z, Butler M. Insulin resistance and obesity-related fac- tors in Prader-Willi syndrome: Comparison with obese subjects. Clin Genet 2005; 67: 230-9.
31. Goldstone AP, Thomas EL, Brynes AE, Castroman G, Edwards R, Ghatei MA, Frost G, Holland AJ, Grossman AB, Korbonits M, Bloom SR, Bell JD. Elevated fasting plasma ghrelin in prader-willi syndrome adults is not solely explained by their reduced visceral adiposity and insulin resistance. J Clin Endocrinol Metab 2004; 89: 1718-26.
32. Kim SY, Shin JY, Jung MJ, Choi BM, Lee JH, Lee KH. Relation- ship between serum ghrelin and insulin resistance in obese children and adolescents. J Korean Soc Pediatr Endocrinol 2005; 10: 211-7.
33. Jo DS, Lee JU, Kim SY, Kang CW, Hwang PH, Lee DY. Plasma ghrelin levels and its relationship with obesity in obese children. J Korean Soc Pediatr Endocrinol 2004; 9: 179-85.
34. Stefan M, Ji H, Simmons RA, Cummings DE, Ahima RS, Friedman MI, Nicholls RD. Hormonal and metabolic defects in a Prader-Willi syndrome mouse model with neonatal failure to thrive. Endocrinol- ogy 2005; 146: 4377-85.
35. Partsch CJ, Lammer C, Gillessen-Kaesbach G, Pankau R. Adult pati- ents with Prader-Willi syndrome: clinical characteristics, life circum- stances and growth hormone secretion. Growth Horm IGF Res 2000;
10: 81-5.
36. Eiholzer U, Stutz K, Weinmann C, Torresani T, Molinari L, Prader A. Low insulin, IGF-I and IGFBP-3 levels in children with Prader- Labhart-Willi syndrome. Eur J Pediatr 1998; 157: 890-3.
37. Schuster DP, Osei K, Zipf WB. Characterization of alterations in glucose and insulin metabolism in Prader-Willi subjects. Metabolism 1996; 45: 1514-20.