Received : May 20, 2015
Revised : October 19, 2015
Accepted : November 5, 2015
Correspondence to: Jun Yong Choi, Department of Internal Medicine, Yonsei University College of Medicine, 50 Yonsei-ro, Seodaemun-gu, Seoul 03722, Korea
Tel: 02-2228-1974, Fax: 02-393-6884 E-mail: [email protected]
*This study was supported by a grant of year 2013-2014 from the Korea Centers for Disease Control and Prevention.
전국병원감염감시체계 중환자실 부문 결과 보고:
2013년 7월부터 2014년 6월
곽이경1ㆍ최준용2ㆍ유현미3ㆍ이상오4ㆍ김홍빈5ㆍ한수하6 최희정7ㆍ김영근8ㆍ김성란9ㆍ김태형10ㆍ이혁민11ㆍ천희경12ㆍ김재석13 은병욱14ㆍ구현숙15ㆍ조은희15ㆍ어 영16ㆍ이경원17ㆍ전국병원감염감시체계
인제대학교 의과대학 일산백병원 감염내과1, 연세대학교 의과대학 세브란스병원 감염내과2, 인제대학교 상계백병원 감염관리실3, 울산대학교 의과대학 서울아산병원 감염내과4, 서울대학교 의과대학 분당서울대학교병원 감염내과5, 순천향대학교 부천병원 감염관리실6, 이화여자대학교 의학전문대학원 내과7, 연세대학교 원주의과대학 원주세브란스기독병원 감염내과8, 고려대학교 구로병원 감염관리실9, 순천향대학교 의과대학 서울병원 감염내과10, 관동대학교 국제성모병원
진단검사의학과11, 경희대학교병원 감염관리실12, 한림대학교 의과대학 강동성심병원 진단검사의학과13, 을지대학교 의과대학 을지병원 소아과14, 질병관리본부 감염병감시과15, 연세대학교 원주의과대학 원주세브란스기독병원
진단검사의학과16, 연세대학교 의과대학 세브란스병원 진단검사의학과, 세균내성연구소17
Korean Nosocomial Infections Surveillance System, Intensive Care Unit Module Report: Summary of Data from July 2013 through June 2014
Yee Gyung Kwak1, Jun Yong Choi2, Hyeonmi Yoo3, Sang-Oh Lee4, Hong Bin Kim5, Su Ha Han6, Hee Jung Choi7, Young Keun Kim8, Sung Ran Kim9, Tae Hyong Kim10, Hyukmin Lee11, Hee Kyung Chun12,
Jae-Seok Kim13, Byung Wook Eun14, Hyun-Sook Koo15, Eun Hee Cho15, Young Uh16, Kyungwon Lee17, Korean Nosocomial Infections Surveillance System
Department of Internal Medicine, Inje University Ilsan Paik Hospital
1, Goyang, Department of Internal Medicine and AIDS Research Institute, Yonsei University College of Medicine
2, Seoul, Infection Control Office, Inje University Sanggye Paik Hospital
3, Seoul, Department of Infectious Diseases, Asan Medical Center, University of Ulsan college of Medicine
4, Seoul, Department of Internal Medicine, Seoul National University College of Medicine
5, Seoul, Department of Infection Prevention and Control, Soonchunhyang University Bucheon Hospital
6, Bucheon, Department of Internal Medicine, Ewha Womans University School of Medicine
7, Seoul, Department of Internal Medicine, Yonsei University Wonju College of Medicine
8, Wonju, Infection Control Office, Korea University Guro Hospital
9, Seoul, Department of
Internal Medicine, Soonchunhyang University College of Medicine
10, Seoul, Department of Laboratory Medicine, Catholic Kwandong University College of Medicine
11, Incheon, Department of Infection Control, Kyunghee University Hospital
12, Seoul, Department of Laboratory
Medicine, Hallym University College of Medicine, Kangdong Sacred Heart Hospital
13, Seoul, Department of Pediatrics, Eulji University School of Medicine, Eulji General Hospital
14, Seoul, Division of Infectious Disease Control, Korea Centers for Disease Control and Prevention
15, Osong, Department of Laboratory Medicine, Yonsei University Wonju College of Medicine
16, Wonju, Department of Laboratory
Medicine and Research Institute of Bacterial Resistance, Yonsei University College of Medicine
17, Seoul, Korea
Background: In this report, we present the annual data of the intensive care unit (ICU) module of the Korean Nosocomial Infections Surveillance System (KONIS) from July 2013 through June 2014.
Methods: We performed a prospective surveillance of nosocomial urinary tract infections (UTIs), bloodstream infections (BSIs), and pneumonia (PNEU) in 166 ICUs of 94 hospitals using the KONIS. Nosocomial infection (NI) rate was defined as the number of infections per 1,000 patient-days or device-days.
Results: A total of 2,843 NIs were found during the study period: 861 UTIs (846 were urinary catheter-associated), 1,173 BSIs (1,021 were central line-associated), and 809 PNEUs (498 were ventilator-associated). The rate of urinary catheter-associated UTIs was 1.21 per 1,000 device-days (95% confidence interval [CI]=1.13-1.29), and the urinary catheter utilization ratio was 0.84 (95% CI=0.839-0.841). The rate of central line-associated BSIs was 2.33 per 1,000 device-days (95% CI=2.20-2.48), and the utilization ratio was 0.53 (95% CI=0.529-0.531). The rate of ventilator- associated PNEUs (VAPs) was 1.46 per 1,000 device-days (95% CI=1.34-1.60), and the utilization ratio was 0.41 (95%
CI=0.409-0.411). In hospitals with more than 900 beds, although the ventilator utilization ratio was highest, the rate of VAPs was lower than in hospitals with 300-699 or 700-899 beds.
Conclusion: BSIs were the most commonly reported nosocomial infections. Although device utilization ratios had increased, nosocomial infection rates did not differ significantly from those during the previous period (July 2012 through June 2013).
Keywords: Intensive care unit, KONIS, Korean Nosocomial Infections Surveillance System, Nosocomial infection
Introduction
의료관련감염은 환자 안전을 위협하는 주요 문제 중 하나로 재원 기간을 연장시키고 의료비 용을 증가시키며 환자의 사망률 또한 증가시킨 다[1]. 의료관련감염을 감소시키기 위해서는 감 시체계를 구축하여 표준화된 방법으로 지속적으 로 의료관련감염률을 파악하는 것이 필수적이며, 감시결과는 의료관련감염 감소를 위해 어떤 활 동을 우선적으로 해야 하는지 파악하는 근거가 된다. 여러 외국의 연구에서 한 나라에서 지속적 으로 전향적인 전국 규모의 감시체계를 운영하 는 것이 그 나라의 의료관련감염률을 줄이는 효 과가 있음이 보고된 바 있다[2-4].
전국병원감염감시체계(Korean Nosocomial In- fections Surveillance System, KONIS)는 2006년도 에 대한병원감염관리학회와 질병관리본부가 운 영하기 시작한 우리나라의 대표적인 의료관련감 염 감시체계이다[5]. KONIS는 전국에서 자발적 으로 참여하는 병원들에 의해 이루어지며 표준 화된 방법으로 각 병원의 중환자실에서 발생하 는 요로감염(urinary tract infection), 혈류감염(blood-
stream infection)과 폐렴(pneumonia)에 대한 감시 를 수행하고 있다. 이 보고서는 KONIS의 중환자 실 부문 2013년 7월부터 2014년 6월까지의 연간 자료이다.
Materials and Methods
2013년 7월부터 2014년 6월까지 300병상 이상 총 94개 병원에서 각 참여병원의 성인중환자실 중 대표적인 내과계와 외과계 중환자실 또는 통 합중환자실을 대상으로 하여 총 166개 중환자실 이 참여하였다. 자료를 분석할 때 각 참여병원의 특성을 고려하기 위해 ‘참여병원의 특성’ 설문지 를 배포하여 병원의 형태적 특성, 인력 구성과 질적인 부분 등의 기초정보를 조사하였다. 연구 기간 동안 각 참여 중환자실에서 요로감염(uri- nary tract infection), 혈류감염(bloodstream infec- tion)과 폐렴(pneumonia)에 대한 병원감염감시를 수행하였다. 중환자실 병원감염과 요로감염, 혈 류감염, 폐렴의 정의는 미국 질병관리본부(Center for Disease Control and Prevention, CDC)의 정의 에 근거하였다[6]. 요로감염은 ‘증상이 있는 요로 감염(symptomatic urinary tract infection, SUTI)’과
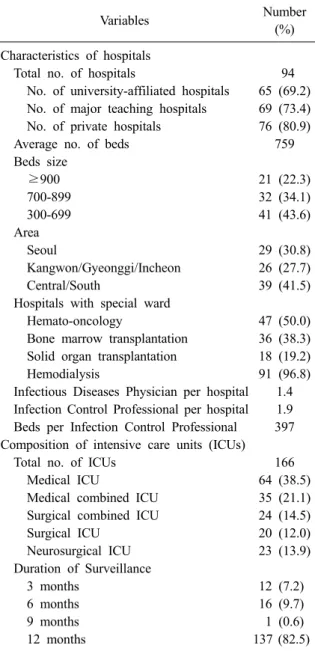
Table 1. Characteristics of hospitals and intensive care units participated in KONIS from July 2013 through June 2014
Variables Number
(%) Characteristics of hospitals
Total no. of hospitals 94
No. of university-affiliated hospitals 65 (69.2) No. of major teaching hospitals 69 (73.4) No. of private hospitals 76 (80.9)
Average no. of beds 759
Beds size
≥900 21 (22.3)
700-899 32 (34.1)
300-699 41 (43.6)
Area
Seoul 29 (30.8)
Kangwon/Gyeonggi/Incheon 26 (27.7)
Central/South 39 (41.5)
Hospitals with special ward
Hemato-oncology 47 (50.0)
Bone marrow transplantation 36 (38.3) Solid organ transplantation 18 (19.2)
Hemodialysis 91 (96.8)
Infectious Diseases Physician per hospital 1.4 Infection Control Professional per hospital 1.9 Beds per Infection Control Professional 397 Composition of intensive care units (ICUs)
Total no. of ICUs 166
Medical ICU 64 (38.5)
Medical combined ICU 35 (21.1) Surgical combined ICU 24 (14.5)
Surgical ICU 20 (12.0)
Neurosurgical ICU 23 (13.9)
Duration of Surveillance
3 months 12 (7.2)
6 months 16 (9.7)
9 months 1 (0.6)
12 months 137 (82.5)
‘무증상 균혈증 요로감염: asymptomatic bactere- mic urinary tract infection, ABUTI)’을 포함하였고 혈류감염은 ‘원인균 확인 혈류감염(laboratory-con- firmed bloodstream infection)’을 감시대상으로 하 였다[7,8]. 폐렴은 ‘임상적 폐렴(clinically defined pneumonia, PNEU1)’, ‘원인균 확인 폐렴(pneumo- nia with specific laboratory findings, PNEU2)’과
‘면역저하자 폐렴(pneumonia in immunocompro- mised patients, PNEU3)’으로 분류하였다. 요로감 염, 혈류감염과 폐렴에서 각각 요로카테터, 중심 정맥관 또는 인공호흡기와의 관련 여부를 구분 하였다. 항생제 감수성 결과가 있는 주요 세균을 대상으로 항생제에 대한 내성률을 조사하였고 중등도 내성은 내성으로 간주하여 분석하였다.
KONIS 병원감염감시가 기구일수 감염률에 미친 영향을 분석하기 위해 2013년 7월-2014년 6월 기 간의 기구일수 감염률 자료를 2009년 7월-2013년 6월 사이 4년간의 연간자료와 비교하였다[9-12].
95% 신뢰구간이 겹치지 않는 경우 유의한 차이 가 있는 것으로 판단하였다.
Results
1. KONIS 참여병원과 참여중환자실의 특성 2013년 7월부터 2014년 6월까지 KONIS 중환 자실 부문에 참여한 병원과 중환자실의 특성은 Table 1과 같다. 총 94개의 참여병원 중 대학병원 은 65개(69.2%)이었고 주교육병원은 69개(73.4%) 이었다. 병상 규모별로는 300-699병상 사이 병원 이 41개(43.6%), 700-899병상 사이 병원이 32개 (34.1%), 900병상 이상 병원이 21개(22.3%)이었고, 평균 병상 수는 759개이었다. 지역별로는 서울에 위치한 병원이 29개(30.8%), 강원/경기/인천 지역 병원이 26개(27.7%), 중남부권역 지역의 병원이 39개(41.5%)였다. 한 병원 당 감염관리전담자 1.9 명이 근무하였고 이들은 1인당 평균 397병상을 담당하고 있었다. 총 166개의 참여중환자실을 종 류별로 분석하였을 때 내과계 중환자실 64개 (38.5%), 내과 중심의 혼합 중환자실 35개(21.1%), 외과 중심의 혼합 중환자실 24개(14.5%), 외과계 중환자실 20개(12.0%), 신경외과계 중환자실이 23개(13.9%)이었다. 감시 기간은 3개월과 6개월
동안 참여한 중환자실이 각각 12개(7.2%), 16개 (9.7%)이었고, 12개월 동안 감시를 수행한 중환 자실은 137개로 82.5%에 해당하였다.
2. 병원감염 건수와 재원일수 감염률
연구 기간 동안 총 2,843건의 병원감염이 보고 되었다. 이 중 요로감염이 861건(30.3%), 혈류감 염이 1,173건(41.3%), 폐렴이 809건(28.4%)이었다.
참여중환자실의 총 재원일수는 832,428일이었다.
전체 병원감염(요로감염, 혈류감염과 폐렴)에 대 한 1,000 재원일수 당 병원감염 건수는 3.42 (95%
Table 2. Pooled means of nosocomial infection rates, by number of hospital beds, July 2013 through June 2014
Nosocomial infection rate No. of hospital beds
≥900 700-899 300-699 All
No. of units 42 60 64 166
Patient-days 209,373 342,175 280,880 832,428
Infection rate*
No. of infections 657 1,277 909 2,843
Pooled mean 3.14 3.73 3.24 3.42
95% CI 2.91-3.39 3.53-3.94 3.03-3.45 3.29-3.54
UTI rate
†No. of UTI 148 380 333 861
Pooled mean 0.71 1.11 1.19 1.03
95% CI 0.60-0.83 1.00-1.23 1.07-1.32 0.97-1.11
BSI rate
‡No. of BSI 348 472 353 1,173
Pooled mean 1.66 1.38 1.26 1.41
95% CI 1.50-1.85 1.26-1.51 1.13-1.40 1.33-1.49
PNEU rate
§No. of PNEU 161 425 223 809
Pooled mean 0.77 1.24 0.79 0.97
95% CI 0.66-0.90 1.13-1.37 0.70-0.91 0.91-1.04
*(No. of UTIs, BSIs, or PNEUs/No. of patient-days)×1,000;
†(No. of UTIs/No. of patient-days)×1,000;
‡(No. of BSIs/
No. of patient-days)×1,000;
§(No. of PNEUs/No. of patient-days)×1,000.
Abbreviations: UTI, urinary tract infection; BSI, bloodstream infection; PNEU, pneumonia; CI, confidence interval.
신뢰구간[CI], 3.29-3.54)이었다. 요로감염의 1,000 재원일수 당 병원감염 건수는 1.03 (95% CI, 0.97-1.11), 혈류감염은 1.41 (95% CI, 1.33-1.49), 폐렴은 0.97 (95% CI, 0.91-1.04)이었다(Table 2).
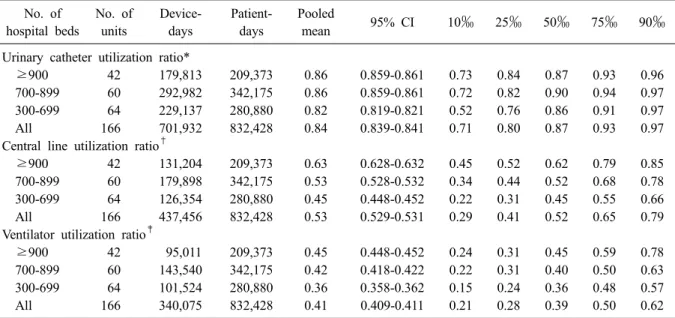
3. 기구일수 감염률과 기구사용률
요로감염 861건 중 846건(98.3%)이 요로카테터 와 관련이 있었다. 전체 요로카테터 기구일수는 701,932일이었고, 요로카테터 관련 요로감염(uri- nary catheter-associated UTI)의 1,000 기구일수 당 병원감염 건수는 1.21 (95% CI, 1.13-1.29)이었다 (Table 3). 요로카테터의 기구사용률은 0.84 (95%
CI, 0.839-0.841)이었다(Table 4). 혈류감염 1,173건 중 1,021건(87.0%)이 중심정맥관과 관련된 것이었 다. 전체 중심정맥관 기구일수는 437,456일이었 고, 중심정맥관 관련 혈류감염 (central line-asso- ciated BSI)의 1,000 기구일수 당 병원감염 건수는 2.33 (95% CI, 2.20-2.48)이었다. 중심정맥관의 기 구사용률은 0.53 (95% CI, 0.529-0.531)이었다. 폐 렴 809건 중 498건(61.6%)이 인공호흡기와 관련된 것이었다. 전체 인공호흡기 기구일수는 340,075일
이었고, 인공호흡기 관련 폐렴의 1,000 기구일수 당 병원감염 건수는 1.46 (95% CI, 1.34-1.60)이었 다. 인공호흡기의 기구사용률은 0.41 (95% CI, 0.409-0.411)이었다.
4. 병상규모에 따른 기구일수 감염률과 기구 사용률의 비교
요로카테터의 기구사용률은 병상규모가 300- 699병상인 병원에 비해 700-899병상, 900병상 이 상인 병원에서 유의하게 높았다(0.82 [95% CI, 0.819-0.821], vs. 0.86 [95% CI, 0.859-0.861], 0.86 [95% CI, 0.859-0.861]) (Table 4). 그러나, 카테터 관련 요로감염의 기구일수 감염률은 요로카테터 기구사용률이 낮았던 300-699병상 사이의 병원에 서 900 병상 이상의 병원의 중환자실에 비해 높 았다(1.43 [95% CI, 1.29-1.60] vs. 0.79 [95% CI, 0.67-0.93]) (Table 3). 중심정맥관 기구사용률도 300-699병상, 700-899병상, 900병상 이상인 병원 으로 갈수록 유의하게 높았다(0.45 [95% CI, 0.448- 0.452], 0.53 [95% CI, 0.528-0.532], 0.63 [95% CI, 0.628-0.632]). 그러나, 중심정맥관 관련 혈류감염
Table 3. Pooled means and percentiles of the decive-associated infection rates, by number of hospital beds, July 2013 through June 2014
No. of hospital beds
No. of units
No. of infection
Device- days
Pooled
mean 95% CI 10‰ 25‰ 50‰ 75‰ 90‰
Urinary catheter-associated UTI rate*
≥900 42 142 179,813 0.79 0.67-0.93 0 0 0.35 1.00 2.15
700-899 60 376 292,982 1.28 1.16-1.42 0 0.27 0.90 1.81 3.10
300-699 64 328 229,137 1.43 1.29-1.60 0 0.58 1.17 2.05 2.68
All 166 846 701,932 1.21 1.13-1.29 0 0.26 0.87 1.79 2.71
Central line-associated BSI rate
†≥900 42 316 131,204 2.41 2.16-2.69 0.11 0.85 2.29 3.83 5.31
700-899 60 410 179,898 2.28 2.07-2.51 0.44 1.25 1.72 3.06 4.31
300-699 64 295 126,354 2.36 2.08-2.62 0 0 2.00 3.32 5.28
All 166 1,021 437,456 2.33 2.20-2.48 0 0.94 1.94 3.31 5.08
Ventilator-associated PNEU rate
‡≥900 42 89 95,011 0.94 0.76-1.15 0 0.23 0.90 1.63 3.96
700-899 60 270 143,540 1.88 1.67-2.12 0 0.34 0.79 2.51 4.92
300-699 64 139 101,524 1.37 1.16-1.62 0 0 0.68 2.11 3.47
All 166 498 340,075 1.46 1.34-1.60 0 0 0.81 2.06 3.93
*(No. of urinary catheter-associated UTIs/No. of urinary catheter-days)×1,000;
†(No. of central line-associated BSIs/No.
of central line-days)×1,000;
‡(No. of ventilator-associated PNEUs/No. of ventilator-days)×1,000.
Abbreviations: UTI, urinary tract infection; BSI, bloodstream infection; PNEU, pneumonia; CI, confidence interval.
Table 4. Pooled means and percentiles of the distribution of device- utilization ratios, by number of hospital beds, July 2013 through June 2014
No. of hospital beds
No. of units
Device- days
Patient- days
Pooled
mean 95% CI 10‰ 25‰ 50‰ 75‰ 90‰
Urinary catheter utilization ratio*
≥900 42 179,813 209,373 0.86 0.859-0.861 0.73 0.84 0.87 0.93 0.96
700-899 60 292,982 342,175 0.86 0.859-0.861 0.72 0.82 0.90 0.94 0.97
300-699 64 229,137 280,880 0.82 0.819-0.821 0.52 0.76 0.86 0.91 0.97
All 166 701,932 832,428 0.84 0.839-0.841 0.71 0.80 0.87 0.93 0.97
Central line utilization ratio
†≥900 42 131,204 209,373 0.63 0.628-0.632 0.45 0.52 0.62 0.79 0.85
700-899 60 179,898 342,175 0.53 0.528-0.532 0.34 0.44 0.52 0.68 0.78
300-699 64 126,354 280,880 0.45 0.448-0.452 0.22 0.31 0.45 0.55 0.66
All 166 437,456 832,428 0.53 0.529-0.531 0.29 0.41 0.52 0.65 0.79
Ventilator utilization ratio
‡≥900 42 95,011 209,373 0.45 0.448-0.452 0.24 0.31 0.45 0.59 0.78
700-899 60 143,540 342,175 0.42 0.418-0.422 0.22 0.31 0.40 0.50 0.63
300-699 64 101,524 280,880 0.36 0.358-0.362 0.15 0.24 0.36 0.48 0.57
All 166 340,075 832,428 0.41 0.409-0.411 0.21 0.28 0.39 0.50 0.62
*(No. of urinary catheter-days/No. of patient-days);
†(No. of central line-days/No. of patient-days);
‡(No. of ven- tilator-days/No. of patient-days).
Abbreviations: UTI, urinary tract infection; BSI, bloodstream infection; PNEU, pneumonia; CI, confidence interval.
의 기구일수 감염률은 병상규모에 따라 유의한 차이는 없었다(2.36 [95% CI, 2.08-2.62], 2.28 [95%
CI, 2.07-2.51], 2.41 [95% CI, 2.16-2.69]). 인공호흡 기 역시 병상규모가 커질수록 기구사용률이 유
의하게 높았다(0.36 [95% CI, 0.358-0.362], 0.42 [95% CI, 0.418-0.422], 0.45 [95% CI, 0.448-0.452]).
그러나, 인공호흡기 관련 폐렴의 기구일수 감염 률은 인공호흡기 사용률이 낮았던 300-699, 700-
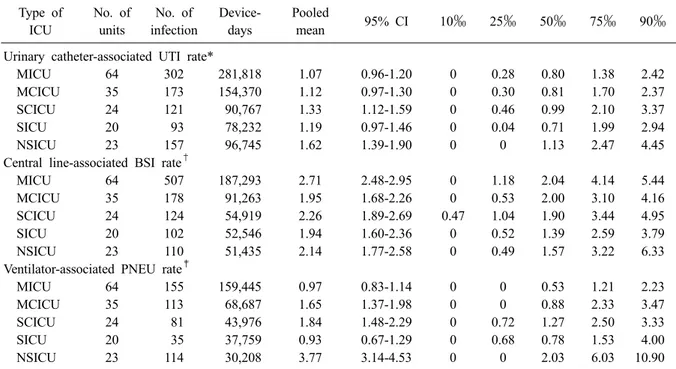
Table 5. Pooled means and percentiles of the distribution of device- associated infection rates, by type of ICU, July 2013 through June 2014
Type of ICU
No. of units
No. of infection
Device- days
Pooled
mean 95% CI 10‰ 25‰ 50‰ 75‰ 90‰
Urinary catheter-associated UTI rate*
MICU 64 302 281,818 1.07 0.96-1.20 0 0.28 0.80 1.38 2.42
MCICU 35 173 154,370 1.12 0.97-1.30 0 0.30 0.81 1.70 2.37
SCICU 24 121 90,767 1.33 1.12-1.59 0 0.46 0.99 2.10 3.37
SICU 20 93 78,232 1.19 0.97-1.46 0 0.04 0.71 1.99 2.94
NSICU 23 157 96,745 1.62 1.39-1.90 0 0 1.13 2.47 4.45
Central line-associated BSI rate
†MICU 64 507 187,293 2.71 2.48-2.95 0 1.18 2.04 4.14 5.44
MCICU 35 178 91,263 1.95 1.68-2.26 0 0.53 2.00 3.10 4.16
SCICU 24 124 54,919 2.26 1.89-2.69 0.47 1.04 1.90 3.44 4.95
SICU 20 102 52,546 1.94 1.60-2.36 0 0.52 1.39 2.59 3.79
NSICU 23 110 51,435 2.14 1.77-2.58 0 0.49 1.57 3.22 6.33
Ventilator-associated PNEU rate
‡MICU 64 155 159,445 0.97 0.83-1.14 0 0 0.53 1.21 2.23
MCICU 35 113 68,687 1.65 1.37-1.98 0 0 0.88 2.33 3.47
SCICU 24 81 43,976 1.84 1.48-2.29 0 0.72 1.27 2.50 3.33
SICU 20 35 37,759 0.93 0.67-1.29 0 0.68 0.78 1.53 4.00
NSICU 23 114 30,208 3.77 3.14-4.53 0 0 2.03 6.03 10.90
*(No. of urinary catheter-associated UTIs/No. of urinary catheter-days)×1,000;
†(No. of central line-associated BSIs/No.
of central line-days)×1,000;
‡(No. of ventilator-associated PNEUs/No. of ventilator-days)×1,000.
Abbreviations: ICU, intensive care unit; MICU, medical ICU; MCICU, medical combined ICU; SCICU, surgical com- bined ICU; SICU, surgical ICU; NSICU, neurosurgical ICU; UTI, urinary tract infection; BSI, bloodstream infection;
PNEU, pneumonia; CI, confidence interval.
899병상 규모의 병원이 900병상 이상인 병원에 비해 유의하게 높았다(1.37 [95% CI, 1.16-1.62], 1.88 [95% CI, 1.67-2.12] vs. 0.94 [95% CI, 0.76- 1.15]).
5. 중환자실 유형에 따른 기구일수 감염률과 기구사용률의 비교
요로카테터 관련 요로감염은 신경외과계 중환 자실에서 다른 유형의 중환자실들에 비해 감염 률이 가장 높았고(1.62 [95% CI, 1.39-1.90]), 내과 계 중환자실에서 가장 낮았다(1.07 [95% CI, 0.96- 1.20]). 중심정맥관 관련 혈류감염은 내과계 중환 자실에서 가장 높았고(2.71 [95% CI, 2.48-2.95]), 외과계 중환자실에서 가장 낮았으며(1.94 [95%
CI, 1.60-2.36]), 인공호흡기 관련 폐렴은 신경외 과계 중환자실에서 다른 중환자실에 비해 감염 률이 유의하게 가장 높았고(3.77 [95% CI, 3.14- 4.53]) 외과계 중환자실과 내과계 중환자실의 감 염률이 다른 중환자실에 비해 낮았다(0.93 [95%
CI, 0.67-1.29], 0.97 [95% CI, 0.83-1.14]) (Table 5).
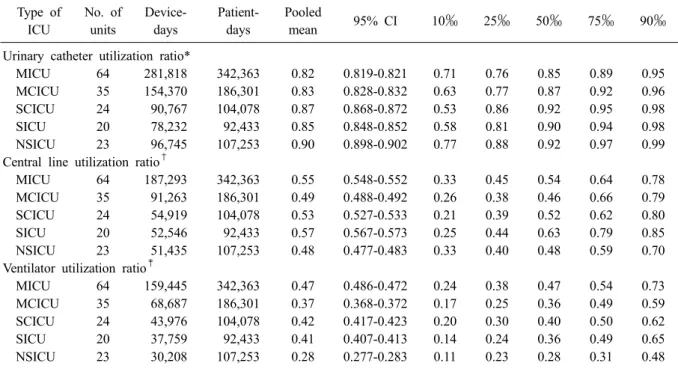
요로카테터 사용률은 내과계 중환자실에서 가장 낮았으며(0.82 [95% CI, 0.819-0.821]), 신경외과계 중환자실에서 가장 높았다(0.90 [95% CI, 0.898- 0.902]). 중심정맥관 사용률은 신경외과계 중환자 실에서 가장 낮았으며(0.48 [95% CI, 0.477- 0.483]), 외과계 중환자실에서 가장 높았다(0.57 [95% CI, 0.567-0.573]). 인공호흡기 사용률은 신 경외과계 중환자실에서 가장 낮았으며(0.28 [95%
CI, 0.277-0.283]), 내과계 중환자실에서 가장 높 았다(0.47 [95% CI, 0.486-0.472]) (Table 6).
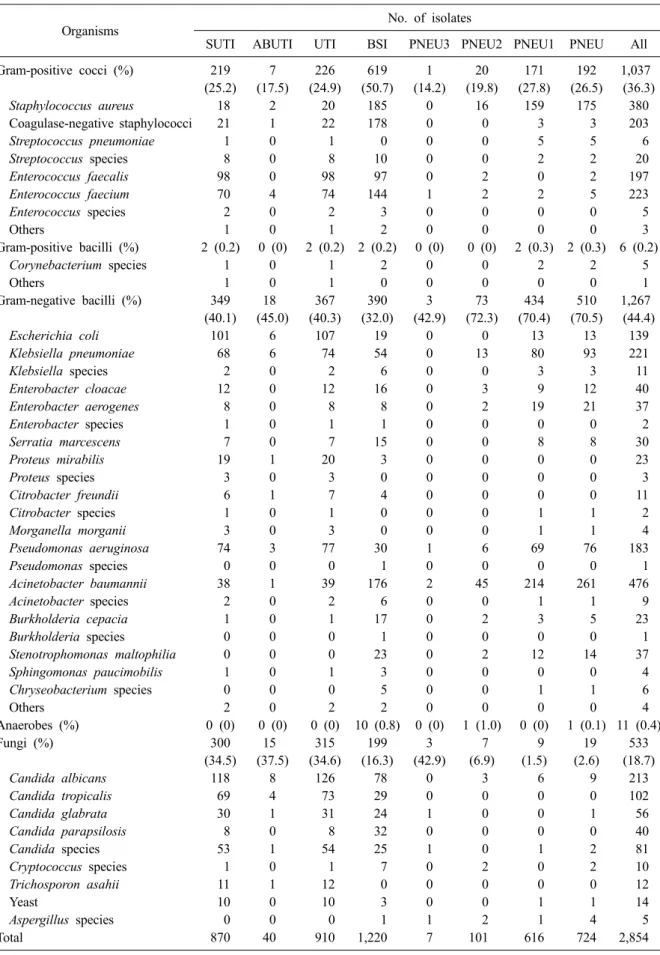
6. 원인미생물과 주요 미생물의 항생제 내성률 총 2,843건의 감염에서 2,854개의 미생물이 분 리되었고, 감염병에 따른 원인미생물을 Table 7에 기술하였다. 주요 세균의 주요 항생제에 대한 내 성률은 Table 8에 기술하였다.
Table 6. Pooled means and percentiles of the distribution of device- utilization ratios, by type of ICU, July 2013 through June 2014
Type of ICU
No. of units
Device- days
Patient- days
Pooled
mean 95% CI 10‰ 25‰ 50‰ 75‰ 90‰
Urinary catheter utilization ratio*
MICU 64 281,818 342,363 0.82 0.819-0.821 0.71 0.76 0.85 0.89 0.95
MCICU 35 154,370 186,301 0.83 0.828-0.832 0.63 0.77 0.87 0.92 0.96
SCICU 24 90,767 104,078 0.87 0.868-0.872 0.53 0.86 0.92 0.95 0.98
SICU 20 78,232 92,433 0.85 0.848-0.852 0.58 0.81 0.90 0.94 0.98
NSICU 23 96,745 107,253 0.90 0.898-0.902 0.77 0.88 0.92 0.97 0.99
Central line utilization ratio
†MICU 64 187,293 342,363 0.55 0.548-0.552 0.33 0.45 0.54 0.64 0.78
MCICU 35 91,263 186,301 0.49 0.488-0.492 0.26 0.38 0.46 0.66 0.79
SCICU 24 54,919 104,078 0.53 0.527-0.533 0.21 0.39 0.52 0.62 0.80
SICU 20 52,546 92,433 0.57 0.567-0.573 0.25 0.44 0.63 0.79 0.85
NSICU 23 51,435 107,253 0.48 0.477-0.483 0.33 0.40 0.48 0.59 0.70
Ventilator utilization ratio
‡MICU 64 159,445 342,363 0.47 0.486-0.472 0.24 0.38 0.47 0.54 0.73
MCICU 35 68,687 186,301 0.37 0.368-0.372 0.17 0.25 0.36 0.49 0.59
SCICU 24 43,976 104,078 0.42 0.417-0.423 0.20 0.30 0.40 0.50 0.62
SICU 20 37,759 92,433 0.41 0.407-0.413 0.14 0.24 0.36 0.49 0.65
NSICU 23 30,208 107,253 0.28 0.277-0.283 0.11 0.23 0.28 0.31 0.48
*(No. of urinary catheter-days/No. of patient-days);
†(No. of central line-days/No. of patient-days);
‡(No. of ven- tilator-days/No. of patient-days).
Abbreviations: ICU, intensive care unit; MICU, medical ICU; MCICU, medical combined ICU; SCICU, surgical com- bined ICU; SICU, surgical ICU; NSICU, neurosurgical ICU; UTI, urinary tract infection; BSI, bloodstream infection;
PNEU, pneumonia; CI, confidence interval.
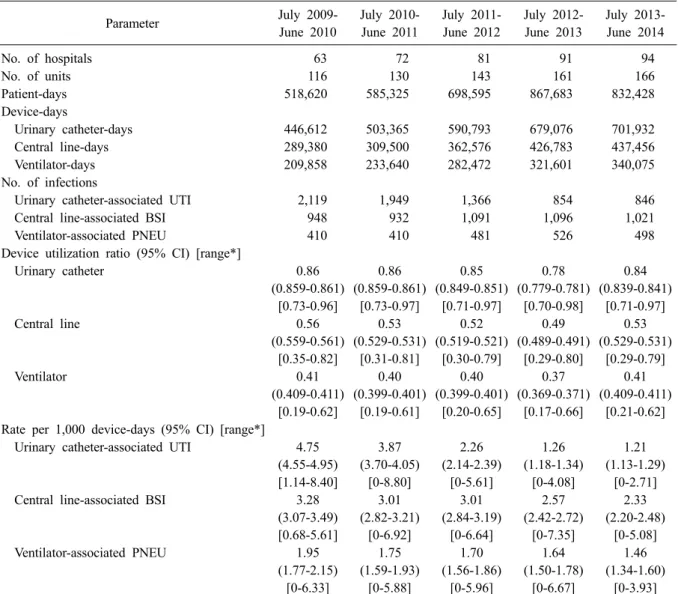
7. 2009-2014년도의 기구사용률과 기구일수 감 염률 비교
2013년 7월부터 2014년 6월까지의 기구사용률 과 기구일수 병원감염률을 연간자료로 발표된 KONIS 전년도 4개년 자료와 비교하였다(Table 9).
요로카테터, 중심정맥관, 인공호흡기 기구사용률 모두 전년도에 비해 유의하게 증가하였으나 기구 일수 감염률에서는 유의한 차이가 없었다[12]. 요 로카테터의 기구사용률은 2011년에서 2013년까 지 유의하게 감소하였으나 2013년과 2014년사이 에는 증가 소견을 보였다. 카테터관련 요로감염 의 기구일수 감염률은 2011년 10월부터 무증상 세균뇨가 보고 대상에서 제외되어 연도별 비교 는 어려우나 변경된 이후인 전년도 자료와 비교 할 때 요로카테터 기구사용률 증가에도 불구하 고 카테터관련 요로감염률의 유의한 증가는 없 었다. 중심정맥관 기구사용률도 2010-2013년까지 감소하였다가 2014년에 증가하였다. 그러나, 중 심정맥관 관련 혈류감염의 기구일수 감염률은
증가하지 않았고, 2010-2012년 감염률과 비교하 면 유의하게 낮았다. 인공호흡기의 기구사용률도 전년도에 비해서 유의하게 높았으나(0.37 [95%
CI, 0.369-0.371) vs. 0.41 [0.409-0.411]) 인공호흡 기 관련 폐렴의 기구일수 감염률은 유의한 차이 는 아니었지만 지속적으로 감소하는 경향을 보 였다.
Discussion
KONIS 중환자실 부문은 2006년 7월부터 의료 관련감염 감시를 시작하여 2007년 7월부터 연간 자료를 발표하기 시작하였으며, 이번 결과보고는 일곱 번째 연간자료이다. KONIS에서는 2007년 7 월부터 각 병원의 사정을 감안하여 참여병원에 서 참여 여부를 분기별로 스스로 선택하도록 하 고 있는데 2013년 3분기에는 93개 병원 164개 중 환자실, 4분기에는 88개 병원 154개 중환자실, 2014년 1분기에는 81개 병원 140개 중환자실, 2 분기에는 80개 병원 137개 중환자실이 참여하였
Table 7. Number (%) of microorganisms isolated from clinical specimens of patients with nosocomial infections
Organisms No. of isolates
SUTI ABUTI UTI BSI PNEU3 PNEU2 PNEU1 PNEU All
Gram-positive cocci (%) 219 (25.2)
7 (17.5)
226 (24.9)
619 (50.7)
1 (14.2)
20 (19.8)
171 (27.8)
192 (26.5)
1,037 (36.3)
Staphylococcus aureus 18 2 20 185 0 16 159 175 380
Coagulase-negative staphylococci 21 1 22 178 0 0 3 3 203
Streptococcus pneumoniae 1 0 1 0 0 0 5 5 6
Streptococcus species 8 0 8 10 0 0 2 2 20
Enterococcus faecalis 98 0 98 97 0 2 0 2 197
Enterococcus faecium 70 4 74 144 1 2 2 5 223
Enterococcus species 2 0 2 3 0 0 0 0 5
Others 1 0 1 2 0 0 0 0 3
Gram-positive bacilli (%) 2 (0.2) 0 (0) 2 (0.2) 2 (0.2) 0 (0) 0 (0) 2 (0.3) 2 (0.3) 6 (0.2)
Corynebacterium species 1 0 1 2 0 0 2 2 5
Others 1 0 1 0 0 0 0 0 1
Gram-negative bacilli (%) 349 (40.1)
18 (45.0)
367 (40.3)
390 (32.0)
3 (42.9)
73 (72.3)
434 (70.4)
510 (70.5)
1,267 (44.4)
Escherichia coli 101 6 107 19 0 0 13 13 139
Klebsiella pneumoniae 68 6 74 54 0 13 80 93 221
Klebsiella species 2 0 2 6 0 0 3 3 11
Enterobacter cloacae 12 0 12 16 0 3 9 12 40
Enterobacter aerogenes 8 0 8 8 0 2 19 21 37
Enterobacter species 1 0 1 1 0 0 0 0 2
Serratia marcescens 7 0 7 15 0 0 8 8 30
Proteus mirabilis 19 1 20 3 0 0 0 0 23
Proteus species 3 0 3 0 0 0 0 0 3
Citrobacter freundii 6 1 7 4 0 0 0 0 11
Citrobacter species 1 0 1 0 0 0 1 1 2
Morganella morganii 3 0 3 0 0 0 1 1 4
Pseudomonas aeruginosa 74 3 77 30 1 6 69 76 183
Pseudomonas species 0 0 0 1 0 0 0 0 1
Acinetobacter baumannii 38 1 39 176 2 45 214 261 476
Acinetobacter species 2 0 2 6 0 0 1 1 9
Burkholderia cepacia 1 0 1 17 0 2 3 5 23
Burkholderia species 0 0 0 1 0 0 0 0 1
Stenotrophomonas maltophilia 0 0 0 23 0 2 12 14 37
Sphingomonas paucimobilis 1 0 1 3 0 0 0 0 4
Chryseobacterium species 0 0 0 5 0 0 1 1 6
Others 2 0 2 2 0 0 0 0 4
Anaerobes (%) 0 (0) 0 (0) 0 (0) 10 (0.8) 0 (0) 1 (1.0) 0 (0) 1 (0.1) 11 (0.4)
Fungi (%) 300
(34.5) 15 (37.5)
315 (34.6)
199 (16.3)
3 (42.9)
7 (6.9)
9 (1.5)
19 (2.6)
533 (18.7)
Candida albicans 118 8 126 78 0 3 6 9 213
Candida tropicalis 69 4 73 29 0 0 0 0 102
Candida glabrata 30 1 31 24 1 0 0 1 56
Candida parapsilosis 8 0 8 32 0 0 0 0 40
Candida species 53 1 54 25 1 0 1 2 81
Cryptococcus species 1 0 1 7 0 2 0 2 10
Trichosporon asahii 11 1 12 0 0 0 0 0 12
Yeast 10 0 10 3 0 0 1 1 14
Aspergillus species 0 0 0 1 1 2 1 4 5
Total 870 40 910 1,220 7 101 616 724 2,854
Table 8. Susceptibilities of major pathogens isolated from patients with nosocomial infections
Organisms No. of resistant/total isolates (%)
Methicillin-resistant Staphylococcus aureus 333/380 (87.6)
Vancomycin-resistant Enterococcus faecalis 9/197 (4.6)
Vancomycin-resistant Enterococcus faecium 110/223 (49.3)
Cefotaxime-resistant Escherichia coli 65/139 (46.8)
Cefotaxime-resistant Klebsiella pneumoniae 129/221 (58.3)
Ciprofloxacin-resistant Escherichia coli 86/139 (61.9)
Ciprofloxacin-resistant Klebsiella pneumoniae 104/221 (47.1)
Imipenem-resistant Pseudomonas aeruginosa 81/183 (44.3)
Imipenem-resistant Acinetobacter baumannii 420/476 (88.2)
Table 9. Comparison of the device utilization ratios and the rates of device-associated infections from 2009 through 2014
Parameter July 2009-
June 2010
July 2010- June 2011
July 2011- June 2012
July 2012- June 2013
July 2013- June 2014
No. of hospitals 63 72 81 91 94
No. of units 116 130 143 161 166
Patient-days 518,620 585,325 698,595 867,683 832,428
Device-days
Urinary catheter-days 446,612 503,365 590,793 679,076 701,932
Central line-days 289,380 309,500 362,576 426,783 437,456
Ventilator-days 209,858 233,640 282,472 321,601 340,075
No. of infections
Urinary catheter-associated UTI 2,119 1,949 1,366 854 846
Central line-associated BSI 948 932 1,091 1,096 1,021
Ventilator-associated PNEU 410 410 481 526 498
Device utilization ratio (95% CI) [range*]
Urinary catheter 0.86
(0.859-0.861) [0.73-0.96]
0.86 (0.859-0.861)
[0.73-0.97]
0.85 (0.849-0.851)
[0.71-0.97]
0.78 (0.779-0.781)
[0.70-0.98]
0.84 (0.839-0.841)
[0.71-0.97]
Central line 0.56
(0.559-0.561) [0.35-0.82]
0.53 (0.529-0.531)
[0.31-0.81]
0.52 (0.519-0.521)
[0.30-0.79]
0.49 (0.489-0.491)
[0.29-0.80]
0.53 (0.529-0.531)
[0.29-0.79]
Ventilator 0.41
(0.409-0.411) [0.19-0.62]
0.40 (0.399-0.401)
[0.19-0.61]
0.40 (0.399-0.401)
[0.20-0.65]
0.37 (0.369-0.371)
[0.17-0.66]
0.41 (0.409-0.411)
[0.21-0.62]
Rate per 1,000 device-days (95% CI) [range*]
Urinary catheter-associated UTI 4.75 (4.55-4.95) [1.14-8.40]
3.87 (3.70-4.05)
[0-8.80]
2.26 (2.14-2.39)
[0-5.61]
1.26 (1.18-1.34)
[0-4.08]
1.21 (1.13-1.29)
[0-2.71]
Central line-associated BSI 3.28
(3.07-3.49) [0.68-5.61]
3.01 (2.82-3.21)
[0-6.92]
3.01 (2.84-3.19)
[0-6.64]
2.57 (2.42-2.72)
[0-7.35]
2.33 (2.20-2.48)
[0-5.08]
Ventilator-associated PNEU 1.95
(1.77-2.15) [0-6.33]
1.75 (1.59-1.93)
[0-5.88]
1.70 (1.56-1.86)
[0-5.96]
1.64 (1.50-1.78)
[0-6.67]
1.46 (1.34-1.60)
[0-3.93]
*10th to 90th percentile range.
Abbreviations: ICU, intensive care unit; UTI, urinary tract infection; BSI, bloodstream infection; PNEU, pneumonia; CI,
confidence interval.
고 분기별로 고르게 분포하였다. 총 166개 중환 자실 중에서 82.5%에 해당하는 137개 중환자실 은 12개월 동안 계속 참여하여 감시를 수행하였 다. 12개월 동안 지속적으로 감시를 수행하는 참 여 중환자실의 비율이 2007년 96개 중환자실 중 44개(45.8%), 전년도에 161개 중환자실 중 131개 (81.4%)로 증가하였고, 이번 보고에서도 166개 중환자실 중 137개(82.5%)로 증가한 상태로 유지 되고 있어 의료관련감염 감시에 대한 각 참여병 원의 관심과 필요성에 대한 인식이 증가하였음 을 알 수 있다.
참여병원의 특성을 병실 규모로 구분하여 보 았을 때 900병상 이상의 병원은 21개(22.3%)로 전년도와 동일한 수인데 비해 700-899 병상 병원 이 29개에서 32개(34.1%) 병원으로 증가하였고, 300-699병상 규모의 병원이 41개(43.6%)로 전년 도에 증가한 상태로 유지되었다. 7개의 병원은 300-400병상 사이 규모의 병원이었으며 KONIS 참여 병원 기준이 300병상 이상이지만 그 동안 300-400병상 사이 규모의 병원이 없거나 적어서 400-699병상으로 구분하였던 것을 이번 보고에서 는 300-699병상으로 표기하였다. 중소규모의 병 원에서 KONIS 참여가 증가하는 것은 의료관련 감염 감시의 중요성과 필요성에 대한 인식이 확 대되는 것으로 해석할 수 있겠고 전국적인 의료 관련감염 감시체계를 지향하는 KONIS의 의도에 부합하는 바람직한 현상으로 생각된다. 새로 참 여하는 병원에서 신뢰도 높은 자료를 제공할 수 있도록 지속적인 교육과 피드백이 필요하겠다.
확인된 병원감염은 2,843건이었으며 혈류감염 (1,173건), 요로감염(861건), 폐렴(809건)의 순으로 2011년 이전에 요로감염이 가장 흔한 병원감염이 었던 것과는 차이가 있는 결과이다[9,11]. 이는 요로감염의 보고기준이 변경되어 2011년 4분기 부터 무증상 세균뇨가 제외된 것이 영향을 미쳤 을 가능성이 높으며 전년도에 혈류감염이 가장 흔하게 보고된 것과는 유사한 경향이었다[12]. 전 년도 자료에서 감소하였던 세 가지 기구사용률 은 모두 증가하였는데 기구일수 감염률은 전년 도 자료와 유의한 차이는 없었다. 중심정맥관 관 련 혈류감염의 기구일수 감염률은 전년도에 감 소하여 그 수준으로 유지되었으며 2010-2012년 3
년간의 감염률과 비교할 때 유의하게 감소하였 다.
900병상 이상의 병원에서 900병상 미만 병원 에 비해 인공호흡기 기구사용률이 유의하게 높 음에도 불구하고 인공호흡기 관련 폐렴의 기구 일수 감염률은 더 낮았다. 이는 전년도 자료와도 유사한 경향이며 인공호흡기관련 폐렴이 요로감 염이나 혈류감염에 비해 상대적으로 인력과 자 원이 제한된 병원에서 더 문제가 된다는 과거 연 구 결과를 참고할 때 900병상 미만 중소규모 병 원의 중환자실 감염관리에 대해 더 많은 지원이 필요하겠다[13].
분리된 주요 세균의 항생제 내성률을 비교해 보았을 때 Enterococcus faecium의 vancomycin 내 성률은 2012년 이후 증가된 상태로 유지되고 있 고, Escherichia coli의 ciprofloxacin에 대한 내성률 도 2012년부터 증가 추세를 보이고 있다. Staphy- lococcus aureus의 methicillin 내성률과 Acinetobac- ter baumannii의 imipenem 내성률을 비롯하여 전 반적으로 주요 세균의 항생제 내성률이 감소하 지 않고 높은 상태로 유지되고 있어 항생제 내성 률 감소를 위한 적극적인 감염관리 활동과 노력 이 필요할 것으로 생각된다.
의료관련감염 예방을 위한 지침을 적극적으로 수행하기 위해서는 많은 인적, 물적 자원이 필요 하다. 현재는 이러한 필요 자원의 대부분을 각 병원에서 부담하고 있는 실정이다. 중소규모의 병원에서 기구사용률이 낮음에도 기구일수 감염 률이 유사한 수준이거나 높은 현상에 대해서는 보다 구체적인 원인 분석 연구가 필요하겠으나 감염관리를 위해 사용할 수 있는 자원의 차이가 영향을 미쳤을 가능성을 배제할 수 없다. 따라서, 의료관련감염 예방을 위해 각 병원에서 충분한 자원을 큰 부담 없이 사용할 수 있도록 정부 차 원의 보상이나 보험수가 정책 등 구체적 지원 방 안 마련이 필요할 것으로 생각된다.
KONIS는 각 참여병원이 자발적으로 참여하여 감시를 수행하는 시스템이기 때문에 신뢰도 높 은 자료를 확보하기 위해서 각 병원의 자료에 대 한 보안이 최우선적으로 유지되어야 한다. 각 병 원의 감염률은 민감한 자료이고 환자군의 특성, 병상수, 증례 발견 방법 등에 따라 감염률이 달
라질 수 있기 때문에 감염률 자체가 병원을 비교 하는 절대적인 진료의 질 지표로 사용될 수 없 다. KONIS가 지속적으로 의료관련감염감시를 위 한 네트워크 역할을 수행하고 KONIS의 자료가 감염관리 활동의 표준적인 지표로 지속적으로 활용되기 위해서는 자료의 신뢰도가 유지되어야 하고 이를 위해서는 감시결과에 대한 보안이 무 엇보다 중요하다.
2006년에 처음 시작된 이후로 KONIS는 지금 까지 안정적이고 지속적으로 유지되고 있으며, 참여병원의 수나 12개월 동안 지속적으로 참여 하는 병원이 증가하고 있다. 2013년 7월에서 2014년 6월까지 중환자실 병원감염 자료를 분석 한 결과, 혈류감염이 가장 흔하게 보고되었고, 전 년도와 비교할 때 기구사용률이 모두 증가하였 으나 기구일수 감염률에서 유의한 증가는 나타 나지 않았다.
Summary
배경: 전국병원감염감시체계(Korean Nosocomial Infections Surveillance System, KONIS) 중환자실 부문에서 2013년 7월부터 2014년 6월까지 감시를 수행한 일곱 번째 연간 자료를 정리하여 보고한 다.
방법: 전국에 있는 94개 병원의 166개 중환자 실에서 발생한 원내 요로감염, 혈류감염, 폐렴에 대해 전향적으로 감시를 수행하였다. 병원감염률 은 1,000 재원일수 또는 기구일수 당 감염 건수 로 구하였다.
결과: 총 2,843건의 병원감염이 발생하였는데, 요로감염이 861건, 혈류감염이 1,173건, 폐렴이 809건이었다. 요로카테터 관련 요로감염은 846건 으로 1,000 기구일 당 1.21건 (95% 신뢰구간, 1.13- 1.29)이었고, 요로카테터 사용률은 0.84 (0.839-0.841) 였다. 중심정맥관 관련 혈류감염은 1,021건으로 감 염률은 2.33 (2.20-2.48)이었고, 중심정맥관 사용률 은 0.53 (0.529-0.531)였다. 인공호흡기 관련 폐렴은 498건으로 감염률은 1.46 (1.34-1.60)이었고, 인공 호흡기 사용률은 0.41 (0.409-0.411)이었다. 300-699 병상의 병원 중환자실에서 그 이상 규모의 병원 중환자실에 비해 기구사용률이 낮았음에도 카테
터관련 요로감염은 의미있게 더 많았다. 인공호흡 기관련 폐렴은 900병상 이상 병원에서 인공호흡 기 사용률이 높았음에도 가장 낮은 감염률을 보였 다.
결론: 병원감염률은 전년도 조사 결과와 유사 하였으며 혈류감염이 가장 흔하게 보고되었다.
Acknowledgements
이 연구는 2014년도 질병관리본부 정책연구용 역사업인 ‘전국 중환자실 의료관련감염 감시체계 운영’ 결과입니다. 전국병원감염감시체계 중환자 실 부문에 참여해 주신 모든 참여병원 연구자 분 들께 감사 드립니다.
References
1. Burke JP. Infection control - a problem for pa- tient safety. N Engl J Med 2003;348:651-6.
2. Gastmeier P, Geffers C, Brandt C, Zuschneid I, Sohr D, Schwab F, et al. Effectiveness of a na- tionwide nosocomial infection surveillance sys- tem for reducing nosocomial infections. J Hosp Infect 2006;64:16-22.
3. Haley RW, Culver DH, White JW, Morgan WM, Emori TG, Munn VP, et al. The efficacy of infection surveillance and control programs in preventing nosocomial infections in US hos- pitals. Am J Epidemiol 1985;121:182-205.
4. Schwab F, Geffers C, Bärwolff S, Rüden H, Gastmeier P. Reducing neonatal nosocomial bloodstream infections through participation in a national surveillance system. J Hosp Infect 2007;65:319-25.
5. Kwak YG, Lee SO, Kim HY, Kim YK, Park ES, Jin HY, et al; Korean Nosocomial Infec- tions Surveillance System (KONIS). Risk fac- tors for device-associated infection related to organisational characteristics of intensive care units: findings from the Korean Nosocomial Infections Surveillance System. J Hosp Infect 2010;75:195-9.
6. Horan TC, Andrus M, Dudeck MA. CDC/
NHSN surveillance definition of health care-as- sociated infection and criteria for specific types of infections in the acute care setting. Am J Infect Control 2008;36:309-32.
7. Korean Society for Nosocomial Infection Con- trol. Korean Nosocomial Infections Surveillance Manual 2008. 2nd ed, Seoul; Gold, 2008.
8. Korean Society for Nosocomial Infection Con- trol. Korean Nosocomial Infections Surveillance Manual 2012. 4th ed, Seoul; Gold, 2012.
9. Jeon MH, Park WB, Kim SR, Chun HK, Han SH, Bang JH, et al. Korean Nosocomial Infec- tions Surveillance System, Intensive Care Unit Module Report: Data Summary from July 2010 through June 2011. Korean J Nosocomial Infect Control 2012;17:28-39.
10. Jeon MH, Kim TH, Kim SR, Chun HK, Han SH, Bang JH, et al. Korean Nosocomial Infec-
tions Surveillance System, Intensive Care Unit Module Report: Summary of Data from July 2011 through June 2012. Korean J Nosocomial Infect Control 2014;19:52-63.
11. Kwak YG, Cho YK, Kim JY, Lee MS, Kim HY, Kim YK, et al. Korean Nosocomial Infec- tions Surveillance System, Intensive Care Unit Module Report: Data Summary from July 2009 through June 2010. Korean J Nosocomial Infect Control 2011;16:1-12.
12. KONIS. KONIS ICU report. http://konis.cdc.go.
kr/konis/sub/reports_icu.htm (Updated on 27 March 2015).
13. Lee SO, Kim ES, Kim HY, Park ES, Jin HY, Ki HK, et al. Korean Nosocomial Infections Surveillance System, Intensive Care Unit Module Report: Data Summary from July 2007 through June 2008. Korean J Nosocomial Infect Control 2008;13:69-82.