Introduction
Perfusion is a physiological parameter that refers to the delivery of oxygen and nutrients to tissues via the flow of blood (1). Cerebral blood flow (CBF) is
generally quantified in terms of milliliters of blood per gram of tissue per second ml/g/sec (2). Perfusion measurements provide information regarding tissue viability and function, and are therefore of fundamental significance in the fields of medical research and clinical diagnostics.
JKSMRM 15:191-199(2011)
1Department of Radiology, Kyung Hee University Hospital at Gangdong, School of Medicine, Kyung Hee University
2Department of Electronics and Information Engineering, Korea University
Received; November 17, 2011, revised; December 5, 2011, accepted; December 21, 2011
Corresponding author : Geon-Ho Jahng, Ph.D., Department of Radiology, Kyung Hee University Hospital at Gangdong, School of Medicine, Kyung Hee University, 149 Sangil-dong, Gangdong-gu, Seoul 134-727, Korea.
Tel. 82-2-440-6187 Fax. 82-2-440-6932 E-mail: [email protected]
Simulations of Perfusion Signals of Pulsed Arterial Spin Labeling MRI
Hyug-Gi Kim1, 2, Geon-Ho Jahng1, Chang-Hyun Oh2
Purpose : A pulsed arterial spin labeling (PASL) signal usually depends on several parameters. The objective of this study was to determine the optimal parameters using simulation for perfusion signals of PASL magnetic resonance imaging (MRI).
Materials and Methods : Perfusion signals, ΔM/M0b, derived from the Bloch equation were evaluated in regard to the four most important parameters in PASL MRI: the tissue-to-blood coefficient (λ), the longitudinal relaxation time of blood (T1b), the arterial transit delay from the application of tag (δt), and the magnetic field strength (B0). The simulation was conducted with Mathematica software.
Results : First, perfusion signals differed depending on the value of λin brain tissue.
The maximum signal, ΔM/M0b = 0.390, was obtained at an inversion time (TI) = 1.53 sec for gray matter on 3T MRI. Second, perfusion signals were reduced with increasing δt. The maximum signal, ΔM/M0b = 0.526, was obtained at TI = 2.1 sec for δt = 0.5 sec. Finally, perfusion signals increased with increasing B0. The maximum signal, ΔM = 1.15, was obtained at TI = 1.52 sec for 3T MRI.
Conclusion : We reported that the optimized TI values were obtained to provide the highest PASL signals. It is very important that optimized TI values be used to obtain high-quality perfusion signals using PASL MRI.
Index words :Perfusion
Arterial spin labeling Bloch equation Cerebral blood flow
Arterial spin labeling (ASL) perfusion (3), which involves an endogenous tracer on MR images, is one of the techniques used for perfusion imaging without injection or inhalation of contrast agent or radioisotopes (4). Generally speaking, a perfusion-weighted image gathered by this technique is derived from the subtraction of two successively acquired images: one with, and one without, the proximal labeling of arterial water spins after a short delay time (5). The water employed as a tracer in ASL is largely free-diffusible.
Most ASL approaches in common use employ either pulsed labeling (PASL) with an instantaneous spatially selective saturation or inversion pulse (6), or continuous labeling (CASL), most typically via flow- driven adiabatic fast passage (7). In both of these approaches, arterial spins are tagged outside the imaging slice. Tagged spins are then permitted to flow into the slice of interest, and the image is acquired. The control image is acquired without tagging, and the signal difference between the two scans provides perfusion-weighted imaging (PWI) to estimate a quantitative CBF (8). Several PASL methods, including EPI and signal targeting with alternating radiofrequency (RF) (EPISTAR) (9, 10), flow sensitive alternating inversion recovery (FAIR) (11, 12), and proximal inversion with a control for off-resonance effects (PICORE) (7), have been proposed. Recently, additional, better PASL methods have been proposed, such as the double inversion of both tagged and reference images (DIPLOMA) (13) and improved arterial spin labeling methods (IDOL) (14).
PASL signals generally depend on several parameters (15). First, the tagging efficiency of RF pulse (α) is a key
factor in improving PASL signals. The second parameter is the tissue-to-blood partition coefficient (λ).
Knowledge of λ is usually required for the quantification of CBF. λchanges during development of the brain and varies regionally in it, even among different gray matter structures, owing to variations in brain water content. In addition, λwould be expected to vary with the hematocrit, owing to changes in blood water content. The impact of using an incorrect value will result in errors in the quantifications of CBF.
Third, the arterial transit delay time (δt) can affect measurements of the PASL signal. The transit delay for the flow of blood from the tagging region to the imaging slices in humans is not small compared with the T1 blood, and varies significantly across voxels, creating a variable attenuation of the ASL signal (7, 16);
thus resulting in errors in the calculated CBF.
Intravascular tagged blood that is flowing through the imaging slices and destined to perfuse more distal tissue can induce very large-amplitude focal artifacts in the difference signal that do not represent perfusion of the imaging slices (17). Finally, the longitudinal relaxation time of blood (T1b) and magnetic field strength (B0) are other factors.
The objective of this study was to determine optimal parameters using simulation for perfusion signals of PASL MRI. Perfusion signals, ΔM/M0b, derived from the Bloch equation were evaluated with the four most important parameters in PASL MRI: λ, T1b, δt, and B0.
Although αis an important factor in acquisitions of high signals in ASL perfusion MRI, we did not include it in this simulation because perfusion signals are only linearly scaled by it.
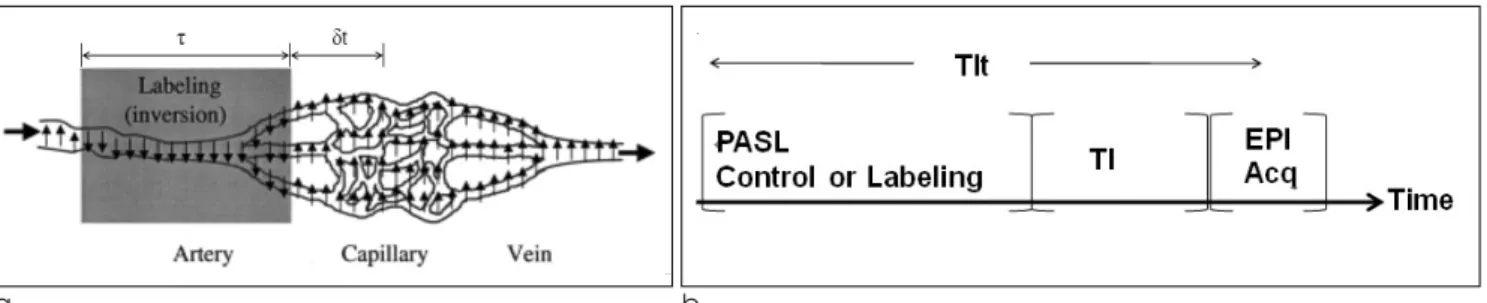
a b
Fig. 1. Schematic illustration of the labeling of the spins in the arteries (1a) and schematic of the PASL pulse sequence (1b).
τis the duration of the arrival of labeled water molecules at the tissue.
δt is the delay of water molecules between arterial labeling and exchange into tissue.
TIt is the total labeling delay time, which is the time interval from the center of the labeling radiofrequency pulse and the center of the excitation pulse.
Theory
PASL perfusion is based on the phenomenon of the inversion of signals. Fig. 1a is the schematic illustration of the labeling (inversion) of the spins in the arteries.
The proton spins of blood flow to the arteries. The Bloch equation for tissue water, including flow, can be described as follows Eq. [1] :
= + f(Ma- Mv) [1]
in which M0 is the amplitude of the fully relaxed signal, f is the cerebral blood flow (ml g-1s-1), T1is the longitudinal relaxation time of water in tissue (sec), and M(t), Ma(t), and Mv(t) are the magnetizations of water in tissue, arterial blood, and venous blood, respectively.
Assuming that water is freely diffusible, Mv= M/λand Ma = M0/λ, in which λis the brain-blood partition coefficient (ml/g).
In PASL, the arterial blood is tagged near the imaging slice by inversion, and sequential images are acquired in which blood is alternately inverted and not inverted.
We refer to these as tag and control states, respectively.
Subtraction of the tag from the control images then leaves a difference signal, ΔM which is based on a general kinetic model for PASL signals (18):
ΔM(TIt) = 2M0bα (TIt-δt)e -
∙q, δt < t <τ+δt [2]
in which M0b is the relaxed magnetization of arterial blood, αis the inversion efficiency, T1bis the T1 of arterial blood (sec), δt is the arterial transit delay (ATT, sec) from the application of the tag to the first arrival of tagged blood in the imaging slice, τis the time width of the tag (sec), and T1is the longitudinal relaxation time of water in tissue. TIt is the total labeling delay time.
The timing diagram schematic of the PASL pulse sequence is provided in Fig. 1b.
The q-factor is a correction factor for the fact that the rate of decay of the tag switches from that of blood to the tag by flow. If we assume that blood water exchanges instantly and completely with tissue water upon reaching the capillary bed, and that tissue water follows single-compartment kinetics, then the q-factor is represented as Eq.[3]. A typical CBF value is 60 mL/100 mL/min, providing a rate constant of 0.01 s-1. The rate constant for the clearance of tagged water by T1 decay is 1/T1, or approximately 1.1 s-1. Thus, the clearance of the tag is dominated by T1 decay, and clearance by flow is likely to be insignificant. The q- factor is dimensionless and typically has a value near 1.
If T1b= 1.6 sec, T1for gray matter is 0.9 sec, f = 0.01 sec-1, λ= 0.9, δt = 1.0 sec, and TIt= 1.3 sec--which are the general parameters used at 3T (7) are assumed, the q-factor value is approximately 0.94. That is, it approaches 1 in accordance with the parameter values.
It is important to note that the expressions provided here for the difference signal assume that the parameters (δt, τ, T1b, etc.) are uniform across each voxel, which is certainly not the case. The actual signal is an average across heterogeneous populations of vessels and tissues, but we begin with these simple expressions to determine how well they describe the experimental data and provide insights into the relevant contrast mechanisms.
TIt T1b
f λ M0- M(t)
T1 dM(t)
dt
q = e
{ - ( + )}(TIt - δt)
-1 [3]
{ - ( + )}(TIf t-δt) λ
1 T1 1 T1b
f λ 1 T1
1 T1b
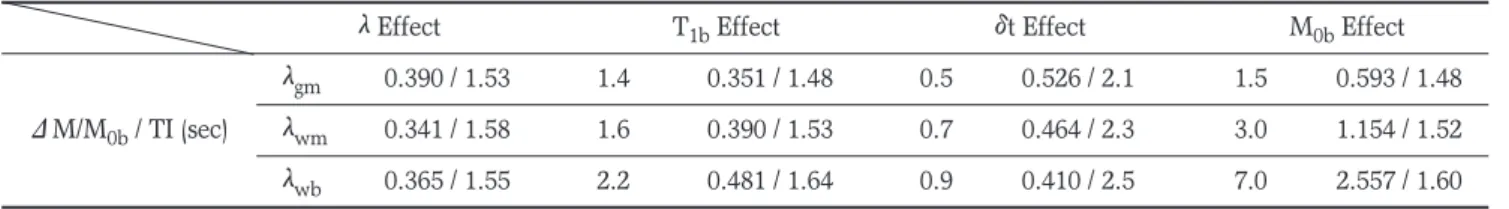
Table 1.Values of Parameters Used in Four Simulations Parameters
Simulation λ(ml/g) T1b(sec) δt (sec) M0b(T)
λeffect 1.05(λgm) / 0.86(λwm) / 0.95(λwb) 1.6 0.7 3.0
T1beffect 1.05 1.4 (1.5T) / 1.6 (3T) / 2.2 (7T) 0.7 3.0
δt effect 1.05 1.6 0.5 / 0.7 / 0.9 3.0
M0beffect 1.05 1.4 (1.5T) / 1.6 (3T) / 2.2 (7T) 0.7 1.5 / 3.0 / 7.0
For all simulations, α= 1.
λgm, λwm, and λwb: the tissue-to-blood partition coefficient for gray matter, white matter, and whole brain, respectively. T1b: blood longitudinal relaxation time. δt : the arterial transit delay time. M0b: the strength of magnetic field.
Materials and Methods
To determine how to change the q-factor and the corresponding magnetization signal for each of the parameter, we simulated (M/M0band the q-factor based on Eq. [2] and [3]. Mathematica 7.0 (Wolfram Research Inc., IL, USA) software was used to simulate these parameters. Values of the parameters employed in the four simulations are shown in Table 1.
a. Tissue-to-blood partition coefficient λλeffect on the q-factor and ΔΔM/M0b
To evaluate the effect of λon the q-factor and (M/M0b, λwas varied according to brain tissue (19). For the well- perfused tissue, the incompleteness was no more than 1%. Therefore, the coefficient of tissue in brain would be only slightly affected by errors in the assumed perfusion (20). Parameter values to simulate λwere λgm
= 1.03 ml/g , λwm= 0.86 ml/g, and λwh= 0.95 ml/g for gray matter, white matter, and whole brain,
respectively. The range of TI was 0 ~ 5.0 sec. Other factors except for λwere fixed as α= 1, T1b= 1.6 sec, δt = 0.7 sec, and T1= 0.977 sec. The simulation was assumed to be 3T.
b. Blood longitudinal relaxation time T1beffect on the q-factor and ΔΔM/M0b
To evaluate the effect of T1b on the q-factor and (M/M0b, the q-factor was evaluated for T1bvalues of 1.4, 1.6, and 2.2 sec for 1.5T (21, 22) 3.0T (22, 23), and 7T (22, 24) MRI. The range of TI was from 0 to 5 sec.
(M/M0b was simulated using the simulation result of the q-factor. Factors except for T1bvalues were fixed as α= 1, δt = 0.7 sec, and λgm= 1.03 ml/g. The factor λ was used the value of gray matter in the brain. T1b values were 1.4 sec, 1.6 sec, and 2.2 sec, for 1.5T, 3.0T, and 7.0T respectively.
c. Arterial transit delay δδt effect on the q-factor and Δ
ΔM/M0b
To evaluate the effect of δt on the q-factor and
Table 2. The Maximum Value of Perfusion Signals and Inversion Time at the Maximum Value
λEffect T1bEffect δt Effect M0bEffect
λgm 0.390 / 1.53 1.4 0.351 / 1.48 0.5 0.526 / 2.1 1.5 0.593 / 1.48 ΔM/M0b/ TI (sec) λwm 0.341 / 1.58 1.6 0.390 / 1.53 0.7 0.464 / 2.3 3.0 1.154 / 1.52 λwb 0.365 / 1.55 2.2 0.481 / 1.64 0.9 0.410 / 2.5 7.0 2.557 / 1.60
* λgm, λwm, and λwb, : the tissue-to-blood partition coefficients for gray matter, white matter, and whole brain, respectively. Unit of T1b and δt are sec and the unit of M0bis Tesla.
a b
Fig. 2. Simulation results of the q-factor (2a) and perfusion signals (2b) depended on three different values of tissue-to- blood partition coefficient (λ).
Whole brain (Solid line), gray matter (Dotted line), and white matter (Dashed line) Other parameters were used for T1b= 1.6 sec, δt = 0.7 sec, and α= 1 at 3T.
(M/M0b, the q-factor was evaluated for δt values of three different cases, which were 0.5, 0.7, and 0.9 sec.
The range of TI was from 0 to 5 sec. (M/M0b was simulated using the simulation results for the q-factor.
Factors except for the δt values were fixed as α= 1, T1b
= 1.6 sec, and λgm= 1.03 ml/g. The factor λwas used the value of gray matter in the brain. The simulation was assumed to be 3T.
d. Strength of the magnetic field M0beffect on the q- factor and ΔΔM
The strengths of the magnetic field also do not affect the q-factor because there is no M0b term in Eq. [2].
Therefore, M0b simulated only the difference in magnetization. We considered the three different magnetic field strengths of 1.5T, 3.0T, and 7T in regard to our ASL perfusion MRI. In this simulation, we also took into consideration the longitudinal relaxation time of blood values (23). T1bvalues were 1 sec, 1.3 sec, and 1.5 sec, for 1.5T, 3.0T, and 7.0T respectively. Other factor values were α= 1, δt = 0.7 sec, λgm= 1.03 ml/g, and T1bvalues were assumed to be 1.4 sec, 1.6 sec, and 2.2 sec, for 1.5T, and 3.0T, and 7.0T, respectively.
Results
The maximum value of perfusion signals and the corresponding inversion time are shown in Table 2.
a. Tissue-to-blood partition coefficient λλeffect on the q-factor and ΔΔM/M0b
Fig. 2 shows the simulation results of the q-factor (2a) and ΔM/M0b(2b) in accordance with λfor gray matter, white matter, and whole brain. All three q-factor lines showed a similar pattern of monotonic decrease with increasing TI values. The q-factor was least, with the largest λfor all TI ranges.
ΔM/M0b shown in Fig. 2b was dramatically varied with varying λ. ΔM/M0bwas increased with increasing λor decreasing the q-factor. ΔM/M0bwas progressively increased with increasing TI, reached a broad maximum at TI ~ 1.7 sec, and declined with further increases in TI for all three different tissues. The maximum values of ΔM/M0bwere 0.390 at TI = 1.53 sec for gray matter, 0.365 at TI = 1.55 sec for whole brain, and 0.341 at TI = 1.58 sec for white matter.
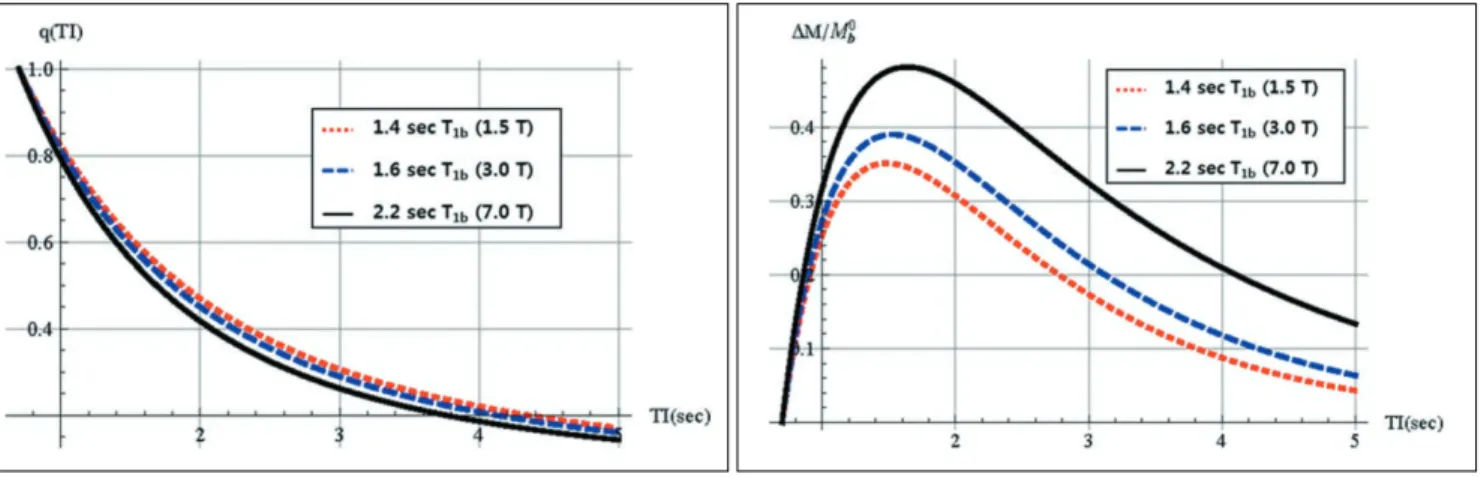
b. Blood longitudinal relaxation time T1beffect on the q-factor and ΔΔM/M0b
Fig. 3 shows the simulation results of the q-factor (3a) and ΔM/M0b (3b) depended on the T1 of blood for three different magnetic strengths for the gray matter in the brain. All three q-factor lines evidenced a similar pattern of monotonic decrease with increasing TI values. The q-factor was largest with the largest T1bfor all TI ranges.
ΔM/M0bshown in Fig. 3b increased progressively with increasing TI, reached a broad maximum at TI ~ 1.7 sec, and then declined with further increases in TI.
a b
Fig. 3. Simulation results of the q-factor (3a) and perfusion signals (3b) depended on the longitudinal relaxation time of blood (T1b)
T1bat 1.5T (Dotted line), at 3T (Dashed line), and at 7T (Solid line)
Other parameters were used for λgm= 1.05 ml/g, δt = 0.7 sec, and α= 1 at 3T. T1bvalues were 1.4 sec, 1.6 sec, and 2.2 sec, for 1.5T, 3.0T, and 7.0T respectively.
Perfusion signals were increased with increasing T1b, as anticipated. The maximum values of ΔM/M0bwere 0.351 at TI = 1.48 sec for T1b= 1.4 sec (1.5T), 0.390 at TI = 1.53 sec for T1b= 1.6 sec (3T), and 0.481 at TI = 1.64 sec for T1b= 2.2 sec (7T).
c. Arterial transit delay δδt effect on the q-factor and Δ
ΔM/M0b
Fig. 4 shows the simulation results of the q-factor (3a) and ΔM/M0b (3b) depended on δt for gray matter in the brain at 3T. All three q-factor lines evidenced a similar pattern of monotonic decrease with increasing TI value. The q-factor was largest with the largest δt for all TI ranges.
ΔM/M0b shown in Fig. 4b increased progressively with increasing TI, reached a broad maximum at TI ~ 1.7 sec, and declined with further increasing TI.
Perfusion signals were reduced with increasing δt. The maximum values of ΔM/M0b were 0.526 at TI = 2.1 sec for δt = 0.5 sec, 0.464 at TI = 2.3 sec for δt = 0.7 sec, 0.410 at TI = 2.5 sec for δt = 0.9 sec.
d. Strength of magnetic field M0beffect on ΔΔM Fig. 5 shows the simulation results of ΔM depending on M0bfor 1.5, 3.0, and 7.0T for the gray matter in the brain. ΔM increased progressively with increasing TI, reached a broad maximum at TI ~ 1.7 sec, and declined with further increasing TI values. Perfusion signals were increased with increasing B0, as anticipated. The maximum values of ΔM were 0.593 at TI = 1.48 sec for 1.5T, 1.154 at TI = 1.52 sec for 3
T, and 2.557 T at TI = 1.60 sec for 7 T.
Discussion
For improved CBF quantification using ASL MRI, several parameters must be optimized to reduce systematic errors. In this paper, we attempted to optimize four parameters: the tissue-to-blood coefficient (λ), the longitudinal relaxation time of blood (T1b), the arterial transit time (δt), and the of magnetic field strength (M0b) by simulating the q-factor and the perfusion signals of PASL MRI to determine the optimum labeling time (TI). Based on the simulation
Fig. 5. Simulation results of perfusion signals (5) depended on the strength of the magnetic field (M0b).
1.5T (Solid line), 3T (Dotted line), and 7T (Dashed line) Other parameters were used for λgm= 1.05 ml/g, δt = 0.7 sec, and α= 1. T1b values were 1.4 sec, 1.6 sec, and 2.2 sec, for 1.5T, 3.0T, and 7.0T, respectively.
a b
Fig. 4. Simulation results of the q-factor (4a) and perfusion signals (4b) depended on the arterial transit delay (δt).
δt at 0.5 sec (Solid line, Black), at 0.7 sec (Dotted line, Red), and at 0.9 sec (Dashed line, Blue) Other parameters were used for λgm= 1.05 ml/g, T1b= 1.6 sec, and α= 1 at 3T.
results, we can optimize the TI values with the highest perfusion signals (23, 25).
a. Tissue-to-blood partition coefficient λλeffect on the q-factor and ΔΔM/M0b
The first simulation was the estimation of the q-factor and ΔM/M0bagainst TI depending on λ. Variations in λ occur in accordance with the water contents in brain tissues, including the white matter and gray matter.
The q-factor was not dependent on the state of the brain tissues. However, the perfusion signals, ΔM/M0b, depended on brain tissues. Perfusion signals were at a maximum at TI = 1.53 sec for the gray matter.
Perfusion signals in the gray matter were 1.14 times greater than that in white matter, due primarily to λ. The error for white matter may be greater than that for gray matter (26).
b. Blood longitudinal relaxation time T1beffect on q- factor and ΔΔM/M0b
The second simulation was the estimation of the q- factor and ΔM/M0b against TI depending on T1b. The q-factor did not depend greatly on T1b. However, perfusion signals, ΔM/M0b, were dependent on T1b. Perfusion signals were at a maximum at TI = 1.64 sec for T1b= 2.2 sec. The early part of the signal curve was weakly sensitive to T1b. T1b increases as hematocrit increases (27-29). Perfusion signals in the T1b= 2.2 sec (7T) were 1.37 times greater than in T1b = 1.4 sec (1.5T). Perfusion signals at 7T are increased by the increase in T1b. However, a loss in perfusion signals can occur as the result of a reduction in T2 and tagging efficiency loss.
c. Arterial transit delay δδt effect on the q-factor and Δ
ΔM/M0b
The third simulation was the estimation of the q-factor and ΔM/M0b against TI depending on δt. The q-factor values were reduced with increasing TI for any δt.
Because the signals rose rapidly after the delay, measurements at only one delay could potentially be strongly sensitive to variations in δt across the imaged plane. As a result, at any single time delay, the perfusion signal could evidence large errors. The quantification of CBF can be depended greatly upon the value of the transit delay.
d. Strength of magnetic field M0beffect on q-factor and ΔΔM
The last simulation was the estimation of ΔM against TI for three magnetic field strengths. The three q-factor curves had identical values because relaxed magnetization cannot affect the q-factor. The signal increase at higher field strengths was due primarily to the elongated T1. The maximum perfusion signal increased by approximately 51% at 3.0T compared to 1.5T. The perfusion signal at 7.0T would be approximately 431% greater than that seen at 1.5T. The signal is dependent on magnetic field strength and is greater at higher field strengths, due to the longer T1.
In the case of ΔM for magnetic field strength as shown in the above result, it is possible to obtain high perfusion signals at high field strengths as the impact on TI. Additionally, however, because the amount of spin polarization increases with increases in M0b. Therefore, when multiplied by ΔM and M0b, the overall impact is significantly greater. Additionally, pseudo-continuous ASL (pCASL) and velocity-selective ASL (VSASL) are other types of PASL. We can also optimize those methods based on the simulation in this work
Conclusion
In this paper, we reported the optimized TI values for several conditions to obtain the highest perfusion signal for PASL MRI. Both the q-factor and perfusion signals depended strongly on the longitudinal relaxation time of blood and the arterial transit delay. The tissue-to- blood coefficient affected the perfusion signals, but not the q-factor. Based on our results, it is important to select the optimized TI value by estimating the values of the longitudinal relaxation time of blood and the arterial transit delay.
Acknowledgements
The authors declare that there were no conflicts of interest. This study was supported by a grant of the Korean Health Technology R & D Project, Ministry for Health, Welfare & Family Affairs, Republic of Korea (A092125).
References
1.Detre JA, Wang J, Wang Z, Rao H. Arterial spin-labeled perfusion MRI in basic and clinical neuroscience. Curr Opin Neurol 2009;22:348-355
2.Luypaert R, Boujraf S, Sourbron S, Osteaux M. Diffusion and perfusion MRI: basic physics. Eur J Radiol 2001;38:19-27 3.Jahng GH, Kim HS, Kim SM, Ryu CW. Principles and
technical aspects of perfusion magnetic resonance imaging. J Korean Soc Magn Reson Med 2011;91-101
4.Le Bihan D, Breton E, Lallemand D, Grenier P, Cabanis E, Laval-Jeantet M. MR imaging of intravoxel incoherent motions: application to diffusion and perfusion in neurologic disorders. Radiology 1986;161:401-407
5.Detre JA, Leigh JS, Williams DS, Koretsky AP. Perfusion imaging. Magn Reson Med 1992;23:37-45
6.Golay X, Hendrikse J, Lim TC. Perfusion imaging using arterial spin labeling. Top Magn Reson Imaging 2004;15:10-27 7.Wong EC, Buxton RB, Frank LR. Implementation of quantitative perfusion imaging techniques for functional brain mapping using pulsed arterial spin labeling. NMR Biomed 1997;10:237-249
8.Williams DS, Detre JA, Leigh JS, Koretsky AP. Magnetic resonance imaging of perfusion using spin inversion of arterial water. Proc Natl Acad Sci U S A 1992;89:212-216 9.Edelman RR, Siewert B, Darby DG, Thangaraj V, Nobre AC,
Mesulam MM, Warach S. Qualitative mapping of cerebral blood flow and functional localization with echo-planar MR imaging and signal targeting with alternating radio frequency.
Radiology 1994;192:513-520
10.Edelman RR, Chen Q. EPISTAR MRI: multislice mapping of cerebral blood flow. Magn Reson Med 1998;40:800-805 11.Kwong KK, Chesler DA, Weisskoff RM, Donahue KM, Davis
TL, Ostergaard L, Campbell TA, Rosen BR. MR perfusion studies with T1-weighted echo planar imaging. Magn Reson Med 1995;34:878-887
12.Kim SG. Quantification of relative cerebral blood flow change by flow-sensitive alternating inversion recovery (FAIR) technique: application to functional mapping. Magn Reson Med 1995;34:293-301
13.Jahng GH, Zhu XP, Matson GB, Weiner MW, Schuff N.
Improved perfusion-weighted MRI by a novel double inversion with proximal labeling of both tagged and control acquisitions. Magn Reson Med 2003;49:307-314
14.Jahng GH, Weiner MW, Schuff N. Improved arterial spin labeling method: applications for measurements of cerebral blood flow in human brain at high magnetic field MRI. Med Phys 2007;34:4519-4525
15.Jahng GH. Practical considerations of arterial spin labeling MRI for measuring the multi-slice perfusion in the human brain. Korean Society of Medical Physics 2007;18:35-41 16.Alsop DC, Detre JA. Reduced transit-time sensitivity in
noninvasive magnetic resonance imaging of human cerebral blood flow. J Cereb Blood Flow Metab 1996;16:1236-1249 17.Wong EC, Buxton RB, Frank LR. A theoretical and
experimental comparison of continuous and pulsed arterial spin labeling techniques for quantitative perfusion imaging.
Magn Reson Med 1998;40:348-355
18.Buxton RB, Frank LR, Wong EC, Siewert B, Warach S, Edelman RR. A general kinetic model for quantitative perfusion imaging with arterial spin labeling. Magn Reson Med 1998;40:383-396
19.Herscovitch P, Raichle ME. What is the correct value for the brain--blood partition coefficient for water? J Cereb Blood Flow Metab 1985;5:65-69
20.Weaver BM, Staddon GE, Mapleson WW. Tissue/blood and tissue/water partition coefficients for propofol in sheep. Br J Anaesth 2001;86:693-703
21.Barth M, Moser E. Proton NMR relaxation times of human blood samples at 1.5 T and implications for functional MRI.
Cell Mol Biol (Noisy-le-grand) 1997;43:783-791
22.Varela M, Hajnal JV, Petersen ET, Golay X, Merchant N, Larkman DJ. A method for rapid in vivo measurement of blood T1. NMR Biomed 2011;24:80-88
23.Stanisz GJ, Odrobina EE, Pun J, Escaravage M, Graham SJ, Bronskill MJ, Henkelman RM. T1, T2 relaxation and magnetization transfer in tissue at 3T. Magn Reson Med 2005;
54:507-512
24.Dobre MC, Ugurbil K, Marjanska M. Determination of blood longitudinal relaxation time (T1) at high magnetic field strengths. Magn Reson Imaging 2007;25:733-735
25.Roberts DA, Rizi R, Lenkinski RE, Leigh JS, Jr. Magnetic resonance imaging of the brain: blood partition coefficient for water: application to spin-tagging measurement of perfusion. J Magn Reson Imaging 1996;6:363-366
26.Calamante F, Williams SR, van Bruggen N, Kwong KK, Turner R. A model for quantification of perfusion in pulsed labelling techniques. NMR Biomed 1996;9:79-83
27.Lu H, Clingman C, Golay X, van Zijl PC. Determining the longitudinal relaxation time (T1) of blood at 3.0 Tesla. Magn Reson Med 2004;52:679-682
28.Silvennoinen MJ, Kettunen MI, Kauppinen RA. Effects of hematocrit and oxygen saturation level on blood spin-lattice relaxation. Magn Reson Med 2003;49:568-571
29.Zhernovoi AI, Sharshina LM. Effects of hematocrit on blood proton relaxation time. Med Tekh 1997;33-34
통신저자 : 장건호, (134-727) 서울시 강동구 상일동 149, 경희대학교 의과대학 강동경희대학교병원 영상의학과 Tel. (02) 440-6187 Fax. (02) 440-6932 E-mail: [email protected]
동맥 스핀 라벨링 자기공명영상의 펄스 관류 신호의 시뮬레이션
1경희대학교 의과대학 강동경희대학교병원 영상의학과
2고려대학교 전자∙정보공학부
김혁기1, 2∙장건호1∙오창현2
목적: PASL (Pulsed ASL) 자화 신호에 영향을 주는 주요 4개의 인자들에 대한 평가를 컴퓨터 시뮬레이션으로 알아 보고 높은 PASL 자화 신호를 얻기 위하여, 최적화된 인자들의 값을 알아본다.
대상 및 방법: PASL 자화 신호를 평가하기 위해서 Bloch 방정식을 바탕으로 PASL 자화 신호에 영향을 주는 주요 4 개의 요소; tissue-to-blood coefficient (λ), blood longitudinal relaxation time (T1b), arterial transit delay (δt), strength of magnetic field(M0b) 에 대해서 Wolfram 사의 Mathematica 7.0을 이용하여 비교∙
분석하였다.
결과: 첫 번째, λ의 경우, 3T에서 gray matter가 inversion 시간이 1.53초일 때, 값이 0.390로 가장 컸다. 두 번 째로 δt 시간의 경우, 3T에서 inversion 시간이 2.1초에서 0.526로 가장 큰 값을 가졌다. 마지막으로 M0b는 3T에 서 inversion 시간이 1.52 초에서 1.15 로 가장 큰 값을 보였다.
결론: 시뮬레이션을 통하여 최적화된 inversion 시간으로 높은 PASL 신호를 가진 관류 영상을 얻을 수 있다.
대한자기공명의과학회지 15:191-199(2011)