D I A B E T E S & M E T A B O L I S M J O U R N A L
This is an Open Access article distributed under the terms of the Creative Commons Attribution Non-Commercial License (http://creativecommons.org/licenses/by-nc/4.0/) which permits unrestricted non-commercial use, distribution, and reproduction in any medium, provided the original work is properly cited.
Effects of Omega-3 Supplementation on
Adipocytokines in Prediabetes and Type 2 Diabetes Mellitus: Systematic Review and Meta-Analysis of Randomized Controlled Trials
Tarik Becic, Christian Studenik
Department of Pharmacology and Toxicology, Faculty of Life Sciences, University of Vienna, Vienna, Austria
Background: The objective of this systematic review and meta-analysis was to determine the effects of omega-3 supplementation on adipocytokine levels in adult prediabetic and diabetic individuals.
Methods: We searched PubMed, Medline, EMBASE, Scopus, Web of Science, Google Scholar, Cochrane Trial Register, World Health Organization Clinical Trial Registry Platform, and Clinicaltrial.gov Registry from inception to August 1, 2017 for ran- domized controlled trials. Pooled effects of interventions were assessed as mean difference using random effects model. We con- ducted a sensitivity, publication bias and subgroup analysis.
Results: Fourteen studies individuals (n=685) were included in the meta-analysis. Omega-3 supplementation increased levels of adiponectin (0.48 µg/mL; 95% confidence interval [CI], 0.27 to 0.68; P<0.00001, n=10 trials), but effects disappeared after sensi- tivity analysis. Tumor necrosis factor α (TNF-α) levels were reduced (–1.71; 95% CI, –3.38 to –0.14; P=0.03, n=8 trials). Treat- ment duration shorter than 12 weeks was associated with greater reduction than longer treatment duration. Levels of other adipo- cytokines were not significantly affected. Publication bias could generally not be excluded.
Conclusion: Eicosapentaenoic acid and docosahexaenoic acid supplementation may increase adiponectin and reduce TNF-α levels in this population group. However, due to overall study heterogeneity and potential publication bias, a cautious interpreta- tion is needed.
Keywords: Adipokines; Diabetes mellitus; Fatty acids, omega-3
Corresponding author: Tarik Becic https://orcid.org/0000-0003-4748-4711 Department of Pharmacology and Toxicology, Faculty of Life Sciences, University of Vienna, Althanstrasse 14, 1090 Vienna, Austria
E-mail: [email protected]
INTRODUCTION
Global rates of diabetes mellitus have reached epidemic pro- portions and are associated with an ever-growing health and socioeconomic burden. The World Health Organization (WHO) estimates that the number of diabetic individuals rose from 108 million in 1980 to 422 million in 2014, whereas low- and middle-income countries have experienced a particularly high increase in diabetes prevalence [1]. With this enormous
increase in global rates of diabetes also rises the economic cost, e.g., US data show that the total economic cost of diagnosed cases of diabetes amounted to USD 174 billion in 2007 and rose to 245 billion in 2012 [2]. A large part of the growing dia- betes rates can be explained by the enormous increase in the global burden of obesity [3]. According to data from WHO, more than 1.9 billion adults were overweight in 2014; of these 600 million were obese [4]. Diabetes is associated with a signif- icantly increased risk for all-cause mortality [5]. From the https://doi.org/10.4093/dmj.2018.42.2.101
pISSN 2233-6079 · eISSN 2233-6087
pathological perspective, there are two main types of diabetes:
type 1 diabetes mellitus (T1DM), which is characterized by pancreatic β-cell secretion deficiency, and type 2 diabetes mel- litus (T2DM), which is preceded by prediabetes in most indi- viduals [6], and is caused by a complex interplay between insu- lin resistance and β-cell dysfunction [7].
Increased body adiposity leads to a greater risk of developing T2DM even with at normal body mass index (BMI) [8]. Dys- function at the cellular level within the adipose tissue has been linked to insulin resistance and T2DM [9]. It is now well-es- tablished that adipose tissue is a metabolically highly active or- gan, secreting a plethora of molecules, with more than 600 identified so far [10]. These biologically active molecules, col- lectively known as adipocytokines, have been suggested to play a significant role in insulin resistance [11], β-cell dysfunction [12], as well as the occurrence of diabetes [13] and associated comorbidities [14,15].
Omega-3 fatty acids, a group of polyunsaturated fatty acids, have gained increasing popularity among general population and clinicians for their suggested positive modulatory effects on a variety of physiological function. Eicosapentaenoic acid (EPA) and docosahexaenoic acid (DHA) represent the two major types of omega-3 fatty acids. EPA and DHA are mainly gained from seafood consumption, such as from fatty fish.
These fatty acids are essential, as they cannot be produced by the human body, but have to be obtained by consuming ma- rine food, such as fatty fish and fish oil. Supplementing ome- ga-3 fatty acids was estimated to costs of 34.7 billion USD in 2016 [16]. These supplements have been used in managing a variety of clinical conditions and are believed to have a pletho- ra of health benefits [17].
Regarding the effects of omega-3 fatty acids on the risk of developing diabetes, studies have shown mixed results [18,19].
Positive effects have been reported in relation to diabetic com- plications [20]. Omega-3 fatty acids have also been associated with favourable outcomes on adiponectin and leptin [21] and a range of inflammatory cytokines [22].
Given their ever-increasing popularity and the emerging ev- idence suggesting positive modulatory effects on signalling molecules, including adypocytokines, it is of high relevance to investigate the influence of omega-3 fatty acid supplementa- tion on adipocytokine plasma concentration in prediabetic and diabetic individuals.
METHODS
Literature search
PubMed, Medline, EMBASE, Scopus, Web of Science, Google Scholar, Cochrane Trial Register, WHO Clinical Trial Registry Platform, and Clinicaltrial.gov Registry were used to systemat- ically search for randomized controlled trials. We did not use any language restriction in the search. The literature was searched from inception to August 1, 2017. Key words includ- ed, among others: fatty acids, omega-3, fish oil, EPA, DHA, ad- ipokines, adipocytokines, leptin, adiponectin, and clinical trial.
In addition, related articles in electronic databases were also searched. Retrieved articles, systematic reviews and meta- analyses were searched manually in order to identify any over- looked additional potentially relevant trials.
Study selection
We used the following inclusion criteria: (1) intervention in- volving supplementation with EPA, DHA, both EPA and DHA, and fish oil; (2) randomized controlled trials with paral- lel or cross-over design; (3) involving adult (≥18 years) human subjects diagnosed with any of the following clinical condi- tions: insulin resistance, impaired glucose tolerance, impaired fasting glucose, or T2DM; (4) a minimum of 4 weeks interven- tion period; (5) encompassed the evaluation the outcome of interest to this meta-analysis; and (6) reported post-interven- tion mean values or change from baseline values with standard deviation (SD).
We applied the following exclusion criteria: (1) non-inter- ventional studies, (2) uncontrolled studies, (3) lack of sufficient information on baseline or follow-up plasma concentration values of the selected adipocytokines, and (4) reviews, confer- ence abstracts, commentaries, case reports, or duplicate publi- cation from the same study.
Risk of bias assessment
We used Cochrane Collaboration’s tool for assessing the risk of bias in randomized trials in order to assess the risk of bias of included studies (low, unclear, high) with respect to following study characteristics: random sequence generation (selection bias), allocation concealment (selection bias), blinding of par- ticipants and personnel (performance bias), blinding of out- come assessment (detection bias), incomplete outcome data (attrition bias), selective reporting (reporting bias), and others [23].
Data extraction and statistical analysis
From every study included, the two authors independently ex- tracted the following information into a data spread sheet:
family name of the first author of the study; publication year;
characteristics of trial participants (number, age and gender);
duration of the intervention; definition of the intervention and respective control; and assessed outcomes.
We extracted values of group means and corresponding SD.
Where medians or interquartile ranges were reported instead of means, we used formulas proposed by Hozo et al. [24] to calculate the means and SD values. Where standard error of the mean (SEM) was only reported, SD was estimated using the following formula: SD=SEM×square root (n), where n is the number of subjects. The primary end point was change in circulating levels of adipocytokines, which were reported as changes between the values of arithmetic means at the end of the study-baseline [25]. SD of mean differences (MDs) were calculated as SD=square root [(SDbaseline)2+(SDend of treatment)2– (2r×SDbaseline×SDend of treatment)] for each group, assuming that r=0.5 [26].
We used the software Review Manager 5.3 as provided by the Cochrane Collaboration [27]. We applied the inverse-vari- ance, random effects model of DerSimonian and Laird [28] to calculate the pooled estimates of the weighted MDs between the intervention and control groups, because this model incor- porates between-study variability and provides a more conser- vative estimate of the average effect size.
The standard chi-square test was used as a statistical measure of heterogeneity between the different studies. The I2 value was applied to determine the magnitude of inconsistency [29], cal- culated as I2=[(Q−df)]/Q×100%, Q being the χ2 value and df the corresponding degree of freedom. An I2 value of greater than 50.0 % was defined as a cut-off to determine considerable heterogeneity between the included studies.
Sensitivity analysis through the leave-one-out method was employed to explore whether the dependency of the results on individual studies when these reported substantially different effect-sizes than the other studies.
We used the funnel-plot method to test for publication bias.
In this method, the difference in mean changes were plotted against their standard errors to measure the precision of the studies. Where there was any disagreement between the au- thors, the data were revisited and agreed on by discussion by the authors.
RESULTS
Literature search and study characteristics
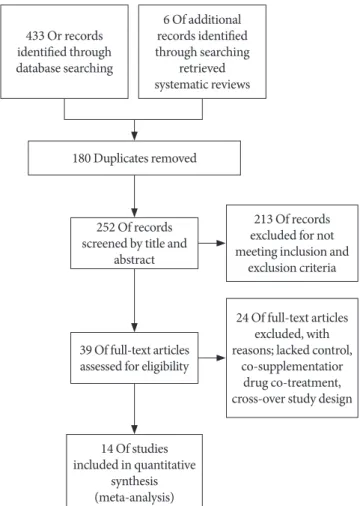
After applying all the selection criteria, 15 studies were includ- ed in the systematic review [30-44]. These studies reported the following outcomes: plasminogen-activator inhibitor 1 (PAI- 1), adiponectin, leptin, resistin, tumor necrosis factor α (TNF-α), and interleukin 6 (IL-6). One study [42] had a cross- over design, and could not be included in the quantitative syn- thesis (meta-analysis) in Review Manager; hence, 14 studies with parallel design were included in the meta-analysis [30- 41,43,44]. Fig. 1 shows a detailed overview of the search strate- gy. Fig. 2A represents the overall risk of bias summary accord- ing to the defined characteristics, and Fig. 2B provides an overview across all individual studies included in the system- atic review.
The studies included in the meta-analysis included a total of 29 treatment arms, comprising a total of 685 trial participants
Fig. 1. Flow diagram.
433 Or records identified through database searching
6 Of additional records identified through searching
retrieved systematic reviews
180 Duplicates removed
252 Of records screened by title and
abstract
39 Of full-text articles assessed for eligibility
14 Of studies included in quantitative
synthesis (meta-analysis)
213 Of records excluded for not meeting inclusion and
exclusion criteria
24 Of full-text articles excluded, with reasons; lacked control,
co-supplementatior drug co-treatment, cross-over study design
(Table 1). Most studies involved subjects with T2DM; Krebs et al. [33], Spencer et al. [41], and Wong et al. [44] enrolled pa- tients with prediabetes. One study [33] was conducted only with female subjects, otherwise both sexes were represented.
The trial duration ranged from 6 to 24 weeks. Interventions in most studies consisted of omega-3 supplementation alone, in two studies [33,44] intended weight loss was a part of the in- tervention. Most studies used both EPA and DHA in the inter-
vention, one study [30] used only EPA, and in one study EPA and DHA [38] were two different treatment arms, so that effect sizes were pooled separately.
Influence of omega-3 supplementation on plasma concentrations of adipocytokines
Two studies reported PAI-1 levels. Kabir et al. [32] used IU/mL as unit, and conversion was done to ng/mL [45]. Omega-3 Fig. 2. Risk of bias assessment tool. (A) Summary of risk of bias of across the trials included in the systematic review. In- formation for every study characteristic was pooled from every trial (green: low risk of bias; yellow: unclear risk of bias; red:
high risk of bias), combined and overall results expressed in percentages. (B) Overview of risk of bias across individual tri- als according to study characteristics. Each bias domain was evaluated carefully from every trial and decided whether the information provided reflected a low risk of bias (green), high risk of bias (red), or if insufficient information was provided and the risk of bias was therefore unclear (yellow).
Random sequence generation (selection bias) Allocation concealment (selection bias) Blinding of participants and personnel (performance bias) Blinding of outcome assessment (detection bias) Incomplete outcome data (attrition bias) Selective reporting (reporting bias) Other bias
Low risk of bias Unclear risk of bias High risk of bias
0 25 50 75 100 A
Random sequence generation (selection bias) Allocation concealment (selection bias) Blinding of participants and personnel (performance bias) Blinding of outcome assessment (detection bias) Incomplete outcome data (attrition bias) Selective reporting (reporting bias) Other bias
Hashemi, 2014 Jacobo-Cejudo, 2017 Kabir, 2007 Krebs, 2006 Lee, 2014 Mazaherioun, 2017 Mocking, 2012 Malekshahi Moghadam, 2012 Mori, 2003 Ogawa, 2013 Poreba, 2017 Spencer, 2013 Stirban, 2014 Veleba, 2015
Wong, 2013 B
(%)
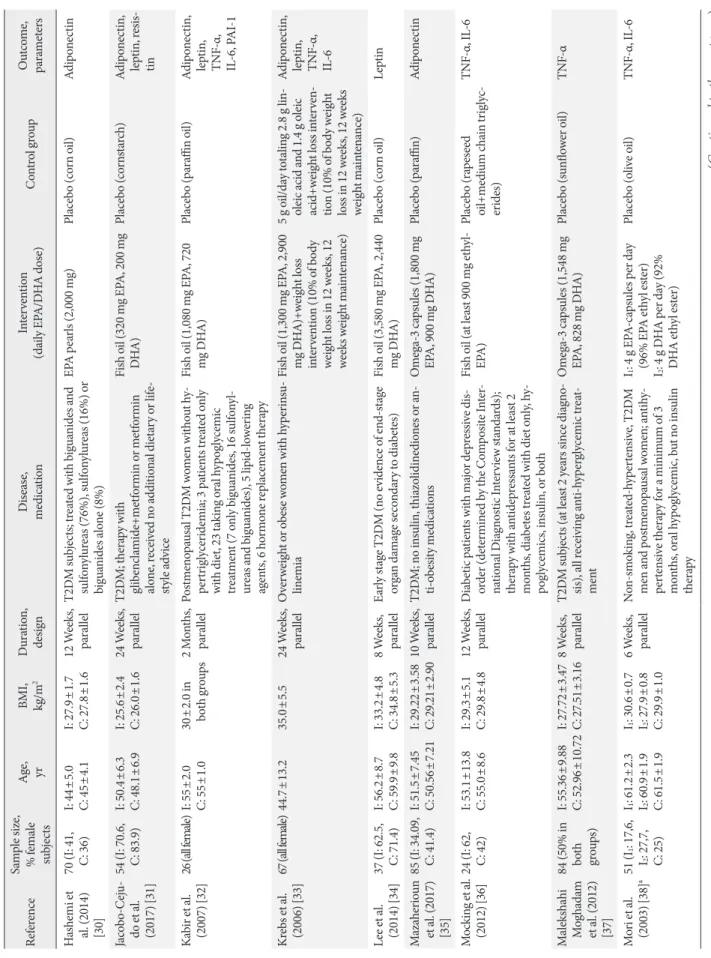
Table 1. General characteristics of randomized controlled trials included in the systematic review ReferenceSample size, % female subjectsAge, yr BMI, kg/m
2Duration, designDisease, medicationIntervention (daily EPA/DHA dose)Control groupOutcome, parameters Hashemi et
al. (2014) [30]
70 (I: 41, C: 36)I: 44±5.0 C: 45±4.1I: 27.9±1.7 C: 27.8±1.612 Weeks, parallelT2DM subjects; treated with biguanides and sulfonylureas (76%), sulfonylureas (16%) or biguanides alone (8%)
EPA pearls (2,000 mg)Placebo (corn oil)Adiponectin Jacobo-Ceju- do et al. (2017) [31]
54 (I: 70.6, C: 83.9)
I: 50.4±6.3 C: 48.1±6.9I: 25.6±2.4 C: 26.0±1.624 Weeks, parallelT2DM; therapy with glibenclamide+metformin or metformin alone, received no additional dietary or life- style advice
Fish oil (320 mg EPA, 200 mg DHA)Placebo (cornstarch)Adiponectin, leptin, resis- tin Kabir et al. (2007) [32]26 (all female)I: 55±2.0 C: 55±1.030±2.0 in both groups2 Months, parallel Postmenopausal T2DM women without hy- pertriglyceridemia; 3 patients treated only with diet, 23 taking oral hypoglycemic treatment (7 only biguanides, 16 sulfonyl- ureas and biguanides), 5 lipid-lowering agents, 6 hormone replacement therapy
Fish oil (1,080 mg EPA, 720 mg DHA)Placebo (paraffin oil)Adiponectin, leptin, TNF-α, IL-6, PAI-1 Krebs et al. (2006) [33]67 (all female)44.7±13.235.0±5.524 Weeks, parallel Overweight or obese women with hyperinsu- linemia Fish oil (1,300 mg EPA, 2,900 mg DHA)+weight loss intervention (10% of body weight loss in 12 weeks, 12 weeks weight maintenance)
5 g oil/day totaling 2.8 g lin- oleic acid and 1.4 g oleic acid+weight loss interven- tion (10% of body weight loss in 12 weeks, 12 weeks weight maintenance)
Adiponectin, leptin, TNF-α, IL-6 Lee et al. (2014) [34]
37 (I: 62.5, C: 71.4)
I: 56.2±8.7 C: 59.9±9.8I: 33.2±4.8 C: 34.8±5.38 Weeks, parallelEarly stage T2DM (no evidence of end-stage organ damage secondary to diabetes)Fish oil (3,580 mg EPA, 2,440 mg DHA)Placebo (corn oil) Leptin Mazaherioun et al. (2017) [35]
85 (I: 34.09, C: 41.4)
I: 51.5±7.45 C: 50.56±7.21I: 29.22±3.58 C: 29.21±2.9010 Weeks, parallelT2DM; no insulin, thiazolidinediones or an- ti-obesity medicationsOmega-3 capsules (1,800 mg EPA, 900 mg DHA)Placebo (paraffin)Adiponectin Mocking et al. (2012) [36]24 (I: 62, C: 42)I: 53.1±13.8 C: 55.0±8.6I: 29.3±5.1 C: 29.8±4.812 Weeks, parallelDiabetic patients with major depressive dis- order (determined by the Composite Inter- national Diagnostic Interview standards); therapy with antidepressants for at least 2 months, diabetes treated with diet only, hy- poglycemics, insulin, or both
Fish oil (at least 900 mg ethyl- EPA)Placebo (rapeseed oil+medium chain triglyc- erides)
TNF-α, IL-6 Malekshahi Moghadam et al. (2012) [37]
84 (50% in both groups)
I: 55.36±9.88 C: 52.96±10.72I: 27.72±3.47 C: 27.51±3.168 Weeks, parallelT2DM subjects (at least 2 years since diagno- sis), all receiving anti-hyperglycemic treat- ment
Omega-3 capsules (1,548 mg EPA, 828 mg DHA)Placebo (sunflower oil)TNF-α Mori et al. (2003) [38]a51 (I1: 17,6, I2: 27,7, C: 25)
I1: 61.2±2.3 I2: 60.9±1.9 C: 61.5±1.9
I1: 30.6±0.7 I2: 27.9±0.8 C: 29.9±1.0
6 Weeks, parallelNon-smoking, treated-hypertensive, T2DM men and postmenopausal women; antihy- pertensive therapy for a minimum of 3 months, oral hypoglycemic, but no insulin therapy
I1: 4 g EPA-capsules per day (96% EPA ethyl ester) I2: 4 g DHA per day (92% DHA ethyl ester)
Placebo (olive oil) TNF-α, IL-6 (Continued to the next page)
ReferenceSample size, % female subjectsAge, yr BMI, kg/m
2Duration, designDisease, medicationIntervention (daily EPA/DHA dose)Control groupOutcome, parameters Ogawa et al. (2013) [39]26 (I: 69, C: 82)I: 79.5±8.6 C: 81.2±7.6I: 19.9±4.0 C: 20.1±3.63 MllelBedridden elderly T2DM patientsLiquid diet rich in EPA (25 mg/100 kcal) and DHA (17 mg/100 kcal)b
Liquid diet lacking EPA and DHAAdiponectin, TNF-α, IL-6 Poreba et al. (2017) [40]
74 (I: 38,9, C: 31.6)
I: 64.4±6.7 C: 66.7±6.8
I: 30.9 (27.9– 34.7) C: 31.1 (28.1– 32.7)
c
3 Months, parallelT2DM patients with a history of coronary ar- tery disease or peripheral artery diseaseOmega-3 drink (1,000 mg EPA, 1,000 mg DHA)Drink without omega-3Adiponectin, leptin, TNF-α, IL-6 Spencer et al. (2013) [41]
33 (I: 68,4, C: 64,2)
I: 48.8±2.3 C: 53.3±2.2I: 33.4±2.3 C: 33.4±1.112 Weeks, parallelNon-diabetic subjects with either impaired fasting glucose, impaired glucose tolerance (23 subjects), or at least three signs of meta- bolic syndrome
Fish oil (1,860 mg EPA, 1,500 mg DHA)Placebo (corn oil)Adiponectin, leptin, TNF-α, I L-6, PAI-1, resistin Stirban et al. (2014) [42]34, No specifica- tion of sex 56.8±8.331.2±4.16 Weeks, cross- over
T2DM (duration 9.8± 6.6 years), no history of major cardiovascular events or a surgical or interventional history within the previ- ous 6 months; treated with low dose aspirin (n=20), ACE-inhibitors or AR blockers (n=24), calcium channel blockers (n=5), β-blockers (n=15), diuretics (n=13), and statins (n=13), all withdrawn before mea- surements; diabetes medication: diet (n=3), oral therapy (n=16), insulin (n=4), oral hypoglycemic plus insulin (n=10), and incretin mimetics (n=1)
Omega-3 capsules (920 mg EPA, 760 mg DHA)Placebo (olive oil) Adiponectin, leptin Veleba et al. (2015) [43]29, 34
I: 59.5 C: 62.0 I: 34.0 C: 30.9
24 Weeks, parallelT2DM (at least 3 months from diagnosis); metformin as monotherapy as a stable dose (0.5–3.0 g/day) for at least 1 month
Omega-3 concentrate (750 mg EPA, 2,000 mg DHA)Placebo (corn oil)Adiponectin, leptin Wong et al. (2013) [44]25, 4460±4.0I: 34±2.0 C: 33±1.016 Weeks, parallelMiddle-aged, centrally obese, normotensive, dyslipidemic (elevated triglycerides, low HDL), insulin resistant adults; 6 subjects receiving lipid-lowering therapy (4 atorvas- tatin, 2 rosuvastatin), 5 anti-hypertensive treatment (2 on ACE inhibitors, 2 on AR blockers, 1 on β1-blocker)
Fish oil (1,840 mg EPA-ethyl ester, 1,520 mg ethyl- ester)+weight loss interven- tion (12 weeks hypocaloric diet with energy deficit of at least 1,900 kJ/day, followed by 4 weeks of weight mainte- nance with energy intake in- creased by 460 kJ/day)
Weight loss alone (protocol as in intervention group)Adiponectin Values are presented as mean±standard deviation. BMI, body mass index; I, intervention group; C, control group; T2DM, type 2 diabetic mellitus; EPA, eicosapentaenoic acid; DHA, docosahexaenoic acid; TNF-α, tumor necrosis fac- tor α; IL-6, interleuk in 6; PAI-1, plasminogen-activator inhibitor 1; ACE, angiotensin-converting-enzyme; AR, angiotensin II receptor; HDL, high density lipoprotein. aEPA and DHA were used in two separate treatment arms, bThe patients consumed 1,015.4±231.1 kcal/day, cValues are presented as median (interquartile range).
Table 1. Continued
supplementation did not significantly affect PAI-1 levels (MD, –11.47 ng/mL; 95% confidence interval [CI], –23.52 to 0.57;
P=0.06, I2=11%) (Fig. 3).
Effect sizes for adiponectin were pooled from a total of 10 studies. Omega-3 supplementation significantly increased plasma adiponectin concentration (MD, 0.48 µg/mL; 95% CI,
−20 −10 0 10 20 Study or subgroup Mean SD Total Mean SD Total Weight IV, Random, 95% CI
Kabir, 2007 −12.6 15.75 12 3.08 18.84 14 68.1% −15.68 [−28.98, −2.38]
Spencer, 2013 −2.1 32.04 19 0.4 27.71 14 31.9% −2.50 [−22.95, 17.95]
Total (95% CI) 31 28 100.0% −11.47 [−23.52, 0.57]
Heterogeneity: Tau2=9.41; Chi2=1.12, df=1 (P=0.29); I2=11%
Test for overall effect: Z=1.87 (P=0.06)
IV, Random, 95% CI
Favours omega-3 Favours control
Experimental Control Mean difference Mean difference
Fig. 3. Influence of omega-3 fatty acids supplementation on plasminogen-activator inhibitor 1 levels (ng/mL). Forest plot shows pooled mean differences with 95% confidence intervals (CIs) for two randomized controlled trials. The green colored square rep- resents the point estimate of the effect of the intervention for each trial. The horizontal line joins the upper and lower limits of the 95% CI of the effects. The square area represents the relative weight of the trial in the meta-analysis. The black colored diamond at the bottom represents the pooled mean difference with 95% CI for all study groups. SD, standard deviation; IV, interval variable.
−20 −10 0 10 20
−20 −10 0 10 20 Study or subgroup Mean SD Total Mean SD Total Weight IV, Random, 95% CI
Study or subgroup Mean SD Total Mean SD Total Weight IV, Random, 95% CI Hashemi, 2014 2.3 3.92 34 0.3 4.17 36 1.1% 2.00 [0.10, 3.90]
Jacobo-Cejudo, 2017 0.09 0.07 29 0.02 0.012 25 22.3% 0.07 [0.04, 0.10]
Kabir, 2007 0.5 2.1 12 −0.4 2.82 14 1.1% 0.90 [−1.00, 2.80]
Krebs, 2006 2.33 5.79 35 −0.22 6.94 32 0.4% 2.55 [−0.53, 5.63]
Mazaherioun, 2017 0.49 2.97 44 −0.17 2.6 41 2.7% 0.66 [−0.52, 1.84]
Ogawa, 2013 1.8 9.78 13 0.5 11.23 13 0.1% 1.30 [−6.80, 9.40]
Poreba, 2017 −0.26 0.5 36 0.16 0.72 38 15.8% −0.42 [−0.70, −0.14]
Spencer, 2013 −0.02 0.31 19 −0.01 0.28 14 18.4% −0.01 [−0.21, 0.19]
Veleba, 2015 1.1 0.34 16 −1.9 0.42 13 15.7% 3.00 [2.72, 3.28]
Wong, 2013 0.013 0.02 13 0.03 0.01 12 22.4% −0.02 [−0.03, −0.00]
Total (95% CI) 251 238 100.0% 0.48 [0.27, 0.68]
Heterogeneity: Tau2=0.05; Chi2=485.62, df=9 (P<0.00001); P=98%
Test for overall effect: Z=4.55 (P<0.00001)
Hashemi, 2014 2.3 3.92 34 0.3 4.17 36 0.2% 2.00 [0.10, 3.90]
Jacobo-Cejudo, 2017 0.09 0.07 29 0.02 0.012 25 39.0% 0.07 [0.04, 0.10]
Kabir, 2007 0.5 2.1 12 −0.4 2.82 14 0.2% 0.90 [−1.00, 2.80]
Krebs, 2006 2.33 5.79 35 −0.22 6.94 32 0.1% 2.55 [−0.53, 5.63]
Mazaherioun, 2017 0.49 2.97 44 −0.17 2.6 41 0.5% 0.66 [−0.52, 1.84]
Ogawa, 2013 1.8 9.78 13 0.5 11.23 13 0.0% 1.30 [−6.80, 9.40]
Poreba, 2017 −0.26 0.5 36 0.16 0.72 38 7.5% −0.42 [−0.70, −0.14]
Spencer, 2013 −0.02 0.31 19 −0.01 0.28 14 12.4% −0.01 [−0.21, 0.19]
Veleba, 2015 1.1 0.34 16 −1.9 0.42 13 0.0% 3.00 [2.72, 3.28]
Wong, 2013 0.013 0.02 13 0.03 0.01 12 40.1% −0.02 [−0.03, −0.00]
Total (95% CI) 235 225 100.0% −0.00 [−0.09, 0.08]
Heterogeneity: Tau2=0.00; Chi2=53.01, df=8 (P<0.00001); I2=85%
Test for overall effect: Z=0.02 (P=0.98)
IV, Random, 95% CI
IV, Random, 95% CI Favours control
Favours control
Favours omega-3
Favours omega-3 Experimental
Experimental
Control
Control
Mean difference
Mean difference
Mean difference
Mean difference
Fig. 4. Influence of omega-3 fatty acids supplementation on adiponectin levels (µg/mL). (A) Forest plot shows pooled mean differ- ences with 95% confidence intervals (CIs) for 10 randomized controlled trials. The green colored square represents the point estimate of the effect of the intervention for each trial. The horizontal line joins the upper and lower limits of the 95% CI of the effects. The square area represents the relative weight of the trial in the meta-analysis. The black colored diamond at the bottom represents the pooled mean difference with 95% CI for all study groups. As opposed to graphs for all other outcome parameters, the labels of the X- axis are different, because an increase in adiponectin levels is seen as favorable. (B) Meta-analysis after eliminating Veleba et al. [43] as part of the leave-one-out sensitivity analysis (the trial was given a relative weight of 0.0%). SD, standard deviation; IV, interval variable.
A
B
0.27 to 0.68; P<0.00001, I2=98%) (Fig. 4A). For the sensitivity analysis, we eliminated Veleba et al. [43], because this study re- ported an effect which was significantly greater than that of other individual studies. No effects of omega-3 supplementa- tion on adiponectin concentration were observed (MD, 0.00 µg/mL; 95% CI, –0.09 to 0.08; P=0.98, I2=85%) (Fig. 4B) in
this sensitivity analysis.
With regards to effects on resistin, omega-3 supplementa- tion did not affect its levels in a statistically significant way (MD, –0.77 ng/mL; 95% CI, –2.44 to 0.97; P=0.4, I2=100%) (Fig. 5).
Supplementing omega-3 fatty acids did not significantly alter
−10 −5 0 5 10
Study or subgroup Mean SD Total Mean SD Total Weight IV, Random, 95% CI Jacobo-Cejudo, 2007 0.36 0.2 29 0.22 0.18 25 50.0% 0.14 [0.04, 0.24]
Spencer, 2013 −1.4 0.06 19 0.2 0.07 14 50.0% −1.60 [−1.65, −1.55]
Total (95% CI) 48 39 100.0% −0.73 [−2.44, 0.97]
Heterogeneity: Tau2=1.51; Chi2=941.77, df=1 (P<0.00001); I2=100%
Test for overall effect: Z=0.84 (P=0.40)
IV, Random, 95% CI
Favours [experimental] Favours [control]
Experimental Control Mean difference Mean difference
Fig. 5. Influence of omega-3 fatty acids supplementation on resisting levels (ng/mL). Forest plot shows pooled mean differences with 95% confidence intervals (CIs) for two randomized controlled trials. The green colored square represents the point estimate of the effect of the intervention for each trial. The horizontal line joins the upper and lower limits of the 95% CI of the effects. The square area represents the relative weight of the trial in the meta-analysis. The black colored diamond at the bottom represents the pooled mean difference with 95% CI for all study groups. SD, standard deviation; IV, interval variable.
−20 −10 0 10 20
−20 −10 0 10 20 Study or subgroup Mean SD Total Mean SD Total Weight IV, Random, 95% CI
Study or subgroup Mean SD Total Mean SD Total Weight IV, Random, 95% CI Jacobo-Cejudo, 2017 −0.18 0.14 29 −0.15 0.12 25 99.3% −0.03 [−0.10, 0.04]
Kabir, 2007 0.2 13.52 12 1.7 16.66 14 0.0% −1.50 [−13.10, 10.10]
Krebs, 2006 −9.9 13.21 35 −12.3 14.87 32 0.0% 2.40 [−4.36, 9.16]
Lee, 2014 −4.5 9.68 16 −9.3 6.8 21 0.0% 4.80 [−0.76, 10.36]
Poreba, 2017 0.19 1.71 36 0.48 2.04 38 0.7% −0.29 [−1.15, 0.57]
Spencer, 2013 −4.3 43.85 19 1.7 19.38 14 0.0% −6.00 [−28.18, 16.18]
Veleba, 2015 −1.4 3.9 16 1.2 5.86 13 0.0% −2.60 [−6.31, 1.11]
Total (95% CI) 163 157 100.0% −0.03 [−0.10, 0.04]
Heterogeneity: Tau2=0.00; Chi2=5.92, df=6 (P=0.43); I2=0%
Test for overall effect: Z=0.90 (P=0.37)
Jacobo-Cejudo, 2017 −0.18 0.14 29 −0.15 0.12 25 79.2% −0.03 [−0.10, 0.04]
Kabir, 2007 0.2 13.52 12 1.7 16.66 14 0.1% −1.50 [−13.10, 10.10]
Krebs, 2006 −9.9 13.21 35 −12.3 14.87 32 0.4% 2.40 [−4.36, 9.16]
Lee, 2014 −4.5 9.68 16 −9.3 6.8 21 0.6% 4.80 [−0.76, 10.36]
Poreba, 2017 0.19 1.71 36 0.48 2.04 38 18.5% −0.29 [−1.15, 0.57]
Spencer, 2013 −4.3 43.85 19 1.7 19.38 14 0.0% −6.00 [−28.18, 16.18]
Veleba, 2015 −1.4 3.9 16 1.2 5.86 13 1.2% −2.60 [−6.31, 1.11]
Total (95% CI) 144 143 100.0% −0.08 [−0.49, 0.34]
Heterogeneity: Tau2=0.06; Chi2=5.64, df=5 (P=0.34); I2=11%
Test for overall effect: Z=0.35 (P=0.72)
IV, Random, 95% CI
IV, Random, 95% CI Favours omega-3
Favours omega-3
Favours control
Favours control Experimental
Experimental
Control
Control
Mean difference
Mean difference
Mean difference
Mean difference
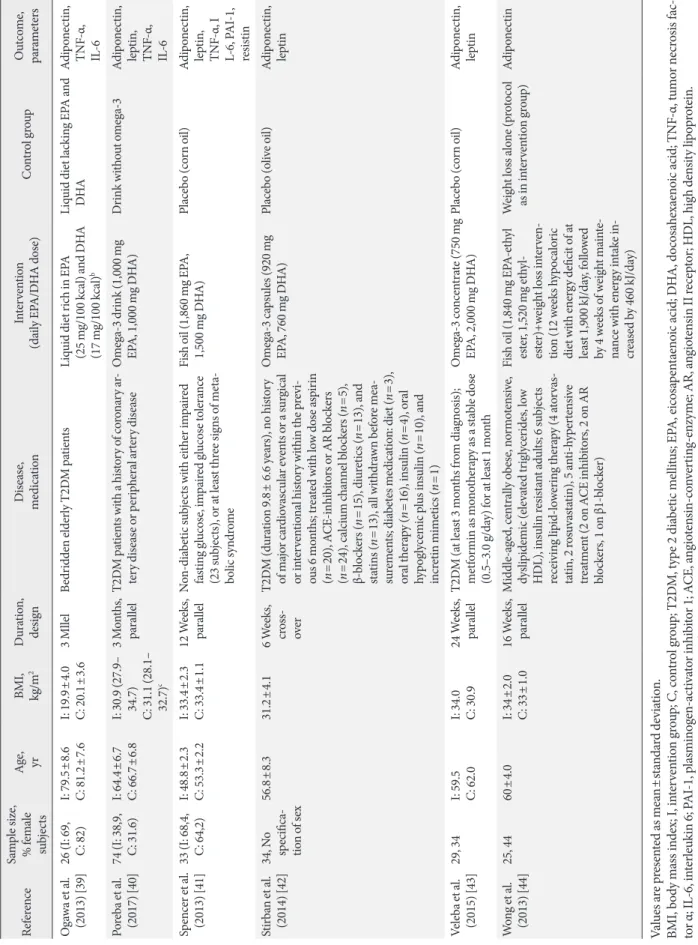
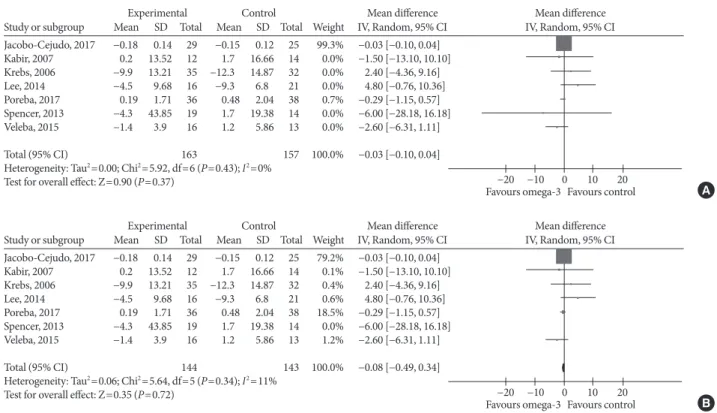
Fig. 6. Influence of omega-3 fatty acids supplementation on leptin levels (ng/mL). (A) Forest plot shows pooled mean differences with 95% confidence intervals (CIs) for seven randomized controlled trials. The green colored square represents the point estimate of the effect of the intervention for each trial. The horizontal line joins the upper and lower limits of the 95% CI of the effects. The square area represents the relative weight of the trial in the meta-analysis. Notice the absence of the black colored diamond at the bottom as in other graphs because of the magnitude of the pooled mean difference with 95% CI for all study groups. (B) Meta-analysis after eliminating Spencer et al. [41] as part of the leave-one-out sensitivity analysis (the trial was given a relative weight of 0.0%). SD, stan- dard deviation; IV, interval variable.
A
B
leptin levels (MD, –0.03 ng/mL; 95% CI, –0.10 to 0.04; P=0.37, I2=0%) (Fig. 6A). As the effect reported in Spencer et al. [41]
was considerably different compared with that of other indi- vidual studies, we eliminated it from the analysis, this did re- sult in a significant change in effect size (MD, –0.08 ng/mL;
95% CI, –0.49 to 0.34; P=0.72, I2=11%) (Fig. 6B).
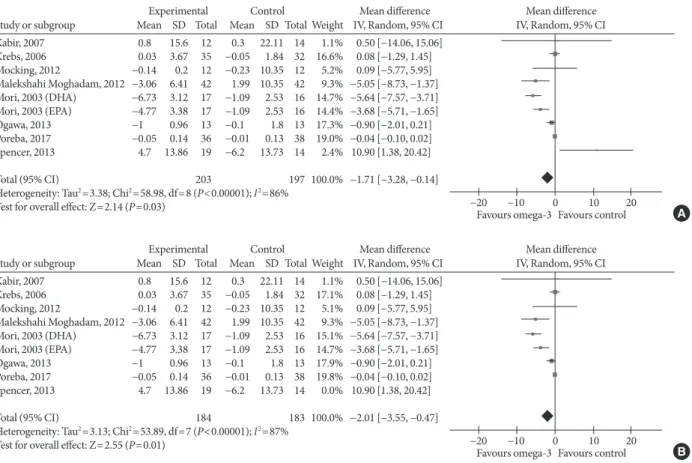
Omega-3 supplementation also exerted an effect on plasma concentrations of inflammatory cytokines IL-6 and TNF-α.
The effects on IL-6 did not reach statistical significance (MD, –0.10 pg/mL; 95% CI, –0.25 to 0.05; P=0.2, I2=21%) (Fig. 7), but TNF-α levels significantly reduced (MD, –1.71; 95% CI, –3.38 to –0.14; P=0.03, I2=86%) (Fig. 8A), this effect also re- mained after removing Spencer et al. [41] for the sensitivity analysis, as this was the only study which reported an increase in TNF-α levels in the primary analysis (MD, –2.01 pg/mL;
95% CI, –3.55 to –0.47; P=0.01, I2=87%) (Fig. 8B).
Subgroup-analysis
As adiponectin and TNF-α were the only two outcomes whose blood levels were significantly affected by omega-3 supple- mentation in the primary analysis and we found considerable study heterogeneity, we conducted a subgroup analysis by dose (low ≤2,000 mg, high >2,000 mg) and treatment duration (<12, ≥12 weeks) to investigate whether the effect of the inter- vention in these outcomes varied between the subgroups.
For adiponectin, omega-3 significantly increased its levels when supplemented in high dose (MD, 0.62 µg/mL; 95% CI, 0.40 to 0.85; P<0.00001, I2=99%); low-dose supplementation
did not lead to significant changes (MD, 0.48 µg/mL; 95% CI, –0.73 to 1.69; P=0.44, I2=67%; test for subgroup differences:
P=0.82, I2=0%) (Fig. 9A). As for treatment duration, we found significant effects in the subgroup ≥12 weeks (MD, 0.47 µg/mL;
95% CI, 0.26 to 0.68; P<0.00001, I2=99%), while shorter treat- ment duration did not produce statistically significant effects (MD, 0.73 µg/mL; 95% CI, –0.28 to 1.73; P=0.16, I2=0%; test for subgroup differences: P=0.62, I2=0%) (Fig. 9B).
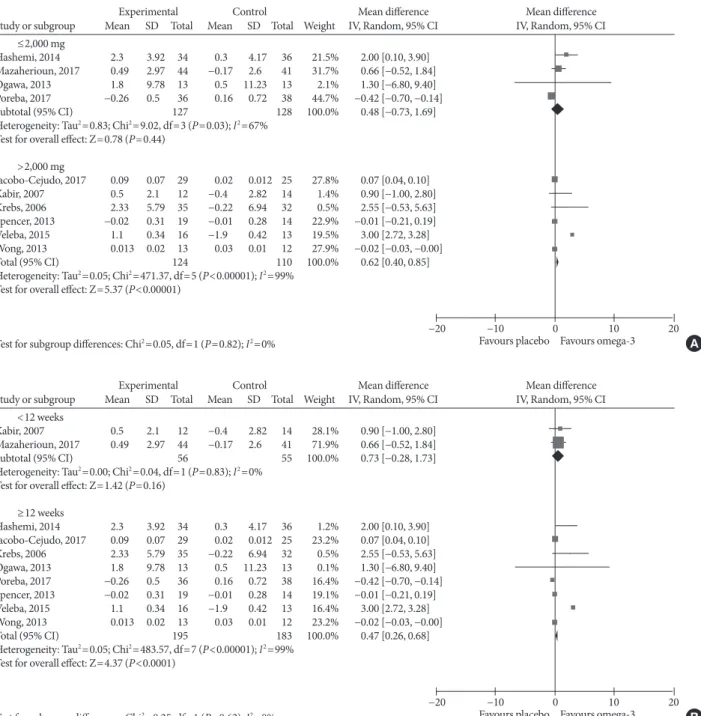
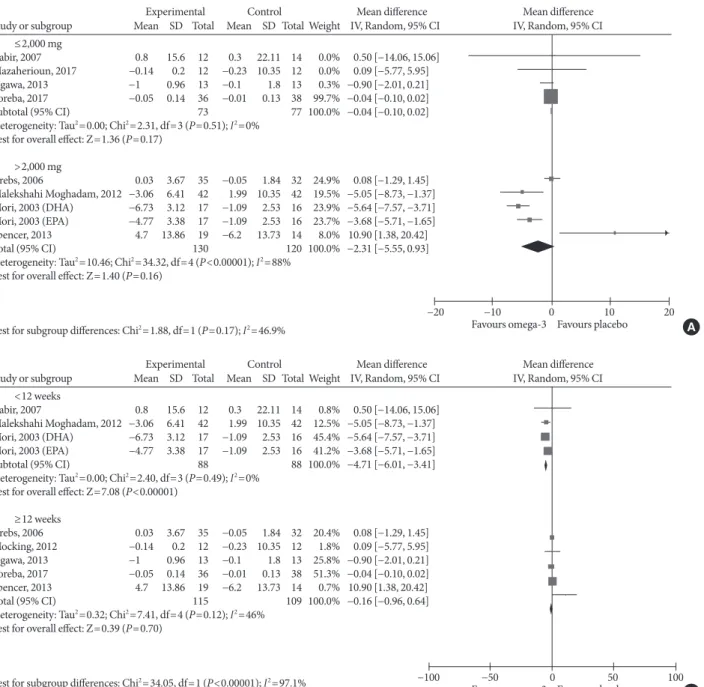
For TNF-α, omega-3 did not significantly change the levels neither in the low-dose (MD, –0.04 pg/mL; 95% CI, –0.10 to 0.02; P=0.17, I2=0%) nor in the high-dose group (MD, –2.31 pg/mL; 95% CI, –5.55 to 0.93; P=0.16, I2=88%; test for sub- group differences: P=0.17, I2=46.9%) (Fig. 10A). Supplement- ing omega-3 for less than 12 weeks significantly reduced TNF-α levels (MD, –4.71 pg/mL; 95% CI, –6.01 to –3.41;
P<0.00001, I2=0%); whilst no statistically significant effects were found with longer supplementation (MD, –0.16 pg/mL;
95% CI, –0.96 to 0.64; P=0.7, I2=46%; test for subgroup differ- ences: P<0.00001, I2=97.1%) (Fig. 10B).
Publication bias
Visual inspection of funnel plots for adiponectin, leptin, IL-6, and TNF-α (Fig. 11) revealed a moderate asymmetry in all of the outcomes, so that a publication bias cannot be excluded and we cannot ascertain that a non-publication of negative or inconclusive data did not influence our meta-analysis.
−20 −10 0 10 20
Study or subgroup Mean SD Total Mean SD Total Weight IV, Random, 95% CI Kabir, 2007 0.3 1.92 12 0.1 1.64 14 1.2% 0.20 [−1.18, 1.58]
Krebs, 2006 −0.67 4.18 35 −0.75 1.66 32 1.0% 0.08 [−1.42, 1.58]
Mocking, 2012 −0.02 2.55 12 0.4 1.73 12 0.7% −0.42 [−2.16, 1.32]
Mori, 2003 (DHA) −0.07 0.43 17 0.2 0.22 16 26.0% −0.27 [−0.50, −0.04]
Mori, 2003 (EPA) 0.03 0.18 17 0.2 0.22 16 43.2% −0.17 [−0.31, −0.03]
Ogawa, 2013 −0.9 25.43 13 −0.3 25.02 13 0.0% −0.60 [−19.99, 18.79]
Poreba, 2017 0.08 0.37 36 −0.08 0.57 38 27.9% 0.16 [−0.06, 0.38]
Spencer, 2013 1.6 8.41 19 1.5 17.21 14 0.0% 0.10 [−9.68, 9.88]
Total (95% CI) 161 155 100.0% −0.10 [−0.25, 0.05]
Heterogeneity: Tau2=0.01; Chi2=8.85, df=7 (P=0.26); I2=21%
Test for overall effect: Z=1.29 (P=0.20)
IV, Random, 95% CI
Favours omega-3 Favours control
Experimental Control Mean difference Mean difference
Fig. 7. Influence of omega-3 fatty acids supplementation on interleukin 6 levels (pg/mL). Forest plot shows pooled mean differences with 95% confidence intervals (CIs) for eight intervention effects pooled from seven randomized controlled trials (two separate ef- fects were pooled for docosahexaenoic acid [DHA] and eicosapentaenoic acid [EPA] treatment arms from Mori et al. [38]). The green colored square represents the point estimate of the effect of the intervention for each intervention. The horizontal line joins the upper and lower limits of the 95% CI of the effects. The square area represents the relative weight of the interventions in the meta-analysis.
SD, standard deviation; IV, interval variable.