D I A B E T E S & M E T A B O L I S M J O U R N A L
This is an Open Access article distributed under the terms of the Creative Commons Attribution Non-Commercial License (http://creativecommons.org/licenses/by-nc/4.0/) which permits unrestricted non-commercial use, distribution, and reproduction in any medium, provided the original work is properly cited.
Diabetes Camp as Continuing Education for Diabetes Self-Management in Middle-Aged and Elderly People with Type 2 Diabetes Mellitus
So Young Park1, Sun Young Kim2, Hye Mi Lee2, Kyu Yeon Hur1, Jae Hyeon Kim1, Moon-Kyu Lee1, Kang-Hee Sim2, Sang-Man Jin1
1Division of Endocrinology and Metabolism, Department of Medicine, 2Diabetes Education Unit, Diabetes Center, Samsung Medical Center, Sungkyunkwan University School of Medicine, Seoul, Korea
Background: Despite the established benefits of diabetes camps for the continuing education of children with type 1 diabetes mellitus, little is known about the long-term metabolic benefits of diabetes camps for middle-aged and elderly people with type 2 diabetes mellitus (T2DM), especially in terms of glycosylated hemoglobin (HbA1c) variability.
Methods: The 1-year mean and variability of HbA1c before and after the diabetes camp was compared between the participants of the diabetes camp (n=57; median age 65 years [range, 50 to 86 years]; median diabetes duration 14 years [range, 1 to 48 years]).
Additional case-control analysis compared the metabolic outcomes of the participants of the diabetes camp and their propensity score-matched controls who underwent conventional diabetes education (n=93).
Results: The levels of HbA1c during the first year after the diabetes camp were comparable to those of the matched controls (P=0.341). In an analysis of all participants of the diabetes camp, the 1-year mean±standard deviation (SD) of HbA1c decreased (P=0.010 and P=0.041) after the diabetes camp, whereas the adjusted SD and coefficient of variance (CV) of HbA1c did not de- crease. The adjusted SD and CV significantly decreased after the diabetes camp in participants whose 1-year mean HbA1c was
≥6.5% before the diabetes camp (n=40) and those with a duration of diabetes less than 15 years (n=32).
Conclusion: The 1-year mean and SD of HbA1c decreased after the diabetes camp, with significant reduction in the adjusted SD and CV in those with higher baseline HbA1c and a shorter duration of diabetes.
Keywords: Adult; Diabetes camp; Hemoglobin A, glycosylated, variability; Metabolic outcome; Psychosocial outcome
Corresponding authors: Sang-Man Jin http://orcid.org/0000-0001-5929-3627 Department of Medicine, Samsung Medical Center, Sungkyunkwan University School of Medicine, 81 Irwon-ro, Gangnam-gu, Seoul 06351, Korea
E-mail: [email protected]
Kang-Hee Sim http://orcid.org/0000-0002-0400-5154
Diabetes Education Unit, Diabetes Center, Samsung Medical Center, Sungkyunkwan University School of Medicine, 81 Irwon-ro, Gangnam-gu, Seoul 06351, Korea
INTRODUCTION
With the global increase in the proportion of the elderly popu- lation, clinical management catering to the elderly with diabe- tes has become increasingly important not only for pharmaco- logic management but also for diabetes self-management edu- cation (DSME). DSME is an established tool for improving clinical outcomes, such as for insulin use and self-care perfor- mance [1], metabolic outcome (glycemic control or lipid con-
trol) [2-4], rate of chronic complications [1], and degree of de- pressive symptoms [5].
While DSME is necessary and effective, it does not last long.
Initial beneficial effects tend to diminish after approximately 6 months [2]. Therefore, physicians have recently focused on the use of continuing education as a new component of DSME.
According to the recent recommendation by the American Di- abetes Association, annual visits for diabetes education are rec- ommended to assess all areas of self-management, even for https://doi.org/10.4093/dmj.2017.41.2.99
pISSN 2233-6079 · eISSN 2233-6087
those who meet the goals [6].
Among the many different types of DSME such as individual one-on-one education, group programs, and telemedicine, di- abetes camp has proven to be an ideal environment for the continuing education of children and adolescents with type 1 diabetes mellitus (T1DM) and their families [7,8]. Although the concept of residential diabetes camps for children with T1DM has become widespread throughout the world, with over 46,000 campers in about 180 camps worldwide [9], there are only a limited number of reports of diabetes camps special- ized for adults and/or elderly people with type 2 diabetes mel- litus (T2DM). Moreover, the long-term metabolic benefits of diabetes camps in adult and/or elderly populations with T2DM have not been demonstrated, especially in terms of glycosylat- ed hemoglobin (HbA1c) variability.
The aim of this study was to evaluate the effects of diabetes camps as a type of continuing DSME on long-term metabolic outcomes in middle-aged and elderly patients with T2DM.
METHODS
Study subjects
We obtained clinical data and completed questionnaires from adult patients with T2DM who attended a diabetes camp held from August 21 to 24, 2012. The participants were recruited from the outpatient department of the Diabetes Center in Samsung Medical Center, Seoul, Republic of Korea. All partici- pants except the patients’ family members were included in these analyses.
Clinical data (age, sex, body mass index [BMI], diabetes du- ration, diabetes treatment, underlying hypertension or dyslip- idemia, history of smoking, and history of drug prescriptions) and laboratory measurements (HbA1c, fasting plasma glucose [FPG], postprandial 2-hour glucose [PPG], creatinine, choles- terol, high density lipoprotein cholesterol [HDL-C], low densi- ty lipoprotein cholesterol [LDL-C], and triglyceride [TG]) were obtained from electronic medical records. The depression quotient of each patient, psychological well-being score, and level of satisfaction with the camp were assessed using a ques- tionnaire. The questionnaires were completed on the first and last days of the diabetes camp.
Case-control selection
For each participant in the diabetes camp, up to two control patients were randomly selected by propensity score matching.
The matching variables were age, sex, diabetes duration, and the levels of HbA1c before the education. The variables were categorized as age (≤40, 40 to 49, 50 to 59, 60 to 69, 70 to 79, 80 to 89, and ≥90), diabetes duration (<1, 1 to 5, 5 to 10, and
≥10 years), and HbA1c (%; ≤6, 6 to 6.9, 7 to 7.9, 8 to 8.9, 9 to 9.9, and ≥10). Controls were selected from the clinical data- base of the 7,417 patients who received conventional DSME in the outpatient department from 2008 to 2016 in Samsung Medical Center, Seoul, Republic of Korea.
The protocol for this study was approved by the Institutional Review Board (IRB) of the Samsung Medical Center (IRB file No. 2012-08-004-001).
Organization of the diabetes camp
Patients with T2DM aged 40 years and over were encouraged to attend the diabetes camp with registration on a first-come, first-served basis. Only individuals who were acutely ill or un- able to attend the overnight camp were excluded. The cost per session was 380,000 Korean won (about $325). The diabetes camp consisted of many planned activities including daily medical education lectures, small group discussions, and rec- reational activities provided by diabetes educators, registered dieticians, physicians, pharmacists, exercise educators, and so- cial workers. Small groups were organized throughout the du- ration of the camp, encouraging emotional support within the group of participants. Blood glucose was tested for each camp- er six times a day and as needed. All participants kept individ- ual records about their food choices, physical activity, and blood glucose levels, and received counseling if their blood glucose level was off-target. The participants kept a diabetes di- ary and wrote a daily list of goals or promises about diabetes self-management before bed. For patients using insulin, insu- lin was adjusted before each meal by the staff. All insulin injec- tions were supervised, and all meals were planned by the regis- tered dietitian. There were two attending physicians to super- vise the participants and for medical decisions in case of a medical emergency.
Outcome measures
To compare the short-term effects of the diabetic camp, we ob- tained laboratory parameters (HbA1c, FPG, PPG, and lipid profiles) measured at the closest outpatient clinic before and after the camp, respectively.
To compare the long-term effects of the diabetes camp on glycemic control, we analyzed the variability of HbA1c levels.
The measurements of HbA1c were performed every 3 months for 15 months (maximum five times) before the camp and af- ter the camp, respectively. HbA1c was measured an average of 3.61 times during the 15-month period before the camp and 3.35 times during the 15-month period after the camp. Three patients who failed to check their HbA1c levels at least two times before and two times after the camp (for a total of at least four times) were excluded from the analysis of HbA1c variabil- ity. Since some patients had already achieved very strict glyce- mic control before the camp, a subgroup analysis was conduct- ed for those whose mean HbA1c measured during the 15 months before the camp was ≥6.5% (n=40) and those whose HbA1c was <6.5% (n=14). In addition, a subgroup analysis was conducted for those whose duration of diabetes was ≥15 and <15 years. The interpersonal mean, standard deviation (SD), and coefficient of variance (CV) of HbA1c were calculat- ed. The CV was calculated by dividing the SD by the mean. We also calculated the adjusted SD of HbA1c by dividing with [n/
(n–1)]0.5 (where n is the number of HbA1c measurements) to adjust for the effect of varying numbers of HbA1c measure- ments.
To analyze the effect of medication on the metabolic out- comes, we analyzed the serial changes in the number of diabe- tes medications before and after the camp. Drug compliance was described as the medication possession ratio (MPR), which is calculated as the sum of the number of days that med- ication was taken during the observational period divided by the number of days elapsed during the period. We defined medication adherence as an MPR ≥80%.
To evaluate the psychosocial outcomes, questionnaire data were collected from the participants before and after the camp.
Three of the participants who did not complete the question- naires after the camp were excluded from these analyses. The depression quotient was assessed using the Center for Epide- miologic Studies Depression (CES-D) scale. The CES-D scale is a reliable instrument for screening for depression in patients with different disorders, including diabetes, which is sensitive to changes in care-receiver depressive symptoms after inter- vention [10,11]. The score ranges from 0 to 60, with high scores indicating greater depressive symptoms. Psychological well-being was assessed using the World Health Organization 5-item (WHO-5) Well-Being Index. The total score ranged from 0 (absence of well-being) to 25 (maximal well-being).
The WHO-5 index has been validated in different samples, in- cluding patients with diabetes [12,13].
Statistical analysis
We calculated the numerical data using mean±SD or median (range), while the categorical data were calculated using counts and percentages. The Wilcoxon signed-rank test was used to compare glycometabolic parameters. The CES-D scale and WHO-5 index were also compared using the Wilcoxon signed- rank test and McNemar’s test.
Analysis of covariance (ANCOVA) was used to compare metabolic outcomes in two groups: the group that attended the diabetes camp and a matched control group that received con- ventional education in an outpatient clinic. The dependent variable was each parameter of metabolic outcomes after the diabetes camp or conventional DSME. The covariate was each parameter of metabolic outcomes before the diabetes camp or conventional DSME. The fixed factor was the group difference.
A linear mixed model was used to analyze repeatedly mea- sured HbA1c to compare the effect of the diabetes camp with that of the conventional education. A comparison of differenc- es between the groups over time was performed using a group by time interaction.
Statistical analysis was executed using IBM SPSS Statistics 23.0 (IBM Co., Armonk, NY, USA) and SAS version 9.4 (SAS Institute, Cary, NC, USA). A P value of <0.05 was considered significant.
RESULTS
Baseline characteristics of the study subjects
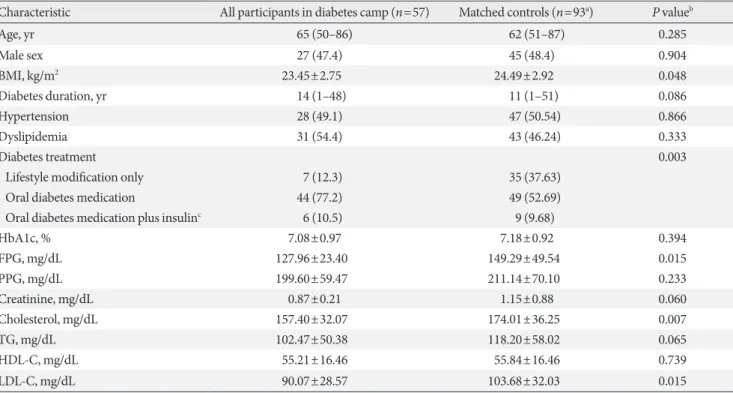
A total of 57 patients participated in the diabetes camp. The median age was 65 years (range, 50 to 86). After propensity score matching, 93 control patients were selected from the source cohort. The baseline characteristics of the participants in the diabetic camp and matched controls are summarized in Table 1. Among the 57 participants of the diabetes camp, three had no matched controls and therefore were excluded from the subsequent case-control analysis. Despite the propensity score matching, there were several differences in baseline character- istics between the groups, including greater BMI, greater pro- portion of patients on lifestyle modification alone, and higher FPG and LDL-C levels in the matched controls (Table 1).
Changes in the metabolic outcomes after the diabetes camp and conventional education
In participants of the diabetes camp, the levels of HbA1c and LDL-C were significantly lower after the diabetes camp than
before the diabetes camp (P=0.022 and P=0.011). There were no significant differences in the levels of FPG, PPG, cholester-
ol, TG, HDL-C, and BMI before and after the diabetes camp (Table 2).
Table 1. Baseline characteristics of participants in the diabetes camp and matched controls
Characteristic All participants in diabetes camp (n=57) Matched controls (n=93a) P valueb
Age, yr 65 (50–86) 62 (51–87) 0.285
Male sex 27 (47.4) 45 (48.4) 0.904
BMI, kg/m2 23.45±2.75 24.49±2.92 0.048
Diabetes duration, yr 14 (1–48) 11 (1–51) 0.086
Hypertension 28 (49.1) 47 (50.54) 0.866
Dyslipidemia 31 (54.4) 43 (46.24) 0.333
Diabetes treatment 0.003
Lifestyle modification only 7 (12.3) 35 (37.63)
Oral diabetes medication 44 (77.2) 49 (52.69)
Oral diabetes medication plus insulinc 6 (10.5) 9 (9.68)
HbA1c, % 7.08±0.97 7.18±0.92 0.394
FPG, mg/dL 127.96±23.40 149.29±49.54 0.015
PPG, mg/dL 199.60±59.47 211.14±70.10 0.233
Creatinine, mg/dL 0.87±0.21 1.15±0.88 0.060
Cholesterol, mg/dL 157.40±32.07 174.01±36.25 0.007
TG, mg/dL 102.47±50.38 118.20±58.02 0.065
HDL-C, mg/dL 55.21±16.46 55.84±16.46 0.739
LDL-C, mg/dL 90.07±28.57 103.68±32.03 0.015
Values are presented as median (range), number (%), or mean±standard deviation.
BMI, body mass index; HbA1c, glycosylated hemoglobin; FPG, fasting plasma glucose; PPG, postprandial 2-hour glucose; TG, triglyceride;
HDL-C, high density lipoprotein cholesterol; LDL-C, low density lipoprotein cholesterol.
aThree participants of diabetes camp were not matched because the matched controls were not available. One was a 76-year-old male with 28 years of diabetes duration and 8.1% of HbA1c, another was a 61-year-old female with 13 years of diabetes duration and 9.0% of HbA1c, and the other was a 62-year-old female with 13 years of diabetes duration and 6.4% of HbA1c, bComparisons were performed using the Mann-Whitney test or the chi-square test, cBasal insulin once daily (n=5); multiple daily insulin injection (n=1).
Table 2. The comparison of metabolic outcomes before and 3 to 6 months after the diabetes camp or conventional education Parameter Participants of the diabetes camp (n=57) Matched controls (n=93) P valueb
(case vs. control) Before 3–6 Months P valuea Before 3–6 Months P valuea
BMI, kg/m2 23.45±2.75 23.71±2.74 0.431 24.49±2.92 24.22±2.90 0.021 0.036
HbA1c, % 7.08±0.97 6.90±0.87 0.022 7.18±0.92 6.96±1.05 0.005 0.915
FPG, mg/dL 127.96±23.48 124.58±20.15 0.330 149.29±49.54 137.36±39.03 0.002 0.344 PPG, mg/dL 199.60±59.47 189.24±63.23 0.428 211.14±70.10 197.76±75.81 0.104 0.515 Cholesterol, mg/dL 157.40±32.07 152.29±26.93 0.524 1.15±0.88 164.95±35.74 0.055 0.427
TG, mg/dL 102.47±50.38 94.86±56.02 0.280 174.01±36.25 117.53±58.82 0.175 0.575
HDL-C, mg/dL 55.21±16.46 58.69±19.38 0.061 55.84±16.46 56.78±15.41 0.071 0.360
LDL-C, mg/dL 90.07±28.57 82.02±25.18 0.011 103.68±32.03 97.85±29.02 0.222 0.031
Values are presented as mean±standard deviation.
BMI, body mass index; HbA1c, glycosylated hemoglobin; FPG, fasting plasma glucose; PPG, postprandial 2-hour glucose; TG, triglyceride;
HDL-C, high density lipoprotein cholesterol; LDL-C, low density lipoprotein cholesterol.
aComparisons were performed using the Wilcoxon signed-rank test, bAmong the 57 participants of the diabetes camp, three who had no matched controls were excluded from this case-control analysis. Comparisons were performed using analysis of covariance.
In the matched control group, BMI and the levels of FPG and HbA1c were significantly lower after the conventional ed- ucation than before the education (P=0.021, P=0.002, and P=0.005, respectively) (Table 2).
When the changes from baseline in metabolic outcomes among the participants of the diabetes camp were compared to those of the matched controls by ANCOVA, the decrease from baseline in LDL-C levels in the participants of the diabetes camp was significantly greater than those of the matched con- trols (P=0.036). In this analysis, the decrease in BMI from baseline in the matched controls was greater than those of the participants of the diabetes camp (P=0.031). Changes in the FPG, PPG, HbA1c, cholesterol, TG, and HDL-C levels were not significantly different in this analysis (Table 2).
The levels of HbA1c (P=0.341) (Supplementary Fig. 1) and BMI (P=0.084) (Supplementary Fig. 2) during the first year af- ter each education was not different between the groups over- all.
Psychosocial outcomes
The WHO-5 well-being index increased after the camp experi- ence and was significantly different from the values before the camp (P<0.0001). The CES-D score, an indicator of depression symptoms, was lower after the camp and was also significantly different from the values before the camp (P=0.0035) (Supple- mentary Table 1). On the basis of WHO-5 and CES-D scores, there were seven (three identical and four non-identical) pa- tients with scores suggestive of depression at baseline. The pro- portion of the participants with a WHO-5 score of ≤12 (P=
0.031) but not a CES-D score of <16 (P=0.158) decreased sig- nificantly after the diabetes camp. Among these patients, one patient took a selective serotonin uptake inhibitor and there was no change in the dose after the diabetes camp.
Changes in medication prescriptions after the diabetes camp and conventional education
The number of glucose-lowering medications at 6 months did not change in 49 of 55 (88%) diabetes camp participants and in 57 of 89 (65%) control patients (P=0.001). The details of the changes in prescriptions after the diabetes camp and conven- tional education are summarized in Supplementary Table 2.
The MPR and medication adherence (defined as an MPR
≥80%) before and after the diabetes camp were not signifi- cantly different (76.33±21.33 vs. 76.41±21.97, P=0.757; 24 [42.1%] vs. 25 [43.9%], P=1.000). The MPR and adherence
rate before the conventional education were not available for the majority of the control patients.
Among the 57 patients who attended the diabetes camp, 33 patients (57%) were taking lipid-lowering agents before the camp and three patients (5.3%) received new prescriptions for lipid-lowering agents after the camp. Among the 93 control patients, 43 patients (46%) were taking lipid-lowering agents before the education and 18 patients (19%) received new pre- scriptions for lipid-lowering agents after the education.
One-year mean and variability of glycemic parameters before and after the diabetes camp
Besides the case-control analysis, the 1-year variability of HbA1c, FPG, and PPG after the diabetes camp in its partici- pants was compared with their own 1-year variability of HbA1c, FPG, and PPG before the diabetes camp. In all partici- pants of the diabetes camp, the 1-year mean and SD of HbA1c improved (P=0.010 and P=0.041). The adjusted SD and CV of HbA1c were not significantly different in this analysis.
After the exclusion of subjects with a mean HbA1c of <6.5%
before the camp, the mean, SD, adjusted SD, and CV of HbA1c significantly improved (Table 3). The 1-year mean and vari- ability of FPG was not significantly different in all subjects and in patients whose HbA1c was ≥6.5% before the camp. Howev- er, the SD and CV of PPG were significantly improved after the diabetes camp (Table 3). The 1-year mean, SD, adjusted SD, and CV of HbA1c significantly improved after the diabetes camp in the subjects with diabetes duration of <15 years (Sup- plementary Table 3).
Serial changes in HbA1c during the 15 months before and 15 months after the diabetes camp are shown in Fig. 1. In the control group, the 1-year mean for HbA1c before the conven- tional DSME was not available for the majority of the subjects.
DISCUSSION
In this study, the metabolic benefits of the diabetes camp as a continuing DSME for middle-aged adults and the elderly with T2DM were comparable to those of conventional DSME, even though fewer changes in medications occurred with the group who attended the camp than with those who received conven- tional DSME. In the participants of the diabetes camp, long- term benefits to glycemic control were observed in terms of the 1-year mean and SD of HbA1c. The 1-year adjusted SD and CV of HbA1c were improved in those with a baseline
mean HbA1c of ≥6.5% and a diabetes duration of <15 years.
The typical subjects in this study were older, had diabetes for a long time, and used oral antidiabetes medications. Because the effect of a diabetes camp has almost been exclusively exam-
ined in children and adolescents with T1DM, little is known about the benefits of a diabetes camp in the elderly population [14]. In contrast to the conventional DSME typically offered at the time of initial diabetes diagnosis, the effect of diabetes Table 3. The comparison of the 1-year mean variability of glycosylated hemoglobin before and after the diabetes camp
Parameter 3–15 Months before the camp 3–15 Months after the camp P valuea
In all patients (n=57)
Mean and variability of HbA1c (n=54b)
Mean of HbA1c, % 7.11±0.98 6.95±0.87 0.010
SD of HbA1c, % 0.34±0.32 0.27±0.21 0.041
Adjusted SD of HbA1c, % 0.11±0.08 0.09±0.06 0.103
CV of HbA1c 0.05±0.04 0.04±0.03 0.065
Mean and variability of FPG (n=50b)
Mean of FPG, mg/dL 129.96±22.34 127.88±20.46 0.705
SD of FPG, mg/dL 16.28±14.90 16.91±16.73 0.554
Adjusted SD of FPG, mg/dL 5.71±5.01 6.58±8.46 0.901
CV of FPG 0.12±0.09 0.13±0.15 0.678
Mean and variability of PPG (n=45b)
Mean of PPG, mg/dL 200.95±49.08 193.20±58.43 0.136
SD of PPG, mg/dL 38.36±21.80 31.05±17.63 0.108
Adjusted SD of PPG, mg/dL 14.29±11.90 13.27±9.27 0.835
CV of PPG 0.19±0.11 0.17±0.10 0.225
In the patients whose HbA1c was ≥6.5% before the camp (n=43) Mean and variability of HbA1c (n=40b)
Mean of HbA1c, % 7.45±0.89 7.23±0.83 0.003
SD of HbA1c, % 0.41±0.34 0.31±0.22 0.026
Adjusted SD of HbA1c, % 0.13±0.09 0.10±0.07 0.049
CV of HbA1c 0.05±0.04 0.04±0.03 0.045
Mean and variability of FPG (n=37b)
Mean of FPG, mg/dL 135.56±25.57 131.44±21.40 0.300
SD of FPG, mg/dL 19.12±16.11 20.24±18.15 0.789
Adjusted SD of FPG, mg/dL 6.59±5.36 7.54±9.49 0.649
CV of FPG 0.14±0.10 0.16±0.17 0.946
Mean and variability of PPG (n=34b)
Mean of PPG, mg/dL 217.60±43.09 209.31±56.80 0.135
SD of PPG, mg/dL 41.41±22.05 29.30±14.95 0.013
Adjusted SD of PPG, mg/dL 15.56±12.99 11.90±6.56 0.285
CV of PPG 0.20±0.11 0.14±0.07 0.018
Values are presented as mean±standard deviation.
HbA1c, glycosylated hemoglobin; SD, standard deviation; CV, coefficient of variation; FPG, fasting plasma glucose; PPG, postprandial 2-hour glucose.
aComparisons were performed using the Wilcoxon signed-rank test, bOf the total of 57 patients, those who failed to check the outcomes at least two times in the 15 months before and two times in the 15 months after the camp were excluded.
camp as a continuing diabetes education in patients with a long duration of diabetes has not been extensively investigated.
In this study, the improvements in both metabolic outcomes and depression indices were consistent with those reported in the diabetes camp for children/adolescents with T1DM [7,8, 15,16]. Compared to the matched controls that received con- ventional DSME, the participants of the diabetes camp showed more reductions in LDL-C levels in 3 to 6 months after the dia- betes camp and comparable glycometabolic parameters during the 1 year after the education despite fewer changes in lipid- lowering and glucose-lowering drug regimens. However, these results should be interpreted in the context of different baseline characteristics between the two groups despite the propensity for score-matching. When compared to their own 1-year vari- ability in HbA1c, FPG, and PPG before the diabetes camp, the 1-year adjusted SD and CV of HbA1c were significantly re- duced after the diabetes camp in participants with a baseline mean HbA1c of ≥6.5% and a diabetes duration of <15 years.
These results indicate that diabetes camp as a continuing re- newal education can also be effective in middle-aged and el- derly patients, although more attention has been focused on conventional DSME for patients with new-onset diabetes.
Several factors in this study can explain the positive effects of diabetes camp. First, the sustained positive impacts of the dia- betes camp were demonstrable in terms of the 1-year variabili- ty of HbA1c and PPG rather than the 1-year variability of FPG, with fewer changes in the prescription of glucose-lowering
medications than in matched controls. In contrast, the majori- ty of the matched controls received the conventional DSME when they followed up at the outpatient clinic for less than sev- eral months, and the medications were changed in a higher proportion of these patients than in the participants of the dia- betes camp. Although the data are not sufficient to fully explain the difference, we speculate that more consistent adherence to the instructions for reducing PPG such as avoidance of foods with high glycemic index and increasing post-meal physical activity could be one of the contributing factors to the positive outcomes. Second, the emotional support provided by fellow camp participants and the caregivers was effective in improv- ing the emotional status of the participants, as reflected in the WHO-5 well-being index and the CES-D scores obtained im- mediately after the diabetes camp. Each of these indices also improved in six out of seven participants whose score before the camp was in a range suggesting depression. Although the long-term effects of the diabetes camp on these indices were not identified, the results could indicate that improvement in emotional status could be a contributor to the improved meta- bolic outcomes in elderly people with T2DM [17-19]. This should be confirmed in future studies with longer follow-up periods.
One of the strengths of this study lies in the documentation of HbA1c variability, rather than tabulation of only the abso- lute levels of HbA1c at each point. HbA1c variability has been increasingly reported as an independent risk factor for chronic Fig. 1. Serial changes in glycosylated hemoglobin (HbA1c) before and after the diabetes camp. The error bars represent the stan- dard deviation of HbA1c; n is the number of patients who checked their HbA1c levels at each time point.
9.39.1 8.98.7 8.58.3 8.17.9 7.77.5 7.37.1 6.96.7 6.56.3 6.15.9 5.7
Mean HbAlc (%)
−15 to −12 −12 to −9 −9 to −6 −6 to −3 −3 to 0 0 to 3 3 to 6 6 to 9 9 to 12 12 to 15 Month 30 31 32 29 36 31 24 35 26 33
n= (Participants with HbA1c ≥6.5%)
(All participants)
n= 39 43 43 36 45 42 32 42 34 41
Participants whose HbA1 was ≥6.5%
before the camp (n=43)
All participants of diabetes camp (n=57)
complications of diabetes [20-22]. HbA1c at the baseline itself does not provide information on the baseline status of the gly- cemic control over 1 year because it cannot discriminate a sub- ject with a temporarily low or high HbA1c only at baseline re- gardless of the actual glycemic control over 1 year. Analysis of the 1-year mean and variability of HbA1c can better represent the longer-term glycemic control. To our knowledge, this is the first report to demonstrate that diabetes camp can reduce HbA1c variability as well as HbA1c values. Notably, the re- duced 1-year adjusted SD and CV of HbA1c was observed only in the participants of diabetes camp with a baseline mean HbA1c of ≥6.5% and a diabetes duration of <15 years. These results might reflect the difficulty in making an impact by con- tinuing renewal education in participants already with very strict glucose control or very long duration of diabetes.
Several limitations of the study should be discussed. First, because of the retrospective case-control study design, the data were insufficient to explain the reason for the positive impact of the diabetes camp. For example, depression scores were ob- tained only immediately after the diabetes camp, and a detailed description of the diet and exercise before and after the diabe- tes camp was not possible. Second, a 1-year variability of glyce- mic parameters before the conventional DSME was not avail- able for the majority of the patients in the matched control group because they did not visit the outpatient clinic ≥2 times before the conventional DSME. Although we screened more than 7,000 patients who received DSME in our outpatient clin- ic, in most cases, DSME was routinely prescribed within the first few visits to our clinic.
In conclusion, diabetes camp as a continuing DSME in mid- dle-aged adults and elderly people with T2DM showed meta- bolic outcomes comparable to those of the conventional DSME despite fewer increases in drug regimens. Moreover, in participants of the diabetes camp with a baseline 1-year mean HbA1c of ≥6.5% and a diabetes duration of <15 years, sus- tained benefits of glycemic control were demonstrated in terms of a 1-year adjusted SD and CV of HbA1c. The results of this study support the use of the diabetes camp as an effective tool for continuing DSME in this population.
CONFLICTS OF INTEREST
No potential conflict of interest relevant to this article was re- ported.
ACKNOWLEDGMENTS
The authors thank the Biostatistics Department of Samsung Biomedical Research Institute for its statistical assistance.
REFERENCES
1. Gagliardino JJ, Aschner P, Baik SH, Chan J, Chantelot JM, Ilko- va H, Ramachandran A; IDMPS investigators. Patients’ educa- tion, and its impact on care outcomes, resource consumption and working conditions: data from the International Diabetes Management Practices Study (IDMPS). Diabetes Metab 2012;
38:128-34.
2. Norris SL, Lau J, Smith SJ, Schmid CH, Engelgau MM. Self- management education for adults with type 2 diabetes: a meta- analysis of the effect on glycemic control. Diabetes Care 2002;
25:1159-71.
3. Kim MY, Suh S, Jin SM, Kim SW, Bae JC, Hur KY, Kim SH, Rha MY, Cho YY, Lee MS, Lee MK, Kim KW, Kim JH. Educa- tion as prescription for patients with type 2 diabetes mellitus:
compliance and efficacy in clinical practice. Diabetes Metab J 2012;36:452-9.
4. Choi MJ, Yoo SH, Kim KR, Bae YM, Ahn SH, Kim SS, Min SA, Choi JS, Lee SE, Moon YJ, Rhee EJ, Park CY, Lee WY, Oh KW, Park SW, Kim SW. Effect on glycemic, blood pressure, and lipid control according to education types. Diabetes Metab J 2011;
35:580-6.
5. Hermanns N, Schmitt A, Gahr A, Herder C, Nowotny B, Roden M, Ohmann C, Kruse J, Haak T, Kulzer B. The effect of a Diabe- tes-Specific Cognitive Behavioral Treatment Program (DIA- MOS) for patients with diabetes and subclinical depression: re- sults of a randomized controlled trial. Diabetes Care 2015;
38:551-60.
6. Powers MA, Bardsley J, Cypress M, Duker P, Funnell MM, Hess Fischl A, Maryniuk MD, Siminerio L, Vivian E. Diabetes self-management education and support in type 2 diabetes: a joint position statement of the American Diabetes Association, the American Association of Diabetes Educators, and the Academy of Nutrition and Dietetics. Diabetes Care 2015;38:
1372-82.
7. Carlson KT, Carlson GW Jr, Tolbert L, Demma LJ. Blood glu- cose levels in children with type 1 diabetes attending a residen- tial diabetes camp: a 2-year review. Diabet Med 2013;30:e123-6.
8. Dehayem MY, Takogue R, Choukem SP, Donfack OT, Katte JC, Sap S, Sobngwi E, Mbanya JC. Impact of a pioneer diabetes
camp experience on glycemic control among children and ad- olescents living with type 1 diabetes in sub-Saharan Africa.
BMC Endocr Disord 2016;16:5.
9. American Diabetes Association. Diabetes management at camps for children with diabetes. Diabetes Care 2012;35 Suppl 1:S72-5.
10. Stahl D, Sum CF, Lum SS, Liow PH, Chan YH, Verma S, Chua HC, Chong SA. Screening for depressive symptoms: validation of the center for epidemiologic studies depression scale (CES- D) in a multiethnic group of patients with diabetes in Singa- pore. Diabetes Care 2008;31:1118-9.
11. Zhang Y, Ting RZ, Lam MH, Lam SP, Yeung RO, Nan H, Ozaki R, Luk AO, Kong AP, Wing YK, Sartorius N, Chan JC. Measur- ing depression with CES-D in Chinese patients with type 2 dia- betes: the validity and its comparison to PHQ-9. BMC Psychia- try 2015;15:198.
12. Hajos TR, Pouwer F, Skovlund SE, Den Oudsten BL, Geelhoed- Duijvestijn PH, Tack CJ, Snoek FJ. Psychometric and screening properties of the WHO-5 well-being index in adult outpatients with type 1 or type 2 diabetes mellitus. Diabet Med 2013;30:
e63-9.
13. Newnham EA, Hooke GR, Page AC. Monitoring treatment re- sponse and outcomes using the World Health Organization’s Wellbeing Index in psychiatric care. J Affect Disord 2010;122:
133-8.
14. Kim TK, Kang YE, Kim JM, Hong WJ, Kim KS, Kim HJ, Kim YK, Ku BJ. Effects of diabetic camp in type 2 diabetic patients.
Korean J Med 2012;83:210-5.
15. American Diabetes Association. 10. Older adults. Diabetes Care 2016;39 Suppl 1:S81-5.
16. Bultas MW, Schmuke AD, Moran V, Taylor J. Psychosocial out- comes of participating in pediatric diabetes camp. Public
Health Nurs 2016;33:295-302.
17. Safren SA, Gonzalez JS, Wexler DJ, Psaros C, Delahanty LM, Blashill AJ, Margolina AI, Cagliero E. A randomized controlled trial of cognitive behavioral therapy for adherence and depres- sion (CBT-AD) in patients with uncontrolled type 2 diabetes.
Diabetes Care 2014;37:625-33.
18. Bultas MW, Budhathoki C, Balakas K. Evaluation of child and parent outcomes after a pediatric cardiac camp experience. J Spec Pediatr Nurs 2013;18:320-8.
19. Baumeister H, Hutter N, Bengel J. Psychological and pharma- cological interventions for depression in patients with diabetes mellitus and depression. Cochrane Database Syst Rev 2012;12:
CD008381.
20. Penno G, Solini A, Zoppini G, Orsi E, Fondelli C, Zerbini G, Morano S, Cavalot F, Lamacchia O, Trevisan R, Vedovato M, Pugliese G; Renal Insufficiency and Cardiovascular Events (RI- ACE) Study Group. Hemoglobin A1c variability as an inde- pendent correlate of cardiovascular disease in patients with type 2 diabetes: a cross-sectional analysis of the renal insuffi- ciency and cardiovascular events (RIACE) Italian multicenter study. Cardiovasc Diabetol 2013;12:98.
21. Penno G, Solini A, Bonora E, Fondelli C, Orsi E, Zerbini G, Morano S, Cavalot F, Lamacchia O, Laviola L, Nicolucci A, Pugliese G; Renal Insufficiency And Cardiovascular Events Study Group. HbA1c variability as an independent correlate of nephropathy, but not retinopathy, in patients with type 2 diabe- tes: the Renal Insufficiency And Cardiovascular Events (RI- ACE) Italian multicenter study. Diabetes Care 2013;36:2301-10.
22. Nakahara R, Yoshiuchi K, Kumano H, Hara Y, Suematsu H, Kuboki T. Prospective study on influence of psychosocial fac- tors on glycemic control in Japanese patients with type 2 diabe- tes. Psychosomatics 2006;47:240-6.
Supplementary Table 1. Comparison of psychosocial outcomes before and after the diabetes camp (n=54a)
Parameter Before camp After camp P valueb
WHO-5 indexc 16.47±3.84 20.06±3.39 <0.001
≤12 7 (13) 1 (2) 0.031
>12 47 (87) 53 (98)
CES-D scored 11.30±9.90 8.13±6.74 0.004
<16 41 (76) 44 (81) 0.158
16≤ and <25 6 (11) 9 (17)
≥25 7 (13) 1 (2)
Values are presented as mean±standard deviation or number (%).
WHO-5 index, World Health Organization 5-item Well-Being Index; CES-D, Center for Epidemiologic Studies Depression.
aThree patients who did not complete the questionnaires after the camp were excluded, bComparisons were performed using the Wilcoxon signed-rank test for continuous variables and McNemar's test for categorical variables, cThe cut-off value in the WHO-5 score suggesting de- pression is ≤12, dCES-D score >16 is associated with significant depressive symptoms and >25 is associated with major depression.
Supplementary Table 2. Changes in the number of glucose-lowering medications at 6 months after the diabetes camp or conven- tional educationa
Variable Diabetes camp (n=55a) Conventional education (n=89a) P valueb
Unchanged 49 (89) 57 (64) 0.001
Intensified 4 (7)c 28 (31)c 0.001
Reduced 2 (4)d 4 (4)d 0.001
Values are presented as number (%).
aTwo patients in the diabetes camp group and four patients in the conventional education group were excluded from the analysis because they did not follow-up at the outpatient clinic for ≥6 months after the camp or conventional education, bComparison was performed using the chi- square test, cLifestyle modification only to monotherapy (n=1), dual therapy to triple therapy (n=1), and increased insulin doses (n=2) in the diabetes camp group; initiation of oral agents (n=14), monotherapy to dual therapy (n=3), dual therapy to triple therapy (n=4), initiation of in- sulin therapy (n=3), and increased insulin doses (n=3) in the conventional education group, dTriple therapy to dual therapy (n=1) and reduced insulin dose (n=1) in the diabetes camp group; monotherapy to lifestyle modification (n=1), dual therapy to monotherapy (n=1), stopping in- sulin therapy (n=1), and reduced insulin dose (n=1) in the conventional education group.
Supplementary Table 3. Comparison of the 1-year mean variability in glycosylated hemoglobin before and after the diabetes camp in participants with diabetes duration of <15 years (n=32a)
Parameter 3–15 Months before the camp 3–15 Months after the camp P valuea
Mean and variability of HbA1c (n=31b)
Mean of HbA1c, % 6.98±1.00 6.78±0.80 0.043
SD of HbA1c, % 0.36±0.37 0.22±0.19 0.008
Adjusted SD of HbA1c, % 0.11±0.09 0.07±0.05 0.006
CV of HbA1c 0.05±0.04 0.03±0.02 0.010
Mean and variability of FPG (n=28b)
Mean of FPG, mg/dL 126.48±21.51 125.10±22.13 0.792
SD of FPG, mg/dL 14.14±16.96 16.82±20.00 0.866
Adjusted SD of FPG, mg/dL 4.76±4.41 6.94±11.08 0.904
CV of FPG 0.10±0.10 0.14±0.19 0.847
Mean and variability of PPG (n=24b)
Mean of PPG, mg/dL 198.64±48.88 184.17±54.09 0.103
SD of PPG, mg/dL 32.90±20.10 25.38±13.84 0.209
Adjusted SD of PPG, mg/dL 13.22±11.50 9.84±5.75 0.189
CV of PPG 0.17±0.10 0.14±0.08 0.331
Values are presented as mean±standard deviation.
HbA1c, glycosylated hemoglobin; SD, standard deviation; CV, coefficient of variation; FPG, fasting plasma glucose; PPG, postprandial 2-hour glucose.
aComparisons were performed using the Wilcoxon signed-rank test, bOf the 32 patients, those who failed to check the outcomes at least two times in the 15 months before and two times in the 15 months after the camp were excluded.
Supplementary Fig. 1. Serial changes in glycosylated hemoglobin (HbA1c) from before the diabetes camp to 15 months after the diabetes camp or conventional diabetes self-management education. The error bars represent standard deviations of HbA1c; n is the number of patients who checked their HbA1c levels at each time point.
8.78.5 8.3 8.17.9 7.7 7.57.3 7.1 6.96.7 6.56.3 6.1 5.95.7
Mean HbAlc (%)
Before 0 to 3 3 to 6 6 to 9 9 to 12 12 to 15 Month
93 42 32 42 34 41
n= (Participants of the camp)
(Matched controls)
n= 57 63 50 37 40 22
Participants of diabetes camp (n=57)
Matched controls (n=93)
Supplementary Fig. 2. Serial changes in body mass index (BMI) from before the diabetes camp to 15 months after the diabetes camp or conventional diabetes self-management education.
28 27 26 25 24 23 22 21 20 BMI (kg/m2 )
–3 to 0 0 to 3 3 to 6 6 to 9 9 to 12 12 to 15 Month
57 39 34 42 36 37
n= (Participants of the camp)
(Matched controls)
n= 93 66 48 53 48 29
Participants of diabetes camp (n=57)
Matched controls (n=93)