Leu72Met and Other Intronic Polymorphisms in the GHRL and GHSR Genes Are Not Associated with Type 2 Diabetes Mellitus, Insulin Resistance, or Serum Ghrelin Levels in a Saudi Population
Faris Elbahi Joatar1,*, Ali Ahmed Al Qarni1,*, Muhalab E. Ali2, Abdulaziz Al Masaud1, Abdirashid M. Shire1, Nagalla Das3, Khalid Gumaa2,4, Hayder A. Giha2
1Department of Internal Medicine and Clinical Biochemistry Laboratory, King Abdulaziz Hospital, National Guard Health Affairs, Al-Ahsa, Saudi Arabia; 2Department of Medical Biochemistry, Arabian Gulf University College of Medicine and Medical Sciences; 3Clinical Biochemistry Laboratory, Salmaniya Medical Complex, Manama, Bahrain; 4Cell and Developmental Biology, Division of Biosciences, University College London, London, United Kingdom
Background: Ghrelin (GHRL), a gastric peptide encoded by the GHRL gene, is known to be involved in energy homeostasis via its G protein receptor, encoded by the growth hormone secretagogue receptor (GHSR) gene. Some studies have shown associations be- tween plasma GHRL levels and GHRL single-nucleotide polymorphisms (SNPs), namely the Leu72Met polymorphism (rs696217 TG), with type 2 diabetes mellitus (T2DM) and insulin resistance (IR), while others have not. The controversies in these associations raise the issue of ‘which SNPs in which populations.’ The aim of this study was to investigate whether SNPs in GHRL and/or GHSR genes were associated with T2DM, IR, or plasma GHRL levels among Arab Saudis.
Methods: Blood was collected from 208 Saudi subjects with (n=107) and without (n=101) T2DM. DNA samples from these sub- jects were analyzed by real-time polymerase chain reaction to genotype five intronic SNPs in the GHRL (rs696217 TG, rs27647 CT, rs2075356 CT, and rs4684677 AT) and GHSR (rs509030 GC) genes. In addition, plasma GHRL levels were measured by a radioim- munoassay.
Results: None of the SNPs were associated with T2DM, IR, or plasma GHRL levels. The frequencies of the alleles, genotypes, and haplotypes of the five SNPs were comparable between the T2DM patients and the non-diabetic subjects. A large number of the GHRL haplotypes indicates the molecular heterogeneity of the preproghrelin gene in this region.
Conclusion: Neither the Leu72Met polymorphism nor the other intronic GHRL and GHSR SNPs were associated with T2DM, IR, or GHRL levels. Further investigations should be carried out to explain the molecular basis of the association of the GHRL peptide with T2DM and IR.
Keywords: Diabetes mellitus, type 2; Insulin resistance; Ghrelin; Receptors, ghrelin; Polymorphism
Received: 2 April 2017, Revised: 23 May 2017, Accepted: 1 June 2017 Corresponding author: Hayder A. Giha
Department of Medical Biochemistry, Arabian Gulf University College of Medicine and Medical Sciences, PO Box 22979, Manama, Bahrain
Tel: +973-17239791, Fax: +973-17271090, E-mail: [email protected]
*These authors contributed equally to this work.
Copyright © 2017 Korean Endocrine Society
This is an Open Access article distributed under the terms of the Creative Com- mons Attribution Non-Commercial License (http://creativecommons.org/
licenses/by-nc/4.0/) which permits unrestricted non-commercial use, distribu- tion, and reproduction in any medium, provided the original work is properly cited.
INTRODUCTION
In 1999, ghrelin (GHRL) was identified as a peptide hormone secreted from stomach A-like cells and other tissues, and it was found that the effects of GHRL are mediated via growth hor- mone secretagogue receptors (GHSRs), which are located in the hypothalamus, heart, and adipose tissue [1]. GHRL was found to have an important direct role in energy homeostasis by affect- ing appetite and food intake [2,3] and indirectly by its influence on the actions of insulin, growth hormone, and probably other hormones. Thus, abnormalities of this peptide have pathological consequences that are reflected in type 2 diabetes mellitus (T2DM), adiposity, obesity, and body weight [2,3]. Additional- ly, GHRL was reported to be associated with hypertension [4].
A common clinical scenario for the above associations of GHRL is metabolic syndrome (MetS), in which the shared pathognomonic feature is insulin resistance (IR). However, GHRL has several other functions that were reviewed by Leite- Moreira and Soares in 2007 [5], including its role in cell prolif- eration and thus cancer risk. IR is a cardinal feature of T2DM and its associated metabolic abnormalities, the MetS, which to- gether enhance cardiovascular morbidity, obesity, and mortality [6,7]. Although the exact mechanism of IR has yet to be con- firmed, several risk factors have been identified, including GHRL deficiency.
The preproghrelin (GHRL) gene is located on the short arm of chromosome 3 (3q25-26) and is transcribed into messenger RNA with four exons and five introns, encoding 117 amino ac- ids, which are processed to give the 28-amino-acid molecule GHRL [1,8]. The active form is produced by addition of an oc- tanoyl group (C7H15CO) to the third amino acid residue (serine).
However, alternative promoters and alternative splicing of GHRL result in five transcript variants, some of which encode different protein isoforms; some do not encode any protein, but may regulate GHRL-obestatin preproprotein expression. Mean- while, GHSRs, which are typical G protein-coupled receptors with seven transmembrane domains [9], are products of two transcriptional variants of the GHSR gene, on the short arm of chromosome 3 (3q25). The GHSR type 1a gene (GHSR), when an intron is excised, encodes the cognate receptor of GHRL [1].
The full-length receptor (type 1a) contains 366 amino acids en- coded by two exons. The other transcriptional variant, type 1b, retains the intron; however, it may not function as a GHRL re- ceptor.
An association of low plasma GHRL levels with T2DM and IR was recently demonstrated among Saudi subjects [10]. Simi-
lar findings have been observed in other studies from different regions [11-13]. Furthermore, few studies have investigated the relationship of GHRL and GHSR polymorphisms with plasma GHRL levels. Of those studies, several have reported associa- tions of the Leu72Met (rs696217 TG) polymorphism with T2DM, IR, and other disorders [14-18]. Thus, in this study, the aim was to examine the associations of Leu72Met and three other intronic GHRL single-nucleotide polymorphisms (SNPs) (rs27647 CT, rs2075356 CT, and rs4684677 AT) and one GHSR SNP (rs509030) with GHRL levels, T2DM, and IR among Sau- di subjects. Knowledge of ethnic variations in the distribution and significance of the GHRL/GHSR SNPs will add to our knowledge about GHRL in general.
METHODS
Study subjects
This study was carried out in the Eastern Region of the King- dom of Saudi Arabia, King Abdulaziz Hospital and primary health centers of the National Guard Health Affairs in Al-Ahsa Governorate. The 208 study subjects were aged between 18 and 75 years, and 107 subjects (61 males and 46 females) were known to have T2DM. The T2DM diagnosis was based on the 1998 World Health Organization diagnostic and classification criteria [19]. The patients were being followed up as outpatients.
The other study subjects were 101 (57 males and 44 females) non-diabetic and apparently healthy individuals. Acute and chronic severe illnesses, pregnancy, and lactation were exclu- sion criteria.
Study design and sample collection
This was an observational cross-sectional study that received ethical approval from the research committees of two different institutions: the Arabian Gulf University and King Abdullah In- ternational Research Center, Riyadh, Kingdom of Saudi Arabia.
After the aim of the study was explained, all patients and con- trol subjects signed an informed consent form. Blood samples were drawn from all donors in the morning, after 10 to 12 hours of overnight fasting, into three tubes: (1) a gel/dry plain tube for the lipid profile; (2) a whole blood in ethylenediaminetetraace- tic acid tube for hemoglobin A1c (HbA1c) and GHRL analysis, with the buffy coat retained for DNA extraction; and (3) a fluo- ride tube from which plasma was used to determine fasting glu- cose and insulin levels. Serum, plasma, and buffy coat samples were stored at −40°C pending analysis.
Blood chemistry Blood glucose analysis
Fasting blood glucose levels were estimated using an auto-ana- lyzer, the Architect c8000 (Abbott Laboratories Inc., Abbott Park, IL, USA). HbA1c was estimated by measuring glycated hemoglobin using a G8 analyzer (TOSOH, Tessenderlo, Bel- gium).
Plasma insulin
Plasma insulin was quantitatively assayed using a chemilumi- nescence procedure with an auto-analyzer, the Architect i2000 (Abbott Laboratories Inc.). IR was calculated using the homeo- stasis model assessment 2 (HOMA-IR) [20].
Blood GHRL measurement
The active form of plasma GHRL was measured by a radioim- munoassay (Millipore Research, St Charles, MO, USA). Brief- ly, on day 1, 100 µL of standards or plasma samples or controls and guinea pig GHRL antiserum were added to polystyrene tubes and incubated at 4°C for 20 to 24 hours. On day 2, 100 µL of 125I-GHRL tracer was added and incubated at 4°C for a fur- ther 20 to 24 hours. On day 3, 1 mL of cold precipitating reagent was added to each tube and incubated for 20 minutes at 4°C.
After centrifugation at 2,000 to 3,000 rpm for 20 minutes at 4°C, radioactivity in the pellet was counted using a γ counter. The plasma GHRL levels (pmol/L) were then determined by the in- terpolation of the reference curve drawn using standard concen- trations of GHRL. This method can achieve a sensitivity of 7.8 pg/mL using 100 µL plasma samples. This assay recognized only the active form of human GHRL [21] and showed no sig- nificant cross-reactivity with, or interference from, other factors related to GHRL (des-octanoyl GHRL <0.1%) or motilin-relat- ed peptide [4].
Analysis of polymorphisms in the GHRL and GHSR genes DNA extraction
Total genomic DNA was extracted from the leukocyte-rich buffy coat layer, using the Illustra protocol, limited DNA Mini Kit, according to the manufacturer’s specifications (GE Health- care UK Limited, Amersham Place, UK).
Selection of the GHRL and GHSR SNPs
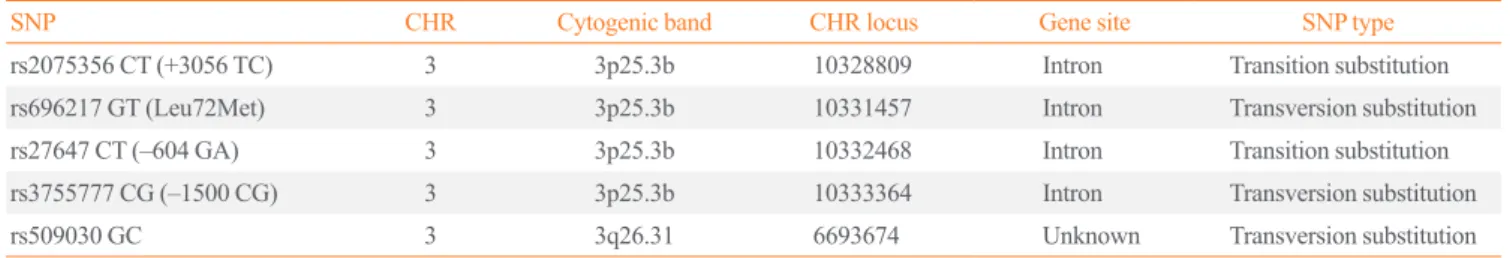
The GHRL SNPs rs696217 TG (Leu72Met), rs27647 CT, rs2075356 CT (+3056), and rs3755777 GC (−1500) and the GHSR SNP rs509030 GC (Table 1) were selected by searching through the ABI HapMap (Applied Biosystems Inc., Foster City, CA, USA) data available via the SNP browser. The primer sequences for each SNP can be found at: http://www.ncbi.nlm.
nih.gov/SNP/snp_ref.cgi?. All SNPs were in Hardy-Weinberg equilibrium (Table 2).
Real-time polymerase chain reaction analysis
GHRL/GHSR genotyping was done by real-time polymerase chain reaction (PCR), using the Applied Biosystems StepOne PCR System (Applied Biosystems Inc.). The assay is based on the detection of fluorescent signals generated proportionally during each PCR cycle. The genotyping was carried out in two steps: cycling (PCR amplification), followed by the endpoint detection of fluorescent signals. Allelic discrimination was achieved by selective annealing using TaqMan MGB probes (Applied Biosystems Inc.). Results were interpreted as homozy- gotes or heterozygotes [22].
Statistical analysis
The SigmaStat software version 3.5 (Systat Software Inc., San Jose, CA USA) was used for analysis. Comparisons were exe- cuted using the t test and one-way analysis of variance when the data were normally distributed; otherwise, the Mann-Whitney
Table 1. The Selected Ghrelin and Growth Hormone Secretagogue Receptor SNPs: Chromosome, Band, and Locus and Polymorphism Type and Class
SNP CHR Cytogenic band CHR locus Gene site SNP type
rs2075356 CT (+3056 TC) 3 3p25.3b 10328809 Intron Transition substitution
rs696217 GT (Leu72Met) 3 3p25.3b 10331457 Intron Transversion substitution
rs27647 CT (–604 GA) 3 3p25.3b 10332468 Intron Transition substitution
rs3755777 CG (–1500 CG) 3 3p25.3b 10333364 Intron Transversion substitution
rs509030 GC 3 3q26.31 6693674 Unknown Transversion substitution
SNP, single-nucleotide polymorphism; CHR, chromosome.
rank sum test and Kruskal-Wallis one-way analysis of variance on ranks were used. Rates and proportions were compared us- ing the chi-square test. P values <0.05 were considered to indi- cate statistical significance.
Hardy-Weinberg equilibrium values were calculated using an online calculator, OEGE (Online Encyclopedia for Genetic Epi- demiology studies, http://www.oege.org/software/hwe-mr-calc.
shtml), for the examined SNPs (the cut-off point for the proba- bility of a population being in Hardy-Weinberg equilibrium was a chi-square value ≥3.841). The linkage equilibrium calcula- tions and the identification of the haplotypes were done using the Haploview 4.2 program (Broad Institute, Cambridge, MA, USA).
Ethical approval
All procedures performed in studies involving human partici- pants were conducted in accordance with the ethical standards of the relevant Institutional and National Research Committees and with the 1964 Helsinki Declaration and its later amend- ments.
RESULTS
The frequency of GHRL and GHSR polymorphisms in T2DM patients and non-diabetic subjects
Alleles and genotypes
As shown in Table 2, the minor allele frequency (MAF) of the examined GHRL (rs696217, rs2075356, rs27647, and rs- 3755777) and GHSR (rs509030) intronic SNPs were not signifi- cantly different between subjects with and without T2DM (P=0.682, P=0.573, P=0.860, P=0.613, and P=0.825, respec- tively). Similarly, the distributions of the genotypes of the five
examined SNPs were comparable between the study groups (P=0.237, P=0.987, P=0.879, P=0.505, and P=0.889, respec- tively).
Table 2. Hardy-Weinberg Equilibrium, MAF, and Prevalence of Rare Genotypes of the Ghrelin and Growth Hormone Secretagogue Re- ceptor SNPs among T2DM and Non-diabetic Subjects
SNP
Subjects HWE, X2
(all subjects)
MAF (chi-square test) Rare genotype prevalence, % (no./total no.)
Healthy T2DM P value Healthy T2DM P valuea
rs2075356 CT 0.56 0.096 (18/188) 0.114 (21/184) 0.682 0.00 (0/94) 3.3 (3/92) 0.237
rs696217 TG 0.85 0.036 (7/192) 0.054 (10/186) 0.573 0 (0/96) 1.08 (1/93) 0.987
rs27647 CT 1.48 0.355 (66/186) 0.34 (62/182) 0.860 14.0 (13/93) 14.3 (13/91) 0.879
rs3755777 GC 3.72 0.181 (34/188) 0.156 (29/186) 0.613 6.4 (6/94) 3.2 (3/93) 0.505
rs509030 GC 2.36 0.300 (51/170) 0.317 (57/180) 0.825 11.8 (10/85) 12.2 (11/90) 0.889
MAF, minor allele frequency; SNP, single-nucleotide polymorphism; T2DM, type 2 diabetes mellitus; HWE, Hardy-Weinberg equilibrium.
aChi-square test.
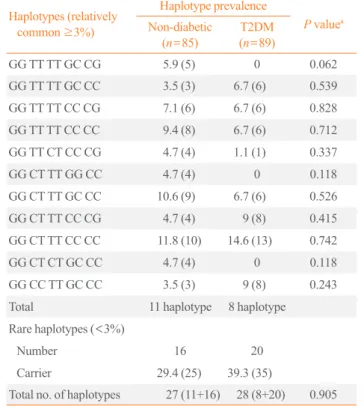
Table 3. The Prevalence of Ghrelin and Growth Hormone Secre- tagogue Receptor SNPs Haplotypes in T2DM and Non-diabetic Subjects
Haplotypes (relatively common ≥3%)
Haplotype prevalence
P valuea Non-diabetic
(n=85) T2DM
(n=89)
GG TT TT GC CG 5.9 (5) 0 0.062
GG TT TT GC CC 3.5 (3) 6.7 (6) 0.539
GG TT TT CC CG 7.1 (6) 6.7 (6) 0.828
GG TT TT CC CC 9.4 (8) 6.7 (6) 0.712
GG TT CT CC CG 4.7 (4) 1.1 (1) 0.337
GG CT TT GG CC 4.7 (4) 0 0.118
GG CT TT GC CC 10.6 (9) 6.7 (6) 0.526
GG CT TT CC CG 4.7 (4) 9 (8) 0.415
GG CT TT CC CC 11.8 (10) 14.6 (13) 0.742
GG CT CT GC CC 4.7 (4) 0 0.118
GG CC TT GC CC 3.5 (3) 9 (8) 0.243
Total 11 haplotype 8 haplotype
Rare haplotypes (<3%)
Number 16 20
Carrier 29.4 (25) 39.3 (35)
Total no. of haplotypes 27 (11+16) 28 (8+20) 0.905 Values are expressed as percentage (number). Total number of shared haplotypes (n=17).
SNP, single-nucleotide polymorphism; T2DM, type 2 diabetes mellitus.
aChi-square test.
Haplotypes
A total of 38 haplotypes were identified; 17 were found in both study groups, 10 were found only in the non-diabetic group, and 11 were found only in T2DM subjects. However, the propor- tions of the unique haplotypes were too small (each <3%) to be included in the comparisons. In contrast, the prevalence rates of the relatively more common haplotypes (≥3% in at least one study group) were compared between the two study groups and were found to be quite similar (Table 3).
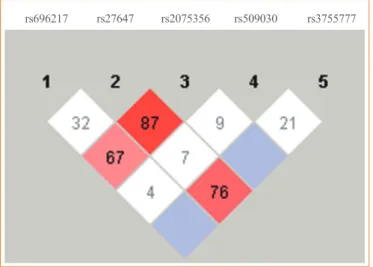
Linkage disequilibrium between the study SNPs
As shown in Fig. 1, there was a strong linkage between rs27647 and rs2075356 (D’=87), and between rs27647 and rs3755777 (D’=76). There was also a linkage between rs696217 and rs2075356 (D’=67). Indeed, the smallest D’ values were those of rs509030 with the other SNPs, since this SNP is found in a different locus on chromosome 3 (3q25).
Associations of the GHRL and GHSR SNPs with HbA1c For testing the associations of the GHRL and GHSR SNPs with HbA1c levels (as a countable marker of long-term blood glu- cose levels), all study subjects, regardless of whether they had T2DM, were analyzed together (Table 4). Among all study sub- jects, the HbA1c level was not significantly different between the carriers and non-carriers of the minor alleles of any of the five examined GHRL (rs2075356, rs696217, rs27647, and rs3755777) and GHSR (rs509030) SNPs (P=0.484, P=0.941, P=0.853, P=
0.207, and P=0.488, respectively). Moreover, the genotypes (rare [minor] and common homozygous, and heterozygous) of the car- riers of these SNPs had comparable HbA1c levels (P=0.539, P=not valid, P=0.784, P=0.202, and P=0.430, respectively).
Associations of the GHRL and GHSR SNPs with IR (HOMA index)
In all study subjects, the HOMA index, as a countable marker of IR, was not significantly different between the carriers and non- carriers of minor alleles of the GHRL (rs2075356, rs696217, rs27647, and rs3755777) and GHSR (rs509030) SNPs (P=
0.132, P=0.517, P=0.165, P=0.434, and P=0.519, respective- ly). Furthermore, the HOMA index was comparable between Table 4. Associations of Ghrelin and Growth Hormone Secretagogue Receptor Polymorphisms with HbA1c: Comparisons between Car- riers and Non-Carriers of Minor Alleles and Rare Genotypes of the Examined SNPs
SNP (all study subjects)
HbA1c, %
Allele carrier Genotype carrier
Minor Non-minor P valuea Rare
homozygous Heterozygous Common
homozygous P valueb rs2075356 CT (3, 33, 150)c 6.00 (5.50–7.00) 6.05 (5.50–8.10) 0.484 6.20 (6.05–7.78) 5.80 (5.48–7.00) 6.05 (5.50–8.10) 0.539
rs696217 TG (1, 15, 173) 5.7 (5.5–8.0) 6.0 (5.5–8.0) 0.941 - - - -
rs27647 CT (26, 76, 82) 6.15 (5.40–8.00) 6.0 (5.5–7.9) 0.853 6.25 (5.7–8.30) 5.95 (5.40–7.95) 6.0 (5.50–7.90) 0.784 rs3755777 GC (9, 45, 133) 5.90 (5.20–7.90) 6.20 (5.60–8.03) 0.207 5.40 (4.78–7.93) 6.00 (5.43–7.80) 6.20 (5.60–8.03) 0.202 rs509030 GC (21, 66, 88) 6.00 (5.5–7.75) 6.20 (5.50–8.10) 0.488 6.20 (5.58–8.80) 6.00 (5.50–7.30) 6.20 (5.50–8.10) 0.431 Values are expressed as median (interquartile range).
HbA1c, hemoglobin A1c; SNP, single-nucleotide polymorphism.
aMann-Whitney rank sum test; bKruskal-Wallis 1-way analysis of variance on ranks; cThe numbers of carriers of rare homozygous, heterozygous, and common homozygous genotypes, respectively, for each SNP.
Fig. 1. Linkage disequilibrium analyses of ghrelin single-nucleotide polymorphisms (SNPs; rs2075356, rs696217, rs27647, rs3755777) and a growth hormone secretagogue receptor (GHSR) SNP (rs509030 GC). The strength of the linkage is indicated by the value of D’, and the maximum value (absolute linkage) is 100%. The GHSR SNP had the least linkage with the other ghrelin SNPs.
rs696217 rs27647 rs2075356 rs509030 rs3755777
the carriers of the rare (minor) and common homozygous, and heterozygous genotypes of the same SNPs (P=0.319, P=not valid, P=0.369, P=0.345, and P=0.386, respectively) (Table 5).
Associations of the GHRL and GHSR SNPs with plasma GHRL levels
In all study subjects, the plasma GHRL peptide levels (pmol/L) were not significantly different between the carriers and non- carriers of the minor alleles of the GHRL (rs2075356, rs696217, rs27647, and rs3755777) and GHSR (rs509030) SNPs (P=0.192, P=0.182, P=0.762, P=0.345, and P=0.808, respectively).
Similarly, plasma GHRL levels were comparable between the
GHRL and GHSR genotypes’ carriers (rare and common homo- zygous, and heterozygous) of the tested SNPs (P=0.425, P=not valid, P=0.640, P=0.477, and P=0.971, respectively) (Table 6).
DISCUSSION
The exact mechanism of IR has not been precisely identified;
however, clinical and laboratory correlates of IR have been re- ported [6,23,24]. In a recent study, we demonstrated that IR and related markers were associated with low GHRL levels [10], as shown in other studies [4,11-13]. In this study, we found no as- sociations between Leu72Met or other intronic GHRL/GHSR
Table 5. Associations of Ghrelin and Growth Hormone Secretagogue Receptor Polymorphisms with Insulin Resistance (HOMA): Com- parisons between Carriers and Non-Carriers of Minor Alleles and between the Genotypes of the Carriers of the Examined SNPs
SNP (all study subjects)
HOMA index
Minor allele Genotype carriers
Carriers Non-carrier P valuea Rare
homozygous Heterozygous Common
homozygous P valueb rs2075356 CT (3, 33, 150)c 1.70 (1.25–2.75) 2.10 (1.50–3.50) 0.132 1.40 (1.33–5.30) 1.70 (1.18–2.73) 2.1 (1.50–3.50) 0.319
rs696217 TG (1, 15, 173) 2.4 (1.6–4.2) 2.0 (1.4–3.4) 0.517 - - - -
rs27647 CT (26, 76, 82) 2.2 (1.50–3.60) 1.80 (1.30–3.00) 0.165 2.25 (1.6–3.1) 2.15 (1.4–4.15) 1.8 (1.3–3.0) 0.369 rs3755777 GC (9, 45, 133) 2.00 (1.20–3.10) 2.10 (1.50–3.50) 0.434 1.60 (1.10–2.50) 2.20 (1.20–3.65) 2.10 (1.50–3.50) 0.345 rs509030 GC (21, 66, 88) 2.00 (1.50–3.28) 2.25 (1.40–3.60) 0.519 1.60 (1.38–2.08) 2.10 (1.50–3.40) 2.25 (1.40–3.60) 0.386 Values are expressed as median (interquartile range).
HOMA, homeostatic model assessment; SNP, single-nucleotide polymorphism.
aMann-Whitney rank sum test; bKruskal-Wallis 1-way analysis of variance on ranks; cThe numbers of carriers of the rare homozygous, heterozygous, and common homozygous genotypes, respectively, for each SNP.
Table 6. Associations of Ghrelin and Growth Hormone Secretagogue Receptor Polymorphisms with Plasma Ghrelin Levels: Compari- sons between Carriers and Non-Carriers of Minor Alleles and between the Genotypes of the Carriers of the Examined SNPs
SNP (all study subjects)
Ghrelin levels, pmol/L
Minor allele Genotype carrier
Carrier Non-carrier P valuea Rare
homozygous Heterozygous Common
homozygous P valueb rs2075356 CT (3, 27, 127)c 16.0 (14.2–21.4) 14.8 (10.2–21.4) 0.192 15.7 (14.8–19.1) 16.3 (14.0–22.5) 14.8 (10.2–21.4) 0.425
rs696217 TG (1, 13, 145) 17.2 (14.2–22.0) 15.13 (10.9–20.9) 0.182 - - - -
rs27647 CT (23, 60, 72) 14.8 (10.7–22.0) 15.7 (12.2–21.1) 0.762 16.9 (9.9–23.6) 14.8 (11.7–19.0) 15.7 (12.2–21.1) 0.640 rs3755777 GC (6, 41, 110) 15.1 (10.8–19.3) 15.3 (11.6–22.3) 0.345 12.6 (8.0–19.3) 15.1 (12.0–19.7) 15.3 (11.6–22.3) 0.477 rs509030 GC (17, 57, 78) 15.1 (11.0–20.8) 15.1 (11.6–21.4) 0.808 14.2 (9.4–21.5) 15.4 (12.1–20.1) 15.1 (11.6–21.4) 0.791 Values are expressed as median (interquartile range).
SNP, single-nucleotide polymorphism.
aMann-Whitney rank sum test; bKruskal-Wallis 1-way analysis of variance on ranks; cThe numbers of carriers of the rare homozygous, heterozygous, and common homozygous genotypes, respectively, for each SNP.
polymorphisms with T2DM, IR, or GHRL levels among Saudi subjects.
We examined four SNPs (rs696217 [Leu72Met], rs2075356, rs27647, and rs3755777) in the GHRL gene and one in the GHSR gene (rs509030). All these polymorphisms are intronic in location, although the location of the rs509030 SNP is not pre- cisely known. The selected SNPs were analyzed in samples that were previously used to document the associations of plasma GHRL levels with T2DM and IR. One of the aims of this study was to investigate whether the reported influence of GHRL in this population was affected by intronic SNPs of the GHRL gene, namely Leu72Met, and whether these SNPs were predic- tive of plasma GHRL levels. In several studies in different pop- ulations, the Leu72Met polymorphism was shown to be associ- ated with T2DM, IR, and/or plasma GHRL levels [14-18]. In this study, none of the five SNPs was associated with these dis- orders or plasma GHRL.
Our findings are not unexpected, as there is no consensus that the examined SNPs are associated with T2DM or IR. The best example is Leu72Met, which has been thoroughly investigated before. The Leu72Met polymorphism was shown to be associ- ated with T2DM [14,15], IR [16,17], and plasma GHRL levels [16,18], and it was also found to be associated with diabetes-re- lated disorders, such as MetS [15,25], obesity [26], hyperten- sion [14], and nephropathy [27]. Moreover, this SNP has been associated with diabetes-unrelated disorders, such as cancer [28], and bulimia nervosa purging type (BN-P) [29]. In contrast, several other studies showed that the Leu72Met polymorphism was not associated with T2DM [18,30-32], IR [14], or GHRL levels [4,33]. This SNP (Leu72Met) that has been widely tested across various nations had a MAF of only 0.04 in our study, which is more comparable to that found in Chinese (0.03) and notably different from the value found in Caucasians (0.25) and Japanese (0.20), as shown in the ABI HapMap data.
Another commonly examined GHRL SNP (rs27647) was not associated with T2DM, IR, or plasma GHRL levels in this study. However, in other studies, it was found to be associated with plasma GHRL levels [16], IR [16,34], hypertension [14,35], and cancer [36]. In contrast, another study showed no association between this SNP and IR [14]. The lack of any pre- viously reported associations of this SNP (rs27647) with T2DM was either because it was not tested for T2DM or because it was tested, but did not show a significant association, and thus was not reported. The rs27647 MAF among our study population (0.35) was similar to that of Caucasians (0.34, HapMap), and extremely different from that observed in African (0.140) and
Japanese (0.11) subjects.
The remaining two GHRL SNPs, rs2075356 and rs3755777, have been less commonly examined than the previous two; in this study, neither was found to be associated with T2DM, IR, or GHRL plasma levels. However, these two SNPs have been found to be associated with obesity [26]. Further, the rs2075356 polymorphism was also found to be associated with T2DM [14], BN-P [29], and cancer [37], while the rs3755777 polymorphism was not found to be associated with T2DM [38]. In this study, the MAFs of rs2075356 (0.10) and rs3755777 (0.17) were clos- er to the values observed among Caucasians (0.10 and 0.24, re- spectively), and notably different from the values observed among African-Americans (0.01 and 0.46, respectively) and Japanese (0.30 and 0.42, respectively).
In contrast, GHSR polymorphisms have been investigated less often. In this study, we tested the rs509030 GC polymor- phism. This SNP has rarely been tested, and we found only one peer-reviewed published article on this SNP in PubMed [39]. In our study, the rs509030 GC polymorphism had the least amount of linkage with the other SNPs (Fig. 1), which might indicate that it is not located on chromosome 3. Furthermore, it was not associated with T2DM or IR, and it did not predict plasma GHRL levels. However, the rs509030 GC polymorphism was found to be associated with MetS and dyslipidemia [39]. Al- though the MAF of this SNP was 0.31, which is relatively high compared to the other tested SNPs in this study (Table 2), there were no MAF data available for this SNP online.
Of the 38 identified GHRL/GHSR haplotypes, the prevalence of 11 common haplotypes, as well as the remaining haplotypes, were comparable between the T2DM and non-T2DM subjects.
A large number of haplotypes indicates the genetic diversity of the preproghrelin gene, although this diversity does not affect the structure or function of GHRL (comparable between study subjects) or the protein expression (plasma GHRL levels) of this gene. However, more polymorphisms need to be investigated and/or identified in order to explain the significant differences observed in GHRL levels between T2DM subjects with and without IR and non-diabetic subjects. Furthermore, none of the alleles/genotypes of the tested SNPs were associated with the most important measurable parameter of T2DM, HbA1c (Table 4), or with that of IR, the HOMA index (Table 5).
Finally, it remains necessary to find an explanation for the in- consistent associations between the GHRL/GHSR polymor- phisms, especially the Leu72Met polymorphism, and T2DM and IR. A recent meta-analysis study of the Leu72Met polymor- phism and T2DM used six case-control studies (a total of 3,417
cases and 3,081 controls), and demonstrated that no association was present between the Leu72Met polymorphism and T2DM in the overall population or in Asians. However, in subgroup analyses stratified by ethnicity, they found that the risk for T2DM was decreased in subjects with Met72+ genotypes in Caucasians [40]. Indeed, the differences between the studies’
subjects, whether genetic (ethnicity), due to environmental fac- tors, or even the way the study subjects were selected, could in part explain the controversies in the literature.
In conclusion, this study documented an important negative finding: the lack of an association of T2DM in Saudis with Leu- 72Met, the most investigated GHRL SNP, which was previously found to be associated with T2DM and IR in some populations but not the others. It also affirmed the role of ethnicity in the in- terpretation of SNP association studies, and investigated a rarely analyzed GHSR SNP, rs509030 GC; however, this SNP and oth- er GHRL intronic SNPs (rs2075356, rs27647, and rs3755777) were likewise not associated with T2DM, IR, or plasma GHRL, while their haplotypes indicated great genetic variability. The limitations of this study include the small sample size and the limited number of tested SNPs. Thus, a further analysis of more GHRL-related SNPs with a larger sample size is needed to ex- plain the difference in the plasma GHRL peptide levels seen in our study subjects.
CONFLICTS OF INTEREST
No potential conflict of interest relevant to this article was re- ported.
ACKNOWLEDGMENTS
We acknowledge the contributions of our study subjects, both diabetic and healthy volunteers. We are also grateful for the cli- nicians from the National Guard Health Affairs, Primary Health Care, and the departmental staff in King Abdulaziz National Guard Hospital, Al-Ahsa, KSA, who assisted in data collection and biochemical analysis. We must extend our acknowledge- ments to Mrs. Lamees J Habieb and Mr. Abdullah J Hassan at Salmaniya Medical Complex (SMC), Kingdom of Bahrain, for their technical assistance. Finally, we are indebted to our study sponsors from Arabian Gulf University, Bahrain (AGU, grant 74-2011), King Abdullah International Medical Research Cen- ter, Saudi Arabia (grant number, IRBC-112-11), and WHO/
EMRO (grant number TSA 200303689).
ORCID
Hayder A. Giha https://orcid.org/0000-0001-6343-1949
REFERENCES
1. Kojima M, Hosoda H, Date Y, Nakazato M, Matsuo H, Kangawa K. Ghrelin is a growth-hormone-releasing acylat- ed peptide from stomach. Nature 1999;402:656-60.
2. Tschop M, Smiley DL, Heiman ML. Ghrelin induces adi- posity in rodents. Nature 2000;407:908-13.
3. Lopez M, Lage R, Saha AK, Perez-Tilve D, Vazquez MJ, Varela L, et al. Hypothalamic fatty acid metabolism medi- ates the orexigenic action of ghrelin. Cell Metab 2008;7:
389-99.
4. Poykko SM, Kellokoski E, Horkko S, Kauma H, Kesaniemi YA, Ukkola O. Low plasma ghrelin is associated with insu- lin resistance, hypertension, and the prevalence of type 2 di- abetes. Diabetes 2003;52:2546-53.
5. Leite-Moreira AF, Soares JB. Physiological, pathological and potential therapeutic roles of ghrelin. Drug Discov To- day 2007;12:276-88.
6. Grundy SM. Atherogenic dyslipidemia associated with met- abolic syndrome and insulin resistance. Clin Cornerstone 2006;8 Suppl 1:S21-7.
7. Grundy SM. Metabolic syndrome: connecting and reconcil- ing cardiovascular and diabetes worlds. J Am Coll Cardiol 2006;47:1093-100.
8. Wajnrajch MP, Ten IS, Gertner JM, Leibel RL. Genomic or- ganization of the human GHRELIN gene. J Endocr Genet 2000;1:231-3.
9. Davenport AP, Bonner TI, Foord SM, Harmar AJ, Neubig RR, Pin JP, et al. International Union of Pharmacology. LVI.
Ghrelin receptor nomenclature, distribution, and function.
Pharmacol Rev 2005;57:541-6.
10. Al Qarni AA, Joatar FE, Das N, Awad M, Eltayeb M, Al- Zubair AG, et al. Association of plasma ghrelin levels with insulin resistance in type 2 diabetes mellitus among Saudi subjects. Endocrinol Metab (Seoul) 2017;32:230-40.
11. Dezaki K, Sone H, Yada T. Ghrelin is a physiological regu- lator of insulin release in pancreatic islets and glucose ho- meostasis. Pharmacol Ther 2008;118:239-49.
12. Yada T, Dezaki K, Sone H, Koizumi M, Damdindorj B, Na- kata M, et al. Ghrelin regulates insulin release and glycemia:
physiological role and therapeutic potential. Curr Diabetes Rev 2008;4:18-23.
13. Pacifico L, Poggiogalle E, Costantino F, Anania C, Ferraro F, Chiarelli F, et al. Acylated and nonacylated ghrelin levels and their associations with insulin resistance in obese and normal weight children with metabolic syndrome. Eur J En- docrinol 2009;161:861-70.
14. Mager U, Kolehmainen M, Lindstrom J, Eriksson JG, Valle TT, Hamalainen H, et al. Association between ghrelin gene variations and blood pressure in subjects with impaired glu- cose tolerance. Am J Hypertens 2006;19:920-6.
15. Takezawa J, Yamada K, Morita A, Aiba N, Watanabe S. Pre- proghrelin gene polymorphisms in obese Japanese: associa- tion with diabetes mellitus in men and with metabolic syn- drome parameters in women. Obes Res Clin Pract 2009;3:
179-91.
16. Zavarella S, Petrone A, Zampetti S, Gueorguiev M, Spoleti- ni M, Mein CA, et al. A new variation in the promoter re- gion, the -604 C>T, and the Leu72Met polymorphism of the ghrelin gene are associated with protection to insulin re- sistance. Int J Obes (Lond) 2008;32:663-8.
17. Liu J, Liu J, Tian LM, Liu JX, Bing YJ, Zhang JP, et al. As- sociation of ghrelin Leu72Met polymorphism with type 2 di- abetes mellitus in Chinese population. Gene 2012;504:309- 12.
18. Hedayatizadeh-Omran A, Rafiei A, Khajavi R, Alizadeh- Navaei R, Mokhberi V, Moradzadeh K. Association between ghrelin gene (Leu72Met) polymorphism and ghrelin serum level with coronary artery diseases. DNA Cell Biol 2014;33:
95-101.
19. Alberti KG, Zimmet PZ. Definition, diagnosis and classifi- cation of diabetes mellitus and its complications. Part 1: di- agnosis and classification of diabetes mellitus provisional report of a WHO consultation. Diabet Med 1998;15:539-53.
20. Matthews DR, Hosker JP, Rudenski AS, Naylor BA,
Treacher DF, Turner RC. Homeostasis model assessment:
insulin resistance and beta-cell function from fasting plasma glucose and insulin concentrations in man. Diabetologia 1985;28:412-9.
21. Prudom C, Liu J, Patrie J, Gaylinn BD, Foster-Schubert KE, Cummings DE, et al. Comparison of competitive radioim- munoassays and two-site sandwich assays for the measure- ment and interpretation of plasma ghrelin levels. J Clin En- docrinol Metab 2010;95:2351-8.
22. Finan RR, Mustafa FE, Al-Zaman I, Madan S, Issa AA, Al- mawi WY. STAT3 polymorphisms linked with idiopathic re- current miscarriages. Am J Reprod Immunol 2010;63:22-7.
23. Weyer C, Bogardus C, Mott DM, Pratley RE. The natural
history of insulin secretory dysfunction and insulin resis- tance in the pathogenesis of type 2 diabetes mellitus. J Clin Invest 1999;104:787-94.
24. Ma ZA, Zhao Z, Turk J. Mitochondrial dysfunction and β-cell failure in type 2 diabetes mellitus. Exp Diabetes Res 2012;2012:703538.
25. Steinle NI, Pollin TI, O’Connell JR, Mitchell BD, Shuldiner AR. Variants in the ghrelin gene are associated with meta- bolic syndrome in the Old Order Amish. J Clin Endocrinol Metab 2005;90:6672-7.
26. Takezawa J, Yamada K, Miyachi M, Morita A, Aiba N, Sa- saki S, et al. Preproghrelin gene polymorphisms in obese Japanese women. Minor homozygotes are light eaters, do not prefer protein or fat, and apparently have a poor appetite.
Appetite 2013;63:105-11.
27. Zhuang L, Li M, Yu C, Li C, Zhao M, Lu M, et al. The Leu- 72Met polymorphism of the GHRL gene prevents the devel- opment of diabetic nephropathy in Chinese patients with type 2 diabetes mellitus. Mol Cell Biochem 2014;387:19-25.
28. Wu IC, Zhao Y, Zhai R, Liu G, Ter-Minassian M, Asoman- ing K, et al. Association between polymorphisms in cancer- related genes and early onset of esophageal adenocarcino- ma. Neoplasia 2011;13:386-92.
29. Ando T, Komaki G, Naruo T, Okabe K, Takii M, Kawai K, et al. Possible role of preproghrelin gene polymorphisms in susceptibility to bulimia nervosa. Am J Med Genet B Neu- ropsychiatr Genet 2006;141B:929-34.
30. Larsen LH, Gjesing AP, Sorensen TI, Hamid YH, Echwald SM, Toubro S, et al. Mutation analysis of the preproghrelin gene: no association with obesity and type 2 diabetes. Clin Biochem 2005;38:420-4.
31. Kim SY, Jo DS, Hwang PH, Park JH, Park SK, Yi HK, et al.
Preproghrelin Leu72Met polymorphism is not associated with type 2 diabetes mellitus. Metabolism 2006;55:366-70.
32. Garcia EA, King P, Sidhu K, Ohgusu H, Walley A, Lecoeur C, et al. The role of ghrelin and ghrelin-receptor gene vari- ants and promoter activity in type 2 diabetes. Eur J Endocri- nol 2009;161:307-15.
33. Zou CC, Huang K, Liang L, Zhao ZY. Polymorphisms of the ghrelin/obestatin gene and ghrelin levels in Chinese children with short stature. Clin Endocrinol (Oxf) 2008;69:99-104.
34. Gueorguiev M, Lecoeur C, Meyre D, Benzinou M, Mein CA, Hinney A, et al. Association studies on ghrelin and ghrelin receptor gene polymorphisms with obesity. Obesity (Silver Spring) 2009;17:745-54.
35. Berthold HK, Giannakidou E, Krone W, Tregouet DA, Gou-
ni-Berthold I. Influence of ghrelin gene polymorphisms on hypertension and atherosclerotic disease. Hypertens Res 2010;33:155-60.
36. Campa D, Pardini B, Naccarati A, Vodickova L, Novotny J, Steinke V, et al. Polymorphisms of genes coding for ghrelin and its receptor in relation to colorectal cancer risk: a two-step gene-wide case-control study. BMC Gastroenterol 2010;
10:112.
37. Pabalan NA, Seim I, Jarjanazi H, Chopin LK. Associations between ghrelin and ghrelin receptor polymorphisms and cancer in Caucasian populations: a meta-analysis. BMC Gen- et 2014;15:118.
38. Choi HJ, Cho YM, Moon MK, Choi HH, Shin HD, Jang
HC, et al. Polymorphisms in the ghrelin gene are associated with serum high-density lipoprotein cholesterol level and not with type 2 diabetes mellitus in Koreans. J Clin Endocri- nol Metab 2006;91:4657-63.
39. Li WJ, Zhen YS, Sun K, Xue H, Song XD, Wang YB, et al.
Ghrelin receptor gene polymorphisms are associated with female metabolic syndrome in Chinese population. Chin Med J (Engl) 2008;121:1666-9.
40. Liao N, Xie ZK, Huang J, Xie ZF. Association between the ghrelin Leu72Met polymorphism and type 2 diabetes risk: a meta-analysis. Gene 2013;517:179-83.