Endocrinol Metab 2015;30:352-360
http://dx.doi.org/10.3803/EnM.2015.30.3.352 pISSN 2093-596X · eISSN 2093-5978
Original Article
Factors Associated with Glycemic Variability in Patients with Type 2 Diabetes: Focus on Oral Hypoglycemic Agents and Cardiovascular Risk Factors
Soyeon Yoo1, Sang-Ouk Chin1, Sang-Ah Lee1,2, Gwanpyo Koh1,2
1Department of Internal Medicine, Jeju National University Hospital, Jeju; 2Department of Internal Medicine, Jeju National University School of Medicine, Jeju, Korea
Background: The role of glycemic variability (GV) in development of cardiovascular diseases remains controversial, and factors that determine glucose fluctuation in patients with diabetes are unknown. We investigated relationships between GV indices, kinds of oral hypoglycemic agents (OHAs), and cardiovascular risk factors in patients with type 2 diabetes mellitus (T2DM).
Methods: We analyzed 209 patients with T2DM. The GV index (standard deviation [SD] and mean absolute glucose change [MAG]) were calculated from 7-point self-monitoring of blood glucose profiles. The patients were classified into four groups ac- cording to whether they take OHAs known as GV-lowering (A) and GV-increasing (B): 1 (A only), 2 (neither), 3 (both A and B), and 4 (B only). The 10-year risk for atherosclerotic cardiovascular disease (ASCVD) was calculated using the Pooled Cohort Equations.
Results: GV indices were significantly higher in patients taking sulfonylureas (SUs), but lower in those taking dipeptidyl pepti- dase-4 inhibitors. In hierarchical regression analysis, the use of SUs remained independent correlates of the SD (β=0.209, P=0.009) and MAG (β=0.214, P=0.011). In four OHA groups, GV indices increased progressively from group 1 to group 4.
However, these did not differ according to quartiles of 10-year ASCVD risk.
Conclusion: GV indices correlated significantly with the use of OHAs, particularly SU, and differed significantly according to combination of OHAs. However, cardiovascular risk factors and 10-year ASCVD risk were not related to GV indices. These find- ings suggest that GV is largely determined by properties of OHAs and not to cardiovascular complications in patients with T2DM.
Keywords: Diabetes mellitus, type 2; Glycemic variability; Cardiovascular risk factors; Oral hypoglycemic agents; 10-year ath- erosclerotic cardiovascular disease risk
INTRODUCTION
It is assumed that hyperglycemia contributes to chronic compli- cations of diabetes by inducing oxidative stress [1]. Previous studies have shown that intensive glycemic control reduces the
rate of microvascular complications in type 1 and type 2 diabe- tes [2,3]. Glycated hemoglobin (HbA1c) is a marker of chronic hyperglycemia and is a strong predictor of complications of dia- betes [4]. However, patients with similar HbA1c values can have markedly different glucose profiles and complications of
Received: 3 March 2015, Revised: 27 April 2015, Accepted: 11 June 2015 Corresponding author: Gwanpyo Koh
Department of Internal Medicine, Jeju National University School of Medicine, 15 Aran 13-gil, Jeju 63241, Korea
Tel: +82-64-754-8163, Fax: +82-64-717-1131, E-mail: [email protected]
Copyright © 2015 Korean Endocrine Society
This is an Open Access article distributed under the terms of the Creative Com- mons Attribution Non-Commercial License (http://creativecommons.org/
licenses/by-nc/3.0/) which permits unrestricted non-commercial use, distribu- tion, and reproduction in any medium, provided the original work is properly cited.
pISSN 2093-596X · eISSN 2093-5978
diabetes. Numerous in vitro studies have shown that not only chronic hyperglycemia but also acute glycemic excursions in- duce oxidative stress and contribute to endothelial dysfunction [5,6]. Such findings have raised concerns about the effects of glucose fluctuation on complications of diabetes. Glycemic variability (GV) refers to the swing in blood glucose concentra- tion from peaks to nadirs. Although there are several indices, there is no “gold standard” for quantifying GV. The standard deviation (SD) is the most commonly used method to assess GV. The mean absolute glucose change (MAG) is the mean ab- solute change in glucose concentration per unit of time [7] and shows a stronger association with intensive care unit mortality than does SD.
Factors that might contribute to GV include decreased endog- enous insulin secretion, deficiency in the relevant suppression of glucagon, and use of hypoglycemic agents. There are many oral hypoglycemic agents (OHAs) used in the treatment of dia- betes, but each has different effects on GV. Small intervention studies have reported that the OHAs affecting predominantly postprandial hyperglycemia including α-glucosidase inhibitors (AGIs) and dipeptidyl peptidase-4 inhibitors (DPP4is) decrease GV [8,9]. Sulfonylureas (SUs) are effective in lowering both fasting and postprandial glucose levels. The use of SUs is posi- tively and independently associated with GV measured as the mean amplitude of glycemic excursion (MAGE) [10].
There is controversy about the role of GV in the development of cardiovascular diseases. In addition, there have been few studies to identify the factors that affect GV in patients with type 2 diabetes. Postprandial hyperglycemia, a component of GV, has been proposed as an independent risk factor for cardiovascular disease [11,12]. In the Study to Prevent Non-Insulin-Dependent Diabetes Mellitus (STOP-NIDDM) study [13], the use of acar- bose, an AGI-targeting postprandial hyperglycemic agent, pre- vented the development of cardiovascular disease in subjects with impaired glucose. However, the primary outcome of that study was the development of diabetes, not cardiovascular dis- ease. There were also only small differences in postprandial glu- cose levels. In 2010, the Nateglinide and Valsartan in Impaired Glucose Tolerance Outcomes Research (NAVIGATOR) trial [14] showed negative results in this regard, in which the use of nateglinide, a short-acting SU analog, did not reduce cardiovas- cular outcomes in subjects with impaired glucose tolerance.
The aims of the study were to assess whether OHAs and car- diovascular risk factors were associated with indices of GV and to identify other factors that contributed to GV in patients with type 2 diabetes.
METHODS
Subjects
The Division of Endocrinology and Metabolism, Jeju National University Hospital, had been providing free-of-charge glu- cometer and test strips for outpatients with diabetes. The pa- tients were encouraged to record a 7-point self-monitoring of blood glucose (SMBG) profile (preprandial/2-hour postprandi- al at each meal and at bedtime) once monthly. We reviewed the medical records of 209 patients who visited Jeju National Uni- versity Hospital from August 2009 through October 2011 who met the following criteria: (1) 20 to 80 years of age; (2) patients with type 2 diabetes who did not use insulin; (3) patients who had no history of cardiovascular disease; (4) patients who per- formed a 7-point SMBG once a month for 4 consecutive months; (5) patients who did not change the type or dose of OHAs within the 2 months before the 4 consecutive months;
and (6) patients who underwent HbA1c testing in month 4 of blood glucose monitoring. Patients were excluded if they were taking steroids or hormones that can influence blood glucose level or if they changed the dose or type of OHAs during the 4 consecutive months of recording the 7-point SMBG. This study was approved by the Institutional Review Board of Jeju Na- tional University Hospital, which waived the need for informed consent because of the retrospective nature of this study.
Methods
We chose SD and MAG as the indices of GV. The glycemic in- dices were calculated using the 7-point SMBG data checked once monthly for 4 consecutive months (Fig. 1). The SD was calculated as the arithmetic SD, and the MAG was the mean of the absolute change in glucose concentration per hour [7]. We calculated the means of the 4-monthly SD and MAG for each subject and used the means for data analysis. HbA1c levels measured in month 4 were retrieved from medical records (Fig.
1). The treatment regimen of diabetes, use of statin, duration of diabetes in years, body mass index, waist circumference (WC), blood pressures, fasting C-peptide and high-sensitivity C-reac-
Fig. 1. Diagram of schedule for 7-point self-monitoring of blood glucose (SMBG) and glycated hemoglobin (HbA1c) measure- ments.
7-Point SMBG
1st mo
7-Point SMBG
2nd mo
7-Point SMBG
3rd mo
HbA1c 7-Point SMBG
4th mo
tive protein (hsCRP) concentrations, estimated glomerular fil- tration rate, urine albumin:creatinine ratio (UACR), ankle-bra- chial pressure index (ABI), and concentrations of uric acid, total cholesterol, triglyceride (TG), high density lipoprotein choles- terol (HDL-C), and low density lipoprotein cholesterol (LDL-C) were assessed. The frequency of hypoglycemia was defined as the number of blood glucose measurements ≤3.9 mmol/L on the 7-point SMBG recorded once a month for the 4 consecutive months. The 10-year risk for atherosclerotic cardiovascular dis- ease (ASCVD) was calculated using the Pooled Cohort Equa- tions [15].
We classified each patient’s treatment regimen of diabetes into four categories according to the ability of OHAs to affect GV. Because DPP4is, glucagon-like peptide 1 (GLP-1) recep- tor agonists, AGIs, and glinides improve GV [8,9,16,17], we classified these OHAs as GV-lowering medication. SUs were classified as GV-increasing medications [10]. There have been no studies conducted to determine the effects of metformin and thiazolidinedione (TZD) on GV. In this study, no patients were treated with GLP-1 receptor agonists or glinides. Therefore, only the uses of DPP4is, AGIs, and SUs were considered for the OHA grouping. Group 1 included those patients using only GV-lowering medications (DPP4is/AGIs). Group 2 included patients using medications that did not influence GV (OHAs other than DPP4is, AGIs and SUs). Group 3 included those us- ing both GV-decreasing and -increasing medications (DPP4is/
AGIs and SUs). Group 4 included those using only GV-in- creasing medication (SUs).
Statistical analysis
All data are presented as the mean±standard error, unless men- tioned otherwise. Pearson correlations were performed to evalu- ate the simple relationships between the indices of GV and clin- ical and laboratory variables. Student t test was used to analyze the differences in GV indices according to the use of individual OHAs. The use of individual OHA was defined as whether or not taking medication regardless of combination therapy. Krus- kal-Wallis test and Mann-Whitney test were performed to com- pare the median value of GV indices according to types of OHA therapy. Hierarchical regression analysis was performed to as- sess the stepwise contribution of OHAs and cardiovascular risk factors to the indices of GV. Model 1 included age, sex, and fac- tors that were significantly related to GV indices in the Pearson correlational analyses (HbA1c, duration of diabetes, frequency of hypoglycemia, and C-peptide level). In model 2, the use of individual OHA was introduced. Finally, in model 3, other
known cardiovascular risk factors (UACR, WC, and concentra- tions of LDL-C and HDL-C, TG, hsCRP, and uric acid) were added. The subjects were classified into four groups according to the OHAs and 10-year risk of ASCVD. Analysis of variance (ANOVA) with a linear trend test was used to compare the mean values of SD and MAG between the four groups. The lev- el of significance was defined as P<0.05. Statistical analyses were performed using SPSS version 18.0 (SPSS Inc., Chicago, IL, USA).
RESULTS
Patients’ characteristics
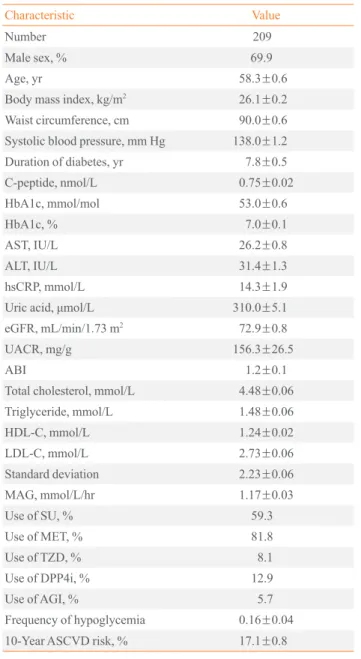
In total, 209 patients with type 2 diabetes who were not receiv- ing insulin therapy were included in this study. Most were obese and middle-aged men. Their diabetes was relatively well con- trolled in terms of blood glucose level, despite the considerable duration of diabetes. Most patients had a high cardiovascular risk according to the 10-year ASCVD risk profile. Many were being treated with metformin or SUs, and a few were treated with DPP4is, TZDs, or AGIs (Table 1).
Univariate and multivariate analyses of the indices of glycemic variability
In the Pearson correlational analysis, HbA1c, duration of diabe- tes, and C-peptide level correlated with both the SD and MAG, and the frequency of hypoglycemia correlated significantly with SD. Known cardiovascular risk factors such as obesity, lipid profile, uric acid level, albuminuria, and ABI did not correlate significantly with the SD or MAG (Table 2).
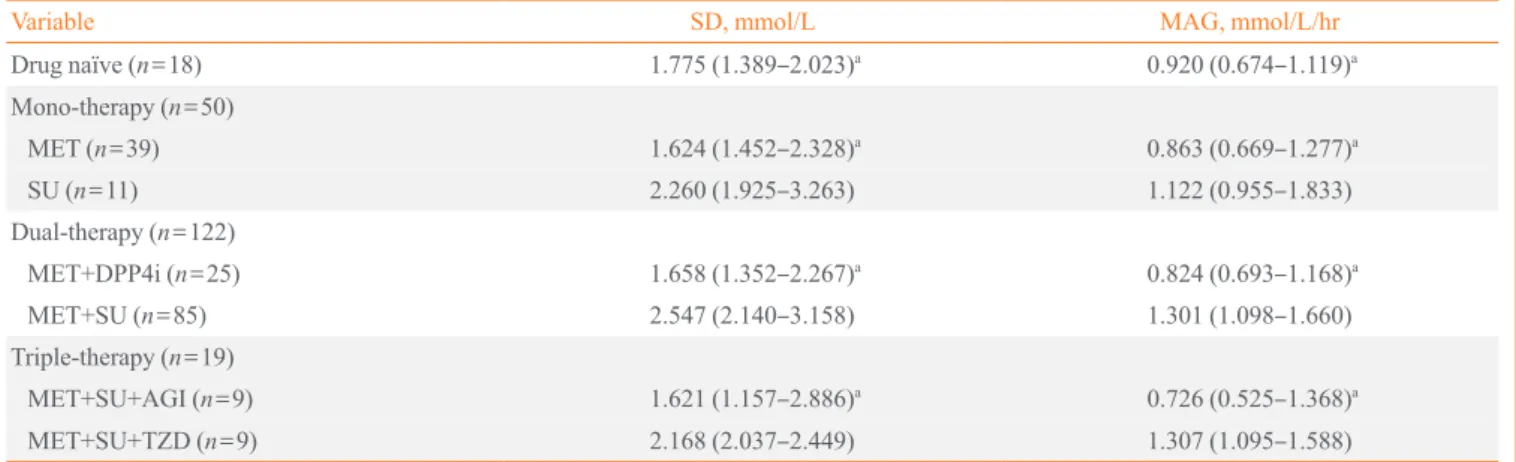
We investigated the differences of GV indices between user and non-user of individual OHAs using Student t tests. Both the SD and MAG were significantly higher in patients taking SUs, but lower in those taking DPP4is. However, the indices of GV were not different with the use of AGI, metformin, or TZD (Fig. 2). In this study, about 70% of patients took more than two OHAs. In patients with dual-therapy, median value of SD and MAG was significantly higher in patient with taking MET plus SU (SD, 2.547 mmol/L [interquartile range (IQR), 2.140 to 3.158]; MAG, 1.301 mmol/L/hr [IQR, 1.098 to 1.660]) than MET plus DPP4i (SD, 1.658 mmol/L [IQR, 1.352 to 2.267];
MAG, 0.824 mmol/L/hr [IQR, 0.693 to 1.168]; P<0.001, re- spectively) (Table 3).
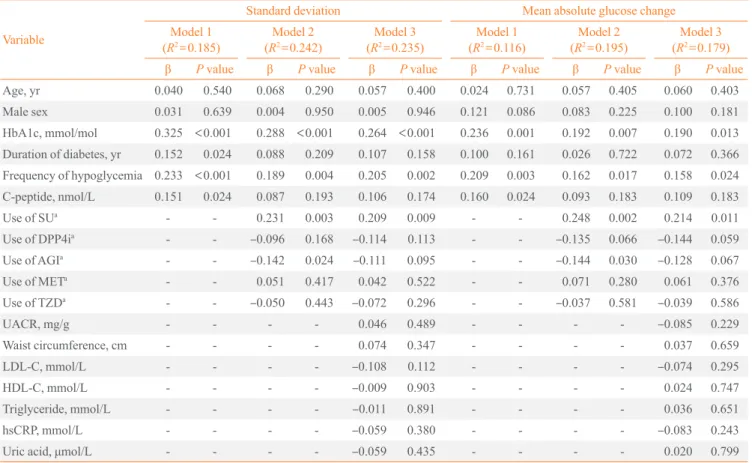
Hierarchical regression analysis was used to adjust for HbA1c, other covariates, OHAs, and cardiovascular risk fac- tors. HbA1c, frequency of hypoglycemia, and C-peptide level
contributed significantly to both the SD and MAG after adjust- ing for age and sex in model 1. The addition of OHAs in- creased the adjusted R2 of model 2 by 5.7% and 7.9% for the SD and MAG, respectively, compared with model 1. In model
2, the use of SUs was a positive predictor and AGIs a negative predictor of the SD and MAG. HbA1c level and the frequency of hypoglycemia significantly contributed to the indices of GV after adjusting for OHAs, but C-peptide level did not contrib- ute. In model 3, added cardiovascular risk factors (albuminuria, waist circumference, and concentrations of LDL-C and HDL- C, triglyceride, hsCRP, and uric acid) did not contribute signifi- cantly to the two GV indices. Rather, the adjusted R2 values of model 3 decreased by 0.7% and 1.6% for the SD and MAG, re- spectively, compared with model 2. The HbA1c level, frequen- cy of hypoglycemia, and the use of SUs remained significant predictors of the SD and MAG in model 3 (Table 4).
Comparison of indices of glycemic variability between the four groups according to OHA usage and 10-year ASCVD risk
We comprehensively analyzed the effects of OHAs and cardio- vascular risk factors on GV. The patients were divided into four groups according to the ability of the OHAs to affect GV (Sup- plemental Table S1). They were also divided into four quartiles Table 1. Patients’ Clinical and Laboratory Characteristics
Characteristic Value
Number 209
Male sex, % 69.9
Age, yr 58.3±0.6
Body mass index, kg/m2 26.1±0.2
Waist circumference, cm 90.0±0.6
Systolic blood pressure, mm Hg 138.0±1.2
Duration of diabetes, yr 7.8±0.5
C-peptide, nmol/L 0.75±0.02
HbA1c, mmol/mol 53.0±0.6
HbA1c, % 7.0±0.1
AST, IU/L 26.2±0.8
ALT, IU/L 31.4±1.3
hsCRP, mmol/L 14.3±1.9
Uric acid, μmol/L 310.0±5.1
eGFR, mL/min/1.73 m2 72.9±0.8
UACR, mg/g 156.3±26.5
ABI 1.2±0.1
Total cholesterol, mmol/L 4.48±0.06
Triglyceride, mmol/L 1.48±0.06
HDL-C, mmol/L 1.24±0.02
LDL-C, mmol/L 2.73±0.06
Standard deviation 2.23±0.06
MAG, mmol/L/hr 1.17±0.03
Use of SU, % 59.3
Use of MET, % 81.8
Use of TZD, % 8.1
Use of DPP4i, % 12.9
Use of AGI, % 5.7
Frequency of hypoglycemia 0.16±0.04
10-Year ASCVD risk, % 17.1±0.8
Values are expressed as mean±standard error.
HbA1c, glycated hemoglobin; AST, aspartate aminotransferase; ALT, alanine aminotransferase; hsCRP, high-sensitivity C-reactive protein;
eGFR, estimated glomerular filtration rate; UACR, urine albumin:
creatinine ratio; ABI, ankle-brachial pressure index; HDL-C, high density lipoprotein cholesterol; LDL-C, low density lipoprotein cho- lesterol; MAG, mean absolute glucose change; SU, sulfonylurea;
MET, metformin; TZD, thiazolidinedione; DPP4i, dipeptidyl pepti- dase-4 inhibitor; AGI, α-glucosidase inhibitor; ASCVD, atheroscle- rotic cardiovascular disease.
Table 2. Pearson’s Correlational Analysis of the Relationships between Indices of Glycemic Variability and Cardiovascular Risk Factors
Variable
Standard
deviation Mean absolute glucose change ra P value ra P value HbA1c, mmol/mol 0.333 <0.001 0.230 <0.001 Duration of diabetes, yr 0.238 <0.001 0.158 0.025 Frequency of hypoglycemia 0.166 0.016 0.137 0.051 C-peptide, nmol/L 0.161 0.020 0.186 0.008
UACR, mg/g 0.123 0.078 –0.030 0.676
Waist circumference, cm 0.078 0.265 0.102 0.149 Body mass index, kg/m2 0.057 0.410 0.050 0.483 Triglyceride, mmol/L 0.098 0.159 0.126 0.074 hsCRP, mmol/L –0.060 0.392 –0.074 0.291 HDL-C, mmol/L –0.041 0.559 –0.064 0.363 LDL-C, mmol/L –0.077 0.266 –0.027 0.699 Uric acid, μmol/L –0.089 0.201 0.008 0.915 eGFR, mL/min/1.73 m2 0.023 0.737 0.000 0.995
ABI 0.025 0.721 0.031 0.664
HbA1c, glycated hemoglobin; UACR, urine albumin:creatinine ratio;
hsCRP, high-sensitivity C-reactive protein; HDL-C, high density lipo- protein cholesterol; LDL-C, low density lipoprotein cholesterol; ABI, ankle-brachial pressure index.
aCorrelation coefficient.
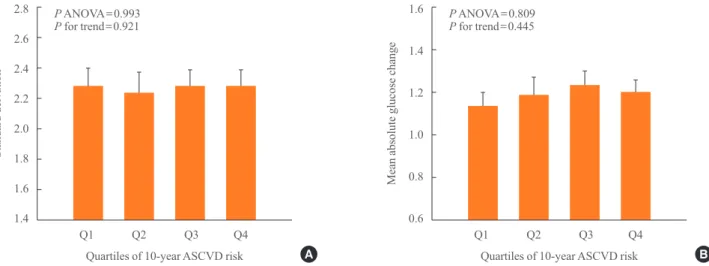
of the 10-year ASCVD risk. The SD and MAG differed signifi- cantly between four groups (P ANOVA <0.001) and increased progressively from group 1 to group 4 (P for trend <0.001) (Fig. 3). By contrast, there was no significant difference in the SD and MAG between quartiles of 10-year ASCVD risk. The two indices also did not tend to change with increasing quar- tiles of 10-year ASCVD risk (Fig. 4).
DISCUSSION
In this study, we investigated the association between GV and cardiovascular risk factors, and we identified the independent contributors to GV. The GV indices were related to the type of
OHAs rather than to cardiovascular risk factors. The use of SUs was independently related, but cardiovascular risk factors were not related to GV. Our findings are consistent with previ- ous studies showing that GV measured as MAGE was not re- lated to risk factors for cardiovascular disease [18] and that the type of OHAs were associated with GV [10].
Of the OHAs included in our analysis, only the use of SUs was finally related to the indices of GV in the multivariate analysis. The use of SUs remained a significant predictor of GV indices even after adjusting for hypoglycemia in the multi- variate analysis. Some previous studies have also reported that the use of SUs increases GV in patients with type 2 diabetes [19,20]. However, β-cell dysfunction might be a confounding
2.8 2.6 2.4 2.2 2.0 1.8 1.6
1.6
1.4
1.2
1.0
0.8
0.6
Standard deivation Mean absolute glucose change
SU DPP4i AGI MET TZD A SU DPP4i AGI MET TZD B
a a Non-user a a Non-user
User User
Fig. 2. Differences in standard deviation (A) and mean absolute glucose change (B) grouped according to the use of individual oral hy- poglycemic agents. SU, sulfonylurea; DPP4i, dipeptidyl peptidase-4 inhibitor; AGI, α-glucosidase inhibitor; MET, metformin; TZD, thi- azolidinedione. aP<0.05 by Student t test.
Table 3. Differences in Glycemic Variability Indices according to the Regimen of Antidiabetic Agents
Variable SD, mmol/L MAG, mmol/L/hr
Drug naïve (n=18) 1.775 (1.389–2.023)a 0.920 (0.674–1.119)a
Mono-therapy (n=50)
MET (n=39) 1.624 (1.452–2.328)a 0.863 (0.669–1.277)a
SU (n=11) 2.260 (1.925–3.263) 1.122 (0.955–1.833)
Dual-therapy (n=122)
MET+DPP4i (n=25) 1.658 (1.352–2.267)a 0.824 (0.693–1.168)a
MET+SU (n=85) 2.547 (2.140–3.158) 1.301 (1.098–1.660)
Triple-therapy (n=19)
MET+SU+AGI (n=9) 1.621 (1.157–2.886)a 0.726 (0.525–1.368)a
MET+SU+TZD (n=9) 2.168 (2.037–2.449) 1.307 (1.095–1.588)
Values are expressed as median (interquartile range).
SD, standard deviation; MAG, mean absolute glucose change; MET, metformin; SU, sulfonylurea; DPP4i, dipeptidyl peptidase-4 inhibitor; AGI, α-glucosidase inhibitor; TZD, thiazolidinedione.
aP<0.05 when compared with MET+SU by Mann-Whitney test.
Table 4. Hierarchical Multiple Regression Analysis between Indices of Glycemic Variability and Other Variables Variable
Standard deviation Mean absolute glucose change
Model 1
(R2=0.185) Model 2
(R2=0.242) Model 3
(R2=0.235) Model 1
(R2=0.116) Model 2
(R2=0.195) Model 3 (R2=0.179)
β P value β P value β P value β P value β P value β P value
Age, yr 0.040 0.540 0.068 0.290 0.057 0.400 0.024 0.731 0.057 0.405 0.060 0.403 Male sex 0.031 0.639 0.004 0.950 0.005 0.946 0.121 0.086 0.083 0.225 0.100 0.181 HbA1c, mmol/mol 0.325 <0.001 0.288 <0.001 0.264 <0.001 0.236 0.001 0.192 0.007 0.190 0.013 Duration of diabetes, yr 0.152 0.024 0.088 0.209 0.107 0.158 0.100 0.161 0.026 0.722 0.072 0.366 Frequency of hypoglycemia 0.233 <0.001 0.189 0.004 0.205 0.002 0.209 0.003 0.162 0.017 0.158 0.024 C-peptide, nmol/L 0.151 0.024 0.087 0.193 0.106 0.174 0.160 0.024 0.093 0.183 0.109 0.183
Use of SUa - - 0.231 0.003 0.209 0.009 - - 0.248 0.002 0.214 0.011
Use of DPP4ia - - –0.096 0.168 –0.114 0.113 - - –0.135 0.066 –0.144 0.059
Use of AGIa - - –0.142 0.024 –0.111 0.095 - - –0.144 0.030 –0.128 0.067
Use of METa - - 0.051 0.417 0.042 0.522 - - 0.071 0.280 0.061 0.376
Use of TZDa - - –0.050 0.443 –0.072 0.296 - - –0.037 0.581 –0.039 0.586
UACR, mg/g - - - - 0.046 0.489 - - - - –0.085 0.229
Waist circumference, cm - - - - 0.074 0.347 - - - - 0.037 0.659
LDL-C, mmol/L - - - - –0.108 0.112 - - - - –0.074 0.295
HDL-C, mmol/L - - - - –0.009 0.903 - - - - 0.024 0.747
Triglyceride, mmol/L - - - - –0.011 0.891 - - - - 0.036 0.651
hsCRP, mmol/L - - - - –0.059 0.380 - - - - –0.083 0.243
Uric acid, μmol/L - - - - –0.059 0.435 - - - - 0.020 0.799
R2, adjusted R squared; β, corrected regression coefficient; HbA1c, glycated hemoglobin; SU, sulfonylurea; DPP4i, dipeptidyl peptidase-4 inhibitor;
AGI, α-glucosidase inhibitor; MET, metformin; TZD, thiazolidinedione; UACR, urine albumin:creatinine ratio; LDL-C, low density lipoprotein cho- lesterol; HDL-C, high density lipoprotein cholesterol; hsCRP, high-sensitivity C-reactive protein.
aThe use of individual oral hypoglycemic agent was defined as whether or not taking the medication regardless of combination therapy.
2.8 2.6 2.4 2.2 2.0 1.8 1.6 1.4
1.6
1.4
1.2
1.0
0.8
0.6
Standard deivation Mean absolute glucose change
G1 G2 G3 G4 G1 G2 G3 G4
Oral hypoglycemic agents A Oral hypoglycemic agents B
P ANOVA <0.001 P ANOVA <0.001
P for trend <0.001 P for trend <0.001
Fig. 3. Differences in standard deviation (A) and mean absolute glucose change (B) according to oral hypoglycemic agent groups. Group 1: dipeptidyl peptidase-4 inhibitor (DPP4i) or α-glucosidase inhibitor (AGI)-use/sulfonylurea (SU)-non-use; group 2: DPP4i or AGI- non-use/SU-non-use; group 3: DPP4i or AGI-use/SU-use; and group 4: DPP4i or AGI-non-use/SU-use. On grouping, the administration of thiazolidinedione and metformin was not considered. ANOVA, analysis of variance.
factor in our multivariate analysis because SUs had been used primarily by patients with diabetes who impaired insulin secre- tion. We included basal C-peptide level in the multivariate analysis to adjust for insulin secretory function. However, the basal C-peptide level did not accurately reflect β-cell function in these patients with type 2 diabetes [21]. Therefore, the post- stimulation C-peptide level should be used in future studies to confirm the contribution of β-cell function to GV.
Users of DPP4is had significantly lower GV indices than nonusers, as shown by the t test. The use of AGIs remained a significant predictor of SD and MAG in model 2 of the step- wise multiple regression. However, in model 3 of the stepwise multivariate analysis, DPP4is and AGIs were no longer predic- tors of GV. Many researchers have reported that DPP4is or AGIs significantly improve GV independently of the HbA1c level in patients with type 2 diabetes [8,9]. Fig. 3 shows that the patients treated with either DPP4is or AGIs had the lowest indices of GV and that group 3 (users of SUs and either DPP4is or AGIs) had lower GV indices than group 4 (only SUs). This finding suggests that the negative effect of SUs on GV may be offset by adding DPP4is or AGIs. Therefore, the results of the multivariate analysis cannot exclude the diminishing effect of DPP4is and AGIs on GV. A larger study will help to clarify the effects of DPP4is and AGIs.
The Hyperglycemia and Its Effect After Acute Myocardial Infarction on Cardiovascular Outcomes in Patients with Type 2 Diabetes Mellitus (HEART2D) trial was a randomized con- trolled trial that compared the effects of prandial versus basal insulin therapy on the risk for subsequent cardiovascular out-
comes after acute myocardial infarction in patients with type 2 diabetes [22]. This trial showed significant differences in post- prandial glucose levels between the two treatment groups. GV measured as MAG was significantly lower in the group treated with prandial insulin than basal insulin [23], but there were no differences in cardiovascular outcomes between the two treat- ment groups. Our finding of no differences in GV between quartiles of the 10-year ASCVD risk is consistent with this re- sult of the HEART2D trial.
Our study had some limitations. First, we used the SMBG system and not a continuous glucose monitoring system (CGMS) to assess GV. The CGMS is preferable for assessing GV because SMBG can miss certain peaks or nadirs in glucose values. The MAGE probably remains the most comprehensive index for assessing GV, and its measurement generally requires CGMS [24]. However, it is difficult to perform CGMS in daily practice because of discomfort, cost, and the need for calibra- tion. Therefore, many indices using SMBG data have been de- veloped. Among them, SD and MAG are easy and widely available indices that can be calculated using SMBG data, and they have been shown to correlate strongly with the different indices of GV using CGMS data [25,26]. Second, the cross- sectional design of this study made it difficult to assess the oc- currence of cardiovascular outcomes. Thus, we used individual cardiovascular risk factors and the estimated 10-year ASCVD risk. We calculated the 10-year ASCVD risk using the Pooled Cohort Equations [15], which are applicable to patients with diabetes, unlike the Framingham Risk Score [27]. Further lon- gitudinal study is needed to investigate the effects of GV on di-
2.8 2.6 2.4 2.2 2.0 1.8 1.6 1.4
1.6
1.4
1.2
1.0
0.8
0.6
Standard deivation Mean absolute glucose change
Q1 Q2 Q3 Q4 Q1 Q2 Q3 Q4
Quartiles of 10-year ASCVD risk A Quartiles of 10-year ASCVD risk B
P ANOVA=0.993 P ANOVA=0.809
P for trend=0.921 P for trend=0.445
Fig. 4. Differences in standard deviation (A) and mean absolute glucose change (B) according to quartiles of 10-year atherosclerotic car- diovascular disease (ASCVD) risk. Quartiles of 10-year ASCVD risk: first quartile range ≤7.9%, second quartile range 8% to 13.9%, third quartile range 14% to 23.9%, and fourth quartile range ≥24%. ANOVA, analysis of variance.
abetic complications. Third, we did not evaluate the effect of insulin use on GV. We excluded insulin-treated patients to pre- clude any with type 1 diabetes. Therefore, our results do not apply to patients with diabetes treated with insulin.
In summary, the indices of GV were significantly related to the uses of OHAs in patients with type 2 diabetes. In particular, the use of SUs positively predicted the indices after adjusting for HbA1c level, hypoglycemia, and other covariates. Cardio- vascular risk factors were not associated with the GV indices.
The GV indices differed significantly between different combi- nations of OHAs. However, the 10-year ASCVD risk was not related to the GV indices. These findings suggest that GV is de- termined largely by the properties of OHAs and not by cardio- vascular complications in patients with type 2 diabetes. We be- lieve that further prospective studies will confirm our findings.
CONFLICTS OF INTEREST
No potential conflict of interest relevant to this article was re- ported.
ACKNOWLEDGMENTS
This work was supported by a research grant from Jeju Nation- al University in 2012. The biospecimens and data used in this study were provided by the Biobank of Jeju University Hospi- tal, a member of Korea Biobank Network.
REFERENCES
1. Brownlee M. Biochemistry and molecular cell biology of diabetic complications. Nature 2001;414:813-20.
2. Ohkubo Y, Kishikawa H, Araki E, Miyata T, Isami S, Mo- toyoshi S, et al. Intensive insulin therapy prevents the pro- gression of diabetic microvascular complications in Japa- nese patients with non-insulin-dependent diabetes mellitus:
a randomized prospective 6-year study. Diabetes Res Clin Pract 1995;28:103-17.
3. UK Prospective Diabetes Study (UKPDS) Group. Intensive blood-glucose control with sulphonylureas or insulin com- pared with conventional treatment and risk of complications in patients with type 2 diabetes (UKPDS 33). Lancet 1998;
352:837-53.
4. Stratton IM, Adler AI, Neil HA, Matthews DR, Manley SE, Cull CA, et al. Association of glycaemia with macrovascular and microvascular complications of type 2 diabetes (UKP-
DS 35): prospective observational study. BMJ 2000;321:
405-12.
5. Quagliaro L, Piconi L, Assaloni R, Martinelli L, Motz E, Ceriello A. Intermittent high glucose enhances apoptosis related to oxidative stress in human umbilical vein endothe- lial cells: the role of protein kinase C and NAD(P)H-oxi- dase activation. Diabetes 2003;52:2795-804.
6. Horvath EM, Benko R, Kiss L, Muranyi M, Pek T, Fekete K, et al. Rapid ‘glycaemic swings’ induce nitrosative stress, ac- tivate poly(ADP-ribose) polymerase and impair endothelial function in a rat model of diabetes mellitus. Diabetologia 2009;52:952-61.
7. Hermanides J, Vriesendorp TM, Bosman RJ, Zandstra DF, Hoekstra JB, Devries JH. Glucose variability is associated with intensive care unit mortality. Crit Care Med 2010;38:
838-42.
8. Wang JS, Lin SD, Lee WJ, Su SL, Lee IT, Tu ST, et al. Ef- fects of acarbose versus glibenclamide on glycemic excur- sion and oxidative stress in type 2 diabetic patients inade- quately controlled by metformin: a 24-week, randomized, open-label, parallel-group comparison. Clin Ther 2011;33:
1932-42.
9. Guerci B, Monnier L, Serusclat P, Petit C, Valensi P, Huet D, et al. Continuous glucose profiles with vildagliptin versus sitagliptin in add-on to metformin: results from the random- ized Optima study. Diabetes Metab 2012;38:359-66.
10. Kohnert KD, Augstein P, Zander E, Heinke P, Peterson K, Freyse EJ, et al. Glycemic variability correlates strongly with postprandial beta-cell dysfunction in a segment of type 2 diabetic patients using oral hypoglycemic agents. Diabe- tes Care 2009;32:1058-62.
11. Ceriello A. Postprandial hyperglycemia and diabetes com- plications: is it time to treat? Diabetes 2005;54:1-7.
12. DECODE Study Group, the European Diabetes Epidemiol- ogy Group. Glucose tolerance and cardiovascular mortality:
comparison of fasting and 2-hour diagnostic criteria. Arch Intern Med 2001;161:397-405.
13. Chiasson JL, Josse RG, Gomis R, Hanefeld M, Karasik A, Laakso M, et al. Acarbose treatment and the risk of cardio- vascular disease and hypertension in patients with impaired glucose tolerance: the STOP-NIDDM trial. JAMA 2003;
290:486-94.
14. NAVIGATOR Study Group, Holman RR, Haffner SM, Mc- Murray JJ, Bethel MA, Holzhauer B, et al. Effect of nateg- linide on the incidence of diabetes and cardiovascular events. N Engl J Med 2010;362:1463-76.
15. Andrus B, Lacaille D. 2013 ACC/AHA guideline on the as- sessment of cardiovascular risk. J Am Coll Cardiol 2014;63 (25 Pt A):2886.
16. Heine RJ, Van Gaal LF, Johns D, Mihm MJ, Widel MH, Brodows RG, et al. Exenatide versus insulin glargine in pa- tients with suboptimally controlled type 2 diabetes: a ran- domized trial. Ann Intern Med 2005;143:559-69.
17. Yamazaki M, Hasegawa G, Majima S, Mitsuhashi K, Fuku- da T, Iwase H, et al. Effect of repaglinide versus glimepiride on daily blood glucose variability and changes in blood in- flammatory and oxidative stress markers. Diabetol Metab Syndr 2014;6:54.
18. Borg R, Kuenen JC, Carstensen B, Zheng H, Nathan DM, Heine RJ, et al. HbA(1)(c) and mean blood glucose show stronger associations with cardiovascular disease risk fac- tors than do postprandial glycaemia or glucose variability in persons with diabetes: the A1C-Derived Average Glucose (ADAG) study. Diabetologia 2011;54:69-72.
19. Jin SM, Kim TH, Bae JC, Hur KY, Lee MS, Lee MK, et al.
Clinical factors associated with absolute and relative mea- sures of glycemic variability determined by continuous glu- cose monitoring: an analysis of 480 subjects. Diabetes Res Clin Pract 2014;104:266-72.
20. Bradescu OM, Ionescu-Tirgoviste C. Correlates of the diur- nal plasma glucose variability in non-insulin-treated type 2 diabetic patients. Proc Rom Acad Ser B 2008;1:53-8.
21. Greenbaum CJ, Mandrup-Poulsen T, McGee PF, Battelino T, Haastert B, Ludvigsson J, et al. Mixed-meal tolerance test versus glucagon stimulation test for the assessment of
beta-cell function in therapeutic trials in type 1 diabetes.
Diabetes Care 2008;31:1966-71.
22. Raz I, Wilson PW, Strojek K, Kowalska I, Bozikov V, Gitt AK, et al. Effects of prandial versus fasting glycemia on cardiovascular outcomes in type 2 diabetes: the HEART2D trial. Diabetes Care 2009;32:381-6.
23. Siegelaar SE, Kerr L, Jacober SJ, Devries JH. A decrease in glucose variability does not reduce cardiovascular event rates in type 2 diabetic patients after acute myocardial in- farction: a reanalysis of the HEART2D study. Diabetes Care 2011;34:855-7.
24. Service FJ, Molnar GD, Rosevear JW, Ackerman E, Gate- wood LC, Taylor WF. Mean amplitude of glycemic excur- sions, a measure of diabetic instability. Diabetes 1970;19:
644-55.
25. Rodbard D. New and improved methods to characterize glycemic variability using continuous glucose monitoring.
Diabetes Technol Ther 2009;11:551-65.
26. Kohnert KD, Heinke P, Fritzsche G, Vogt L, Augstein P, Salzsieder E. Evaluation of the mean absolute glucose change as a measure of glycemic variability using continu- ous glucose monitoring data. Diabetes Technol Ther 2013;
15:448-54.
27. Expert Panel on Detection, Evaluation, and Treatment of High Blood Cholesterol in Adults. Executive summary of the third report of The National Cholesterol Education Pro- gram (NCEP) Expert Panel on Detection, Evaluation, And Treatment of High Blood Cholesterol In Adults (Adult Treatment Panel III). JAMA 2001;285:2486-97.