Copyright © 2018 The Korean Society for Bone and Mineral Research
This is an Open Access article distributed under the terms of the Creative Commons Attribution Non-Commercial Li- cense (http://creativecommons.org/licenses/by-nc/4.0/) which permits unrestricted non-commercial use, distribu- tion, and reproduction in any medium, provided the original work is properly cited.
Track and Field Practice and Bone Outcomes among Adolescents: A Pilot Study (ABCD-Growth Study)
Yuri da Silva Ventura Faustino-da-Silva1,3, Ricardo Ribeiro Agostinete1,2, André Oliveira Werneck1,2, Santiago Maillane-Vanegas1,3, Kyle Robinson Lynch1,2, Isabella Neto Exupério1, Igor Hideki Ito1,2, Romulo Araújo Fernandes1,2,3
1Laboratory of Investigation in Exercise (LIVE), Department of Physical Education, São Paulo State University (UNESP), São Paulo;
2Post-Graduation Program in Movement Sciences, Institute of Biosciences, São Paulo State University (UNESP), São Paulo;
3Post-Graduation Program in Physical Therapy, São Paulo State University (UNESP), São Paulo, Brazil
Background: Osteoporosis is considered a public health problem with high worldwide prevalence. One approach to prevention is through the promotion of physical activity, especially exercise, during adolescence. Methods: This study compared bone variables in different body segments in adolescents according to participation in track and field.
The study included 34 adolescents (22 boys), of whom 17 were track and field athletes and 17 were control subjects. Bone mineral density (BMD, g/cm2) and bone mineral con- tent (BMC, g) were analyzed using dual energy X-ray absorptiometry (total body strati- fied by body segments). Peak height velocity was used to estimate somatic maturation.
Results: Athletes had higher BMD (P=0.003) and BMC (P=0.011) values in the lower limbs and higher whole body BMD (P=0.025) than the control group. However, when adjusted for confounding factors, the difference was not maintained. The groups had similar lean soft tissue values (P=0.094). Training overload was positively correlated with BMD in the upper limbs (r=0.504; 95% confidence interval, 0.031-0.793). Although track and field athletes had higher BMD and BMC values in the lower limbs, these differences were not significant when adjusted for confounding factors. Conclusions: Track and field participation in adolescence appears to influence BMD and BMC in lower limbs, and fat-free mass seems to mediate this effect. Also, higher training loads were found to be positive for bone health in upper limbs.
Key Words: Bone and bones, Bone density, Child, Exercise, Sports
INTRODUCTION
Osteoporosis is a public health issue with high prevalence worldwide. The inci- dence of the disease in 1990 was 1.66 million people with a projection of 6.26 million cases in 2050.[1] In Brazil, it is estimated that 140,000 subjects will have osteoporosis until 2020.[2,3] The disease is an economic burden for the Brazilian National Health System, costing United States Dollar 72 million between 2008 and 2010.[4] Therefore, intervention strategies need to be planned and performed to address the risk factors related to osteoporosis. Regarding this issue, evidence shows that childhood and adolescence are crucial periods of bone formation and Corresponding author
Ricardo Ribeiro Agostinete
Laboratory of Investigation in Exercise (LIVE), Department of Physical Education, São Paulo State University (UNESP), 305 Roberto Simonsen Street, Presidente Prudente, São Paulo State 19060900, Brazil Tel: +55-18-3229-5712 Fax: +55-18-3229-5710
E-mail: [email protected] Received: December 24, 2017 Revised: February 20, 2018 Accepted: February 21, 2018
No potential conflict of interest relevant to this article was reported.
Original Article
pISSN 2287-6375 eISSN 2287-7029
bone accrual during these phases determines bone health in adulthood.[5] During the peak height velocity (PHV), there are several factors influencing bone mineral density (BMD), such as genetics, hormonal levels, and lifestyle hab- its.[6-8]
Physical activity during childhood and adolescence is considered a prevention factor to osteoporosis, given that sports participation promotes BMD accrual and mainte- nance.[9] Moreover, gains in BMD through sports partici- pation during adolescence can persist throughout life.[10, 11] Physical activity has different contexts and sports par- ticipation is the most frequent among youth.[12] The os- teogenic effect of sports participation on bone health oc- curs in two ways: internal (muscle contractions) and exter- nal (impact generated by the practice in the sport).[13] It creates tension in the bone matrix, increasing the concen- tration of formation markers (osteoblasts) in the tissue and, consequently, modifies the skeleton to support the new activity.[13]
The impact of different sports on bone health, such as soccer, basketball, gymnastics, swimming and tennis, is al- ready described in the literature.[9,14-16] However, there are still doubts about track and field, a sport composed of different competitions (races, jumps, throws, and combi- nations).[17] Due to track and field’s mechanical impact, theoretically, it can improve BMD by promoting stress of bone matrix and producing essential growth changes of the bone structure.[18] However, previous studies are not in agreement. Bush [19] found a protective effect of run- ning in BMD among girls, as well as Greene et al.[16], which also showed a protective effect of track and field on BMD.
On the other hand, Lucas et al.[20] found no association between track and field and bone mass. Moreover, most of the studies did not evaluate the effect of sports participa- tion among boys.
Therefore, this study aimed to compare BMD in different body segments among adolescents engaged and not en- gaged in track and field, using a pilot sample of the Analy- sis of Behaviors of Children During Growth (ABCD - Growth Study). Our initial premise states that BMD would be high- er among track and field athletes than in non-active ado- lescents (controls), even after adjustments for potential confounders.
METHODS
The longitudinal research entitled ABCD – Growth Study is an on-going study dedicated to identifying the impact of sports participation on different health aspects of ado- lescents, including bone health. The present study is part of the ABCD – Growth Study, which is being carried out in Presidente Prudente, São Paulo, Brazil. Data collection and analyzes were performed by members of the Laboratory of Investigation in Exercise (LIVE) in 2017, which is part of the Department of Physical Education of the São Paulo State University (UNESP). The ethics committee of UNESP approved the study (process number 1.677.938/2016). All the parents and responsible for the adolescents signed the consent form, and the coaches responsible for the athletes also signed an authorization form.
1. Population
In the present study, we used a pilot sample of ABCD - Growth Study. Thirty-four adolescents of both sexes com- posed the sample (22 boys and 12 girls), 17 track and field adolescents and 17 adolescents in the control group (the sample was paired by age [1 athlete by one control]). Con- trol group was recruited from schools located in the metro- politan region of the city, while athletes were recruited from a track and field training center in the city. The inclu- sion criteria were: (1) 11-18 years-old; (2) parents’ consent form signed; (3) if athletes, at least one year of track and field training experience; if control group, at least one year without practicing any sport or exercise. Adolescents in the track and field group practiced three to six times per week, with two hr of duration per session.
2. Anthropometry and somatic maturation Body weight (kg) was measured using a digital scale (Filizzola PL 150; Filizzola Ltd., São Paulo, Brazil) and height (cm) was measured using a stadiometer with a precision of 0.1 cm. Both measurements were collected using standard protocols. Body mass index (BMI) was estimated using body weight and height. Also, analysis of the sitting height and the length of the legs were performed to calculate the years from PHV, which denotes the time (years) from/to the age at PHV (APHV), an indicator of biological maturation tim- ing.[21] APHV is an important event of the biological mat- uration process, which can influence body composition
and bone variables.
3. Body composition and bone variables
Body composition (body fat [kg], lean mass soft tissue [LST; kg], BMD [g/cm2] and bone mineral content [BMC; g]) of whole body, lower limbs, upper limbs, trunk and column was assessed using a dual energy X-ray absorptiometry (DXA) scanner (Lunar DPX-NT; GE Healthcare, Little Chal- font, Buckinghamshire, UK) with GE Medical System Lunar software (version 4.7). DXA measures were performed in the morning after a light breakfast, and the scanner quality was tested by a trained researcher before each day of mea- surement, following the manufacturer’s recommendations.
The participants wore light clothing, without shoes and re- mained in the supine position on the machine (approxi- mately 15 min).
4. Vitamin D intake
A questionnaire with foods rich in vitamin D commonly observed in Brazilian diet was applied, in which a score of vitamin D intake was generated from the sum of the val- ues.[9]
5. Volume and overload of training
The track and field group reported the number of days per week involved in the sport, as well as the time (min) and intensity (scale of perceived exertion [10]) of each day engaged in practice. The daily overload was calculated by multiplying the intensity by volume.
6. Statistical analysis
Descriptive statistics were used to describe the sample, with values of mean and standard deviation (SD). Student’s Table 1. General characteristics of the adolescents (n=34)
Independent variables Control group (n=17) Track and field (n=17) P-value
Age (year) 16.0±1.13 16.0±1.08 0.967
Weight (kg) 59.6±14.7 67.6±16.5 0.148
Height (cm) 166.4±10.8 175.2±7.9 0.011
Fat mass (%) 25.3±13.6 15.5±7.9 0.018
Lean soft tissue (kg) 42.449±9.499 50.355±16.292 0.094
Years from PHV (year) 0.56±0.92 0.99±0.81 0.162
APHV (year) 15.4±0.99 15.0±0.66 0.164
Weekly training overloada) 3.51±0.15
Bone mineral density (g/cm²)
DXA-upper limbs 0.864±0.151 0.918±0.150 0.299
DXA-left arm 0.862±0.153 0.904±0.148 0.420
DXA-right arm 0.866±0.151 0.933±0.154 0.214
DXA-lower limbs 1.268±0.167 1.458±0.173 0.003
DXA-left leg 1.272±0.171 1.452±0.172 0.004
DXA-right leg 1.263±0.167 1.463±0.176 0.002
DXA-spine 1.121±0.160 1.202±0.140 0.126
DXA-whole body 1.179±0.120 1.283±0.135 0.025
Bone mineral content (g)
DXA-upper limbs 349.3±62.2 402.2±93.8 0.061
DXA-left arm 175.294±32.5 198.482±46.7 0.103
DXA-right arm 174.047±30.0 203.806±47.8 0.037
DXA-lower limbs 1018.4±256.4 1270.8±290.2 0.011
DXA-left leg 513.718±129.6 640.129±143.4 0.011
DXA-right leg 504.688±127.2 630.706±147.2 0.012
DXA-spine 225.7±42.9 241.2±49.2 0.337
DXA-whole body 2739.9±552.0 3132.2±579.3 0.052
The data is presented as mean±standard deviation.
a)Numerical variable under logarithm transformation due to non-parametric distribution.
PHV, peak height velocity; APHV, age at peak height velocity; DXA, dual energy X-ray absorptiometry.
t-test for independent samples was applied for compari- son between groups and analysis of covariance to verify differences in BMD and BMC adjusted by covariates (sex, years from PHV, vitamin D intake and lean soft tissue of body member). Statistical significance was set at P<0.05 and all analyzes were performed using BioEstat version 5.2 (BioEstat, Tefé, Brazil).
RESULTS
Our sample was composed of 34 adolescents (22 boys) with a mean age of 16.0±1.09 years old. Track and field athletes presented higher anthropometric values (Height and fat mass) with significant differences compared to the control group (P=0.01). On the other hand, there was no significant difference for LST, years from PHV, and APHV between athletes and controls. Regarding bone variables, the athletes showed the highest BMD in lower limbs (total [P=0.003] and segmental [P=0.004 in left leg and P=0.002 in right leg]), and whole body (P=0.025) (Table 1).
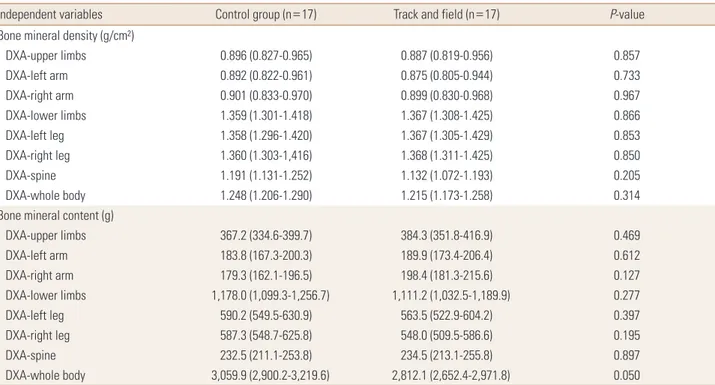
Regarding BMD and BMC, considering the effect of con- founding variables, there were similar characteristics be- tween the control group and the track and field group. How-
ever, years from PHV (P=0.040; effect size eta-squared [ES- r]=0.142) (Table 2) and LST (P=0.01; effect size ES-r=0.487), Table 2 were the factors that most affected bone outcomes and, therefore, presented the highest clinical relevance.
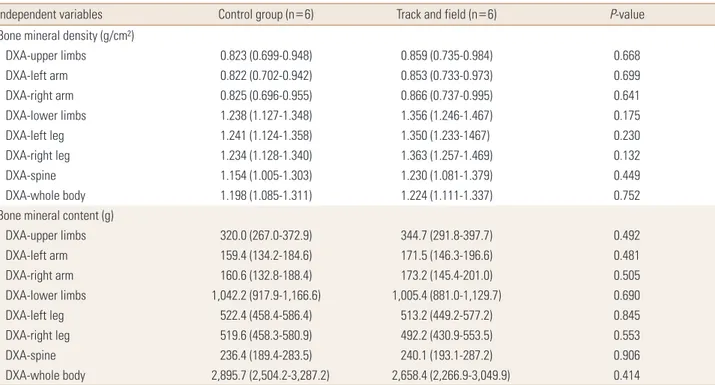
Among girls, BMD and BMC presented similar values com- paring control and the athletes in the adjusted analyses.
Similarly, LST [ES-r=0.340] and years from PHV [ES-r=0.167]
also had high clinical relevance for bone variables (Table 3).
Among boys, BMD and BMC did not differ between athletes and controls, although, after adjustment for LST (P=0.01), it showed a high clinical impact on BMD and BMC [ES-r=
0.498] (Table 4).
Finally, Table 5 shows the relationship between overload and volume of training with BMD and BMC. The track and field group demonstrated a positive relationship between training load and BMD in upper limbs (r=0.504; 95% con- fidence interval, 0.031-0.793).
DISCUSSION
This study aimed to compare bone variables of adoles- cents engaged or not in track and field, as well as to under- stand the effect of training overload/volume on bone health.
Table 2. Comparison of bone variables between groups adjusted by confounding factors (n=34)
Independent variables Control group (n=17) Track and field (n=17) P-value
Bone mineral density (g/cm²)
DXA-upper limbs 0.896 (0.827-0.965) 0.887 (0.819-0.956) 0.857
DXA-left arm 0.892 (0.822-0.961) 0.875 (0.805-0.944) 0.733
DXA-right arm 0.901 (0.833-0.970) 0.899 (0.830-0.968) 0.967
DXA-lower limbs 1.359 (1.301-1.418) 1.367 (1.308-1.425) 0.866
DXA-left leg 1.358 (1.296-1.420) 1.367 (1.305-1.429) 0.853
DXA-right leg 1.360 (1.303-1,416) 1.368 (1.311-1.425) 0.850
DXA-spine 1.191 (1.131-1.252) 1.132 (1.072-1.193) 0.205
DXA-whole body 1.248 (1.206-1.290) 1.215 (1.173-1.258) 0.314
Bone mineral content (g)
DXA-upper limbs 367.2 (334.6-399.7) 384.3 (351.8-416.9) 0.469
DXA-left arm 183.8 (167.3-200.3) 189.9 (173.4-206.4) 0.612
DXA-right arm 179.3 (162.1-196.5) 198.4 (181.3-215.6) 0.127
DXA-lower limbs 1,178.0 (1,099.3-1,256.7) 1,111.2 (1,032.5-1,189.9) 0.277
DXA-left leg 590.2 (549.5-630.9) 563.5 (522.9-604.2) 0.397
DXA-right leg 587.3 (548.7-625.8) 548.0 (509.5-586.6) 0.195
DXA-spine 232.5 (211.1-253.8) 234.5 (213.1-255.8) 0.897
DXA-whole body 3,059.9 (2,900.2-3,219.6) 2,812.1 (2,652.4-2,971.8) 0.050
The data is presented as mean (95% confidence interval). Model adjusted by sex, years from peak height velocity, vitamin D intake and lean soft tissue of body member (except in the DXA-spine that was not adjusted by lean soft tissue).
DXA, dual energy X-ray absorptiometry.
Table 3. Comparison of bone variables between groups adjusted by confounding factors among girls (n=12)
Independent variables Control group (n=6) Track and field (n=6) P-value
Bone mineral density (g/cm²)
DXA-upper limbs 0.823 (0.699-0.948) 0.859 (0.735-0.984) 0.668
DXA-left arm 0.822 (0.702-0.942) 0.853 (0.733-0.973) 0.699
DXA-right arm 0.825 (0.696-0.955) 0.866 (0.737-0.995) 0.641
DXA-lower limbs 1.238 (1.127-1.348) 1.356 (1.246-1.467) 0.175
DXA-left leg 1.241 (1.124-1.358) 1.350 (1.233-1467) 0.230
DXA-right leg 1.234 (1.128-1.340) 1.363 (1.257-1.469) 0.132
DXA-spine 1.154 (1.005-1.303) 1.230 (1.081-1.379) 0.449
DXA-whole body 1.198 (1.085-1.311) 1.224 (1.111-1.337) 0.752
Bone mineral content (g)
DXA-upper limbs 320.0 (267.0-372.9) 344.7 (291.8-397.7) 0.492
DXA-left arm 159.4 (134.2-184.6) 171.5 (146.3-196.6) 0.481
DXA-right arm 160.6 (132.8-188.4) 173.2 (145.4-201.0) 0.505
DXA-lower limbs 1,042.2 (917.9-1,166.6) 1,005.4 (881.0-1,129.7) 0.690
DXA-left leg 522.4 (458.4-586.4) 513.2 (449.2-577.2) 0.845
DXA-right leg 519.6 (458.3-580.9) 492.2 (430.9-553.5) 0.553
DXA-spine 236.4 (189.4-283.5) 240.1 (193.1-287.2) 0.906
DXA-whole body 2,895.7 (2,504.2-3,287.2) 2,658.4 (2,266.9-3,049.9) 0.414
The data is presented as mean (95% confidence interval). Model adjusted by years from peak height velocity, vitamin D intake and lean soft tissue of body segment (except in the DXA-spine that was not adjusted by lean soft tissue).
DXA, dual energy X-ray absorptiometry.
Table 4. Comparison of bone variables between groups adjusted by confounding factors among boys (n=22)
Independent variables Control group (n=11) Track and field (n=11) P-value
Bone mineral density (g/cm²)
DXA-upper limbs 0.928 (0.866-0.991) 0.909 (0.847-0.972) 0.665
DXA-left arm 0.919 (0.855-0.982) 0.897 (0.834-0.961) 0.630
DXA-right arm 0.936 (0.875-1.003) 0.921 (0.857-0.985) 0.693
DXA-lower limbs 1.395 (1.324-1.467) 1.403 (1.331-1.474) 0.888
DXA-left leg 1.393 (1.317-1.469) 1.409 (1.329-1.481) 0.826
DXA-right leg 1.397 (1.327-1.468) 1.402 (1.331-1.472) 0.930
DXA-spine 1.139 (1.082-1.195) 1.152 (1.096-1.209) 0.730
DXA-whole body 1.257 (1.210-1.304) 1.228 (1.182-1.275) 0.418
Bone mineral content (g)
DXA-upper limbs 390.7 (367.5-414.0) 408.1 (384.9-431.3) 0.297
DXA-left arm 194.7 (183.6-205.8) 202.4 (191.2-213.5) 0.332
DXA-right arm 196.1 (183.8-208.4) 205.6 (193.3-217.9) 0.285
DXA-lower limbs 1,216.7 (1,125.3-1,308.2) 1,204.2 (1,112.7-1,295.7) 0.853
DXA-left leg 610.2 (562.0-658.4) 608.0 (559.8-656.2) 0.950
DXA-right leg 606.0 (561.9-650.0) 596.7 (552.6-640.8) 0.779
DXA-spine 229.7 (207.7-251.7) 231.9 (209.9-253.9) 0.888
DXA-whole body 3,091.4 (2,915.1-3,267.8) 2,954.0 (2,777.7-3,130.3) 0.304
The data is presented as mean (95% confidence interval). Model adjusted by years from peak height velocity, vitamin D intake and lean soft tissue of body segment (except in the DXA-spine that was not adjusted by lean soft tissue).
DXA, dual energy X-ray absorptiometry.
Our results showed, in the crude analysis, that athletes pre- sented higher BMD in lower limbs and whole body, and higher BMC in lower limbs and right arm when compared to the control group. However, when considering the ef- fect of sex, maturation, vitamin D intake and LST, the groups presented similar results. LST was the variable with the great- est effect on the outcomes for both sexes, and training over- load was positively related to BMD in upper limbs.
Track and field is a sport that requires intense activity in the lower limbs during its practice, and it is incredibly ef- fective for muscle mass gain. Therefore, higher values of BMD in lower limbs is easily justified by the literature and corroborated by other studies. As proposed by Magkos et al.[22], practice of track and field during adolescence may lead to better bone health in adulthood.
However, the adjusted models showed no effect of track and field practice on bone outcomes, given that fat-free mass (most elevated effect in BMD and BMC) had a bigger effect on these variables. The peak of muscle growth pre- cedes peak of BMD.[23] Therefore, muscle mass increases before bone. However, in the context of sports, one of the justifications for the effect of muscle mass on bone health is related to the mechanical overload of muscle contrac- tion in the bone tissue, favoring greater tissue adaptation.
[24] Track and field is a sport that involves several competi- tions and training methods almost always use muscular strength (snatch, and clean and jerk), working the whole Table 5. Bivariate correlation between sports participation and bone variables among adolescents (only track and field)
Variables
Bivariate correlationa) Training parameters
(overload/week) Training parameters (min/week) BMD (g/cm2)
Upper limbs 0.504 (0.031-0.793) 0.283 (-0.229-0.672) Lower limbs 0.220 (-0.291-0.634) 0.107 (-0.394-0.559) Spine 0.358 (-0.148-0.716) -0.032 (-0.505-0.456) Whole body 0.392 (-0.109-0.734) 0.119 (-0.384-0.567) BMC (g)
Upper limbs 0.311 (-0.199-0.689) 0.221 (-0.291-0.634) Lower limbs 0.362 (-0.144-0.718) 0.299 (-0.212-0.682) Spine 0.461 (-0.025-0.771) 0.016 (-0.468-0.493) Whole body 0.377 (-0.127-0.726) 0.209 (-0.302-0.627) The data is presented as r (95% confidence interval).
a)Numerical variables transformed into logarithm.
BMD, bone mineral density; BMC, bone mineral content.
body.[25] According to a meta-analysis conducted by Beh- ringer et al.[26], strength training, jumps, and running have positive effects on bone health, showing gains of BMD and BMC. Thus, LST should be a possible mediator factor of the association between track and field practice and BMD/BMC.
Although we did not adopt the exact mediation process in our study due to sample size, future research should inves- tigate this topic in a larger population.
Somatic maturation was also identified as a possible me- diator of the association between sports practice, BMD, and BMC. Biological maturation affects all human tissues,[8] in- cluding bone. The peak of BMD and BMC occurs around one year after APHV [27] because bone mineral accrual happens following longitudinal growth. On average, our sample is inside the range mentioned above. Thus, it is nat- ural that adolescents with advanced maturation presented greater BMD.[8] Moreover, it is also expected that sports participation has a higher effect in adolescents with de- layed maturation (yet passing through maturation pro- cess).[5,10] However, maturation should also be tested in future research with greater sample size.
Studies have emphasized that sports participation has provided gains in BMD and BMC.[5,28] Although track and field involve modalities of throwing, requiring a little more of the upper limbs, significant differences were found only in BMC of the right arm. However, when adjusted for con- founding factors, the difference disappears. This result can be explained by the more significant effect of LST on BMC gain, and the difference only in the right arm points out to a possible degree of dominance among the limbs. In con- trast to our findings, Whittington et al.[25] analyzed BMD and BMC of college students compared to a control group and other sports, and found higher BMD and BMC in upper limbs. Thus, in the present study, the positive effect of track and field on lower limbs BMD seems to happen due to the impact exerted by LST.
Additionally, when analyzing the relationship between training overload, BMD, and BMC, we found a positive cor- relation with upper limbs BMD, highlighting the greater effect of practice on BMD.[29] Even among adolescents, an increase in training volume was sufficient to improve tra- becular and cortical densities.[30] However, this association can also be associated with an increase in muscle mass caused by the continued sports participation.
One of the limitations of the present study is the vast
possibilities of engagement in track and field, which in- volves different events, such as jumps, throws, speed races, and endurance races. The characteristics of each of these events may affect bone health differently, and new studies should be conducted comparing different track and field athletes. Although we used a questionnaire to assess vita- min D, which is an accessible and non-invasive method, it was not possible to quantify the sun exposure (mostly re- sponsible for the production of Vitamin D). Possible media- tors also were not investigated, such as serum levels of hor- mones and inflammatory cytokines, variables that can in- fluence bone formation. Finally, a bigger sample size is need- ed for more complex analyses.
In conclusion, track and field participation in adolescence appears to influence BMD and BMC in lower limbs, and fat- free mass seems to mediate this effect. Also, higher train- ing loads were found to be positive for bone health in up- per limbs.
FUNDING
This study was supported by the São Paulo Research Foun- dation-FAPESP (2015/19710-3). RRA received a Grant from the FAPESP (2017/09182-5), SMV received a Grant from the FAPESP (2016/20354-0), KRL received a Grant from the FAPESP (2016/20377-0), and INE received a Grant from the FAPESP (2017/14183-0).
ACKNOWLEDGMENTS
Sao Paulo Research Foundation (FAPESP) and the effort of the participants and their parents and coaches
REFERENCES
1. Cooper C, Campion G, Melton LJ 3rd. Hip fractures in the elderly: a world-wide projection. Osteoporos Int 1992;2:
285-9.
2. Clark P, Cons-Molina F, Deleze M, et al. The prevalence of radiographic vertebral fractures in Latin American coun- tries: the Latin American Vertebral Osteoporosis Study (LAVOS). Osteoporos Int 2009;20:275-82.
3. Komatsu RS, Ramos LR, Szejnfeld VL. Incidence of proxi- mal femur fractures in Marilia, Brazil. J Nutr Health Aging 2004;8:362-7.
4. Moraes LF, Silva EN, Silva DA, et al. Expenditures on the treatment of osteoporosis in the elderly in Brazil (2008- 2010): analysis of associated factors. Rev Bras Epidemiol 2014;17:719-34.
5. Gómez-Bruton A, Matute-Llorente Á, González-Agüero A, et al. Plyometric exercise and bone health in children and adolescents: a systematic review. World J Pediatr 2017;13:
112-21.
6. Campos LM, Liphaus BL, Silva CA, et al. Osteoporosis in childhood and adolescence. J Pediatr (Rio J) 2003;79:481-8.
7. Eisman JA. Genetics of osteoporosis. Endocr Rev 1999;20:
788-804.
8. Malina RM, Bouchard C, Bar-Or O. Growth, maturation, and physical activity. 2nd ed. Champaign, IL: Human Kinetics;
2004.
9. Agostinete RR, Lynch KR, Gobbo LA, et al. Basketball af- fects bone mineral density accrual in boys more than swim- ming and other impact sports: 9-mo follow-up. J Clin Den- sitom 2016;19:375-81.
10. Bielemann RM, Martinez-Mesa J, Gigante DP. Physical ac- tivity during life course and bone mass: a systematic re- view of methods and findings from cohort studies with young adults. BMC Musculoskelet Disord 2013;14:77.
11. Barnekow-Bergkvist M, Hedberg G, Pettersson U, et al. Re- lationships between physical activity and physical capacity in adolescent females and bone mass in adulthood. Scand J Med Sci Sports 2006;16:447-55.
12. Patel DR, Yamasaki A, Brown K. Epidemiology of sports-re- lated musculoskeletal injuries in young athletes in United States. Transl Pediatr 2017;6:160-6.
13. Tenforde AS, Fredericson M. Influence of sports participa- tion on bone health in the young athlete: a review of the literature. Pm r 2011;3:861-7.
14. Ermin K, Owens S, Ford MA, et al. Bone mineral density of adolescent female tennis players and nontennis players. J Osteoporos 2012;2012:423910.
15. Ribeiro-Dos-Santos MR, Lynch KR, Agostinete RR, et al.
Prolonged practice of swimming Is negatively related to bone mineral density gains in adolescents. J Bone Metab 2016;23:149-55.
16. Greene DA, Naughton GA, Bradshaw E, et al. Mechanical loading with or without weight-bearing activity: influence on bone strength index in elite female adolescent athletes engaged in water polo, gymnastics, and track-and-field. J Bone Miner Metab 2012;30:580-7.
17. Coiceiro GA. 1000 Exercícios e jogos para o atletismo. Rio de Janeiro, BR: Sprint; 2008.
18. Andreoli A, Monteleone M, Van Loan M, et al. Effects of different sports on bone density and muscle mass in high- ly trained athletes. Med Sci Sports Exerc 2001;33:507-11.
19. Bush RA. Female high-school varsity athletics: an oppor- tunity to improve bone mineral density. J Sci Med Sport 2009;12:366-70.
20. Lucas JA, Lucas PR, Vogel S, et al. Effect of sub-elite com- petitive running on bone density, body composition and sexual maturity of adolescent females. Osteoporos Int 2003;14:848-56.
21. Mirwald RL, Baxter-Jones AD, Bailey DA, et al. An assess- ment of maturity from anthropometric measurements.
Med Sci Sports Exerc 2002;34:689-94.
22. Magkos F, Yannakoulia M, Kavouras SA, et al. The type and intensity of exercise have independent and additive effects on bone mineral density. Int J Sports Med 2007;28:773-9.
23. Jackowski SA, Faulkner RA, Farthing JP, et al. Peak lean tis- sue mass accrual precedes changes in bone strength indi- ces at the proximal femur during the pubertal growth spurt.
Bone 2009;44:1186-90.
24. Duncan CS, Blimkie CJ, Cowell CT, et al. Bone mineral den- sity in adolescent female athletes: relationship to exercise
type and muscle strength. Med Sci Sports Exerc 2002;34:
286-94.
25. Whittington J, Schoen E, Labounty LL, et al. Bone mineral density and content of collegiate throwers: influence of maximum strength. J Sports Med Phys Fitness 2009;49:
464-73.
26. Behringer M, Gruetzner S, McCourt M, et al. Effects of wei- ght-bearing activities on bone mineral content and densi- ty in children and adolescents: a meta-analysis. J Bone Miner Res 2014;29:467-78.
27. Bailey DA. The saskatchewan pediatric bone mineral ac- crual study: bone mineral acquisition during the growing years. Int J Sports Med 1997;18 Suppl 3:S191-4.
28. Lima F, De Falco V, Baima J, et al. Effect of impact load and active load on bone metabolism and body composition of adolescent athletes. Med Sci Sports Exerc 2001;33:1318- 23.
29. Karlsson MK, Magnusson H, Karlsson C, et al. The duration of exercise as a regulator of bone mass. Bone 2001;28:128- 32.
30. Varley I, Hughes DC, Greeves JP, et al. Increased training volume improves bone density and cortical area in ado- lescent football players. Int J Sports Med 2017;38:341-6.