Copyright © 2017 The Korean Society for Bone and Mineral Research
This is an Open Access article distributed under the terms of the Creative Commons Attribution Non-Commercial Li- cense (http://creativecommons.org/licenses/by-nc/4.0/) which permits unrestricted non-commercial use, distribu- tion, and reproduction in any medium, provided the original work is properly cited.
Association between Hemoglobin Level and Bone Mineral Density in Korean Adults
Yun Hwan Oh1, Ji Hyun Moon1, Belong Cho2,3,4
1Department of Family Medicine, Jeju National University Hospital, Jeju;
2Department of Family Medicine, Center for Health Promotion and Optimal Aging, Seoul National University College of Medicine &
Hospital, Seoul;
3Advanced Institutes of Convergence Technology, Seoul National University, Suwon;
4Institute on Aging, Seoul National University College of Medicine, Seoul, Korea
Background: Low bone mineral density (BMD) increases fracture risk. Anemia is highly prevalent. Some studies suggested that anemia is an independent risk factor for osteo- porosis. The aim of this study was to evaluate the association between hemoglobin (Hb) level and BMD in Korean adults. Methods: This study was based on data from the Korea National Health and Nutrition Examination Survey 2008 to 2011. Propensity score-match- ing was performed to establish a dataset for analysis. Regression analyses were used to evaluate the association between Hb and BMD. Mean BMD scores were compared be- tween normal and anemia groups, and among normal, anemia with low ferritin, and anemia without low ferritin groups. Results: There were partial positive associations be- tween Hb and BMD in men, but negative associations in women. The normal group had lower mean BMD scores than the anemia group in men. However, the anemia group had higher whole-body and lumbar-spine BMD scores than the normal group in wom- en. In a comparison of the three groups, the anemia without low ferritin group had the lowest all-site BMD scores in men and women. However, the anemia with low ferritin group had the highest all-site BMD scores in women. In postmenopausal women, the anemia without low ferritin group had the lowest all-site BMD scores. In premenopausal women, the anemia with low ferritin group had the highest whole-body BMD scores.
Conclusions: This study found that Hb and anemia status were associated with BMD scores. However, the associations were different according to sex. This may be due to the etiology of anemia or low Hb levels.
Key Words: Anemia, Bone density, Hemoglobins
INTRODUCTION
As the populating is aging, the prevalence of osteoporosis and osteopenia as- sociated with an increased risk of fracture are showing increasing trends.[1,2] This is a global health problem, and many previous studies revealed basic metabolic conditions and various risk factors associated with the risk of osteoporosis. Old age, underweight, low physical activity level, educational level, and dyslipidemia are well-known factors associated with the loss of bone mineral density (BMD).[3- 6] In addition, the use of steroids or excessive drinking and smoking is also known to be associated with reduced BMD.[7] Prevention and treatment for targeted Corresponding author
Belong Cho
Department of Family Medicine, Seoul National University Hospital, 101 Daehak-ro, Jongno-gu, Seoul 03080, Korea
Tel: + 82-2-2072-2195 Fax: +82-2-766-3276 E-mail: [email protected] Received: May 15, 2017 Revised: August 1, 2017 Accepted: August 2, 2017
No potential conflict of interest relevant to this article was reported.
Original Article
pISSN 2287-6375 eISSN 2287-7029
people who are expected to have BMD loss due to such risk factors are essential to prevent BMD loss and associat- ed fractures.
Anemia is a common disease. According to the “2011 Na- tional Health Statistics,” the prevalence rates of anemia in men and women aged >10 years were 2.4% and 12.7%, respectively, and the prevalence rate of anemia in men and women aged >70 years were 15.3% and 17.8%, respec- tively. Low hemoglobin (Hb) levels themselves are a health hazard and known as a risk factor of various diseases. Hy- poxia is known to be a risk factor of osteoporosis,[8-10]
and studies have reported a positive correlation between Hb levels and BMD in patients with certain diseases such as sickle cell anemia, chronic obstructive pulmonary dis- ease, inflammatory bowel disease, and chronic kidney dis- ease.[11-14] In addition, a recent study involving older post- menopausal women reported that anemia was an indepen- dent risk factor of low BMD.[15] One hypothesis is based on the hematological etiology of the association between blood loss and BMD loss.[16] Although studies have inves- tigated the association between Hb levels and bone densi- ty in older persons or patients with certain disease,[17,18]
studies that investigated the association between Hb lev- els and bone density in the general population are scarce.
In addition, studies in which BMD was measured using dual energy X-ray absorptiometry (DXA) are limited.
The aim of the present study was to evaluate the associ- ation between Hb levels and BMD in men and women aged
>20 years through various analysis methods, based on data from the fourth and fifth Korea National Health and Nutri- tion Examination Survey (KNHNES).
METHODS
1. SubjectsThe subjects of the present study were selected based on raw data from the fourth and fifth KNHNES (2008-2011).
Of all the subjects, those aged <20 years were excluded and those undergoing DXA for BMD measurement were selected. Of the selected subjects, those who did not have whole-body BMD, femoral neck BMD, lumbar spine BMD scores, or Hb and ferritin levels were excluded. A total of 16,646 subjects were primarily selected, consisting of 7,424 men and 9,222 women. Of these subjects, 1,620 patients who were currently taking osteoporosis drugs or female
hormones were excluded. In addition, 1,899 patients with chronic renal failure, liver cirrhosis, diabetes mellitus, thy- roid disease,[19] rheumatoid arthritis, and all types of can- cer, which are known to affect bone metabolism, were ex- cluded. Therefore, 13,127 subjects (6,412 men and 6,715 women) were finally selected. Marked differences were observed in variables, such as age, body mass index (BMI), drinking frequency, education level, and physical activity level, which could cause a difference in BMD between the normal and anemia groups among the selected subjects.
Therefore, to control this, the propensity score matching (PSM) method was used to establish a dataset to ensure the homogeneity of the subjects prior to the difference verification. Typical methods that use propensity scores in- clude stratification, matching, and inverse probability. In the present study, the technique of matching a delta value to the predictive value, or a logit score to ≤0.0003 was used to homogenously extract the normal and anemia groups in terms of covariance (age, BMI, physical activity, drinking frequency, and educational level) considered in the pres- ent study. Consequently, 1,574 subjects (429 men and 1,145 women), 787 subjects each for the normal and anemia groups, were finally selected for analysis (Fig. 1).
2. Data collection
The demographic variables (age, sex, educational level, and monthly income) and health behavior information (smok- ing, alcohol consumption, and physical activity level) of the subjects were collected through a survey. High-risk drink- ers were defined as men consuming alcohol more than twice per week and ≥7 drinks per drinking occasion, and wom- en consuming ≥5 drinks per drinking occasion. Physical activity level was quantified into metabolic equivalent of task-minute per week and classified into three levels by us- ing the Korean version of the International Physical Activity Questionnaire.[20] Calcium and iron intakes (mg/day) were obtained using the 24-hr recall method.
Height (cm) and body weight (kg) were measured, and BMI was calculated, accordingly. The BMD scores of the subjects were measured using DXA. To evaluate osteopo- rosis and osteopenia, T-scores of ≥−1, >−2.5 but <−1.0, and ≤−2.5 in BMD testing were classified as normal, os- teopenia, and osteoporosis, respectively, according to the World Health Organization (WHO) T-score criteria. In accor- dance with the recommendations of the International So-
ciety for Clinical Densitometry (ISCD), the lowest T-score value among the T-scores at three measurement sites (lum- bar spine, whole femur, and femoral neck) was used as di- agnostic criteria for osteoporosis. In view of the fact that the standard value for the maximum BMD in South Korea has not yet been established yet, it was calculated based on the maximum BMD in Asia (Japan).[21]
Hb (g/dL) and serum ferritin (ng/mL) levels were obtain- ed through blood tests performed during the study period.
Anemia was defined as Hb levels of <13 g/dL for men and
<12 g/dL for women in accordance with the WHO diag- nostic criteria.[22] The baseline iron deficiency status was set at a serum ferritin level of <15 ng/mL for both men and women, and the normal upper limit of serum ferritin levels was defined as 200 ng/mL for men and 150 ng/mL for women.[23]
3. Statistical methodologies
In the present study, the general characteristics of the subjects were presented as mean±standard deviation, and analyses were performed as follows: All analyses were
performed using SPSS 20.0 for Windows (IBM Corp., Armonk, NY, USA). The P-values of all the results reported below were bilateral, and the significance level was set at P<0.05.
First, all the subjects were divided into three groups (nor- mal, anemia with low ferritin group, and anemia without low ferritin groups). To compare the basic demographic characteristics between the groups, the categorical data were presented as a percentage and compared by using the χ2 test, while the continuous data were calculated as mean and standard deviation and compared through an analysis of variance (ANOVA) (Table 1). In addition, the original subjects and the subjects selected using the PSM method were divided into the normal and anemia groups to compare the characteristics of the original dataset with those of the PSM dataset (Table 2). Subsequently, to check the selection convenience problem of the subjects select- ed using the PSM method, the odds ratios (ORs) of the os- teoporotic diseases (osteoporosis or osteopenia) were compared using the total dataset and the dataset applied using the PSM method (Table 3).
Second, a regression analysis was performed to deter- Fig. 1. Flow diagram on selection of dataset. *2008-2011 The Fourth & The Fifth Korean National Health and Nutrition Examination. KNHANES, Korea National Health and Nutrition Examination Survey; DXA, dual energy X-ray absorptionmetry; BMD, bone mineral density.
Total participants in the KNHANES IV, V*
Participants (n=13,127; male=6,412; female=6,175)
Final participants by propensity score matching (n=1,574; male=429; female=1,145; normal=787; anemia=787)
Age under 20
Participants who did not receive DXA
Missing value (hemoglobin, ferritin, whole body/femoral neck/
lumbar spine BMD)
Exclusion criteria
Using medications for osteoporosis or hormone replacement (n=1,620)
Conditions affecting bone metabolism, including chronic renal failure, liver cirrhosis, diabetes mellitus, thyroid disease, rheumatoid arthritis, and all types of cancer (n=1,899) Participants (n=16,646; male=7,424; female=9,222)
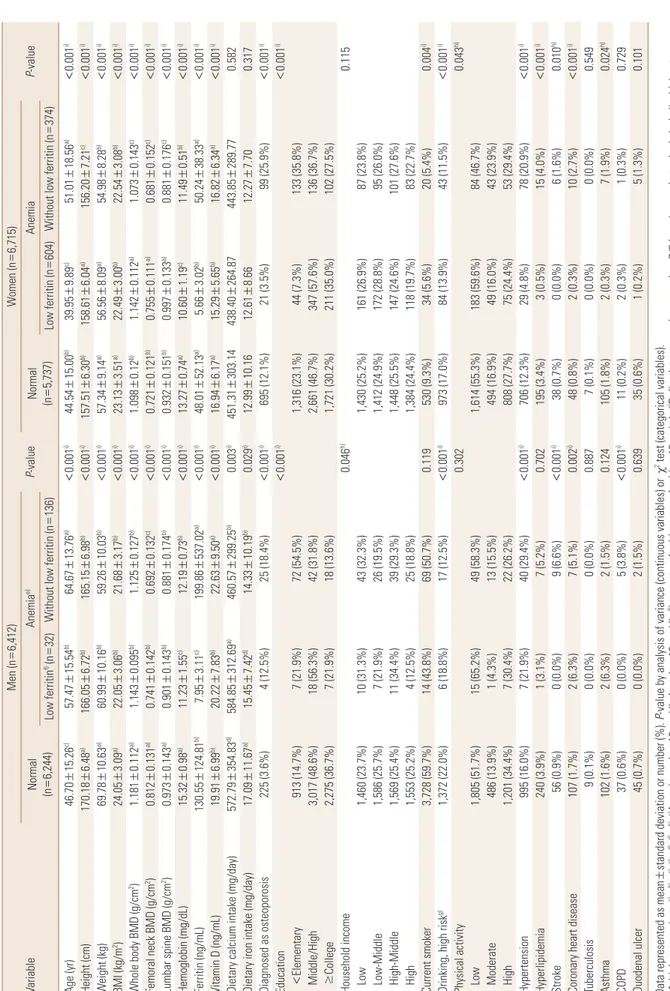
Table 1. Basic characteristic by sex and anemia-ferritin status (including various diseases), total dataset VariableMen (n=6,412) P-valueWomen (n=6,715) P-valueNormal (n=6,244)Anemiae) Normal (n=5,737)Anemia Low ferritinf) (n=32)Without low ferritin (n=136)Low ferritin (n=604)Without low ferritin (n=374) Age (yr)46.70±15.26c)57.47±15.54b)64.67±13.76a)<0.001i)44.54±15.00b)39.95±9.89c)51.01±18.56a)<0.001i) Height (cm)170.18±6.48a)166.05±6.72b)165.15±6.98b)<0.001i)157.51±6.30b)158.61±6.04a)156.20±7.21c)<0.001i) Weight (kg)69.78±10.63a)60.99±10.16b)59.26±10.03b)<0.001i)57.34±9.14a)56.56±8.09a)54.98±8.28b)<0.001i) BMI (kg/m2)24.05±3.09a)22.05±3.06b)21.68±3.17b)<0.001i)23.13±3.51a)22.49±3.00b)22.54±3.08b)<0.001i) Whole body BMD (g/cm2)1.181±0.112a)1.143±0.095b)1.125±0.127b)<0.001i)1.098±0.12b)1.142±0.112a)1.073±0.143c)<0.001i) Femoral neck BMD (g/cm2)0.812±0.131a)0.741±0.142b)0.692±0.132c)<0.001i)0.721±0.121b)0.755±0.111a)0.681±0.152c)<0.001i) Lumbar spine BMD (g/cm2)0.973±0.143a)0.901±0.143b)0.881±0.174b)<0.001i)0.932±0.151b)0.997±0.133a)0.881±0.176c)<0.001i) Hemoglobin (mg/dL)15.32±0.98a)11.23±1.55c)12.19±0.73b)<0.001i)13.27±0.74a)10.60±1.19c)11.49±0.51b)<0.001i) Ferritin (ng/mL)130.55±124.81b)7.95±3.11c)199.86±537.02a)<0.001i)48.01±52.13a)5.66±3.02b)50.24±38.33a)<0.001i) Vitamin D (ng/mL)19.91±6.99b)20.22±7.83b)22.63±9.50a)<0.001i)16.94±6.17a)15.29±5.65b)16.82±6.34a)<0.001i) Dietary calcium intake (mg/day)572.79±354.83d)584.85±312.69a)460.57±299.25b)0.003i)451.31±303.14438.40±264.87443.85±289.770.582 Dietary iron intake (mg/day)17.09±11.67a)15.45±7.42d)14.33±10.19b)0.029i)12.99±10.1612.61±8.6612.27±7.700.317 Diagnosed as osteoporosis225 (3.6%)4 (12.5%)25 (18.4%)<0.001i)695 (12.1%)21 (3.5%)99 (25.9%)<0.001i) Education<0.001i)<0.001i) <Elementary913 (14.7%)7 (21.9%)72 (54.5%)1,316 (23.1%)44 (7.3%)133 (35.8%) Middle/High3,017 (48.6%)18 (56.3%)42 (31.8%)2,661 (46.7%)347 (57.6%)136 (36.7%) ≥College2,275 (36.7%)7 (21.9%)18 (13.6%)1,721 (30.2%)211 (35.0%)102 (27.5%) Household income0.046h)0.115 Low1,460 (23.7%)10 (31.3%)43 (32.3%)1,430 (25.2%)161 (26.9%)87 (23.8%) Low-Middle1,586 (25.7%)7 (21.9%)26 (19.5%)1,412 (24.9%)172 (28.8%)95 (26.0%) High-Middle1,569 (25.4%)11 (34.4%)39 (29.3%)1,448 (25.5%)147 (24.6%)101 (27.6%) High1,553 (25.2%)4 (12.5%)25 (18.8%)1,384 (24.4%)118 (19.7%)83 (22.7%) Current smoker3,728 (59.7%)14 (43.8%)69 (50.7%)0.119530 (9.3%)34 (5.6%)20 (5.4%)0.004i) Drinking, high riskg)1,372 (22.0%)6 (18.8%)17 (12.5%)<0.001i)973 (17.0%)84 (13.9%)43 (11.5%)<0.001i) Physical activity0.3020.043h) Low1,805 (51.7%)15 (65.2%)49 (58.3%)1,614 (55.3%)183 (59.6%)84 (46.7%) Moderate486 (13.9%)1 (4.3%)13 (15.5%)494 (16.9%)49 (16.0%)43 (23.9%) High1,201 (34.4%)7 (30.4%)22 (26.2%)808 (27.7%)75 (24.4%)53 (29.4%) Hypertension995 (16.0%)7 (21.9%)40 (29.4%)<0.001i)706 (12.3%)29 (4.8%)78 (20.9%)<0.001i) Hyperlipidemia240 (3.9%)1 (3.1%)7 (5.2%)0.702195 (3.4%)3 (0.5%)15 (4.0%)<0.001i) Stroke56 (0.9%)0 (0.0%)9 (6.6%)<0.001i)38 (0.7%)0 (0.0%)6 (1.6%)0.010h) Coronary heart disease107 (1.7%)2 (6.3%)7 (5.1%)0.002i)48 (0.8%)2 (0.3%)10 (2.7%)<0.001i) Tuberculosis9 (0.1%)0 (0.0%)0 (0.0%)0.8877 (0.1%)0 (0.0%)0 (0.0%)0.549 Asthma102 (1.6%)2 (6.3%)2 (1.5%)0.124105 (1.8%)2 (0.3%)7 (1.9%)0.024h) COPD37 (0.6%)0 (0.0%)5 (3.8%)<0.001i)11 (0.2%)2 (0.3%)1 (0.3%)0.729 Duodenal ulcer45 (0.7%)0 (0.0%)2 (1.5%)0.63935 (0.6%)1 (0.2%)5 (1.3%)0.101 Data represented as mean±standard deviation or number (%). P-value by analysis of variance (continuous variables) or χ2 test (categorical variables). Multiple comparison: a)>b)>c), a)=d), d)=b). e)Anemia: male<13 mg/dL, female<12 mg/dL. f)Low serum ferritin: serum ferritin<15 ng/mL. g)Defined as consuming more than 7/5 (men/women) standard alcoholic drinks at one time more than twice a week. h)P<0.05. i)P<0.01. BMI, body mass index; BMD, bone mineral density; COPD, chronic obstructive pulmonary disease.
mine the linear relationship between Hb levels and BMD scores at each site (whole body, femoral neck, and lumbar spine) in the subjects selected using the PSM method as the main analysis group. The regression analysis was per- formed after adjusting for variables such as age, BMI, drink- ing frequency, educational level, and physical activity.[24,25]
To examine the effects of age, the BMD at each site was di- vided into three age groups (20-49, 50-59, and 60 years and older) and analyzed. In addition, to examine the effects of menopause in women, the female subjects were divid- ed into a premenopausal group and a postmenopausal group, and their data were analyzed. The variance inflation
factor (VIF) was calculated to check the multicollinearity between the variables included in the multivariate analysis.
Third, the subjects were divided into two groups (the anemia and normal groups) and then into three groups (normal Hb, anemia with low ferritin, and anemia without low ferritin groups) according to Hb and serum ferritin lev- els. The difference in BMD score at each site between the groups was tested. Differences in BMD between the two groups according to the presence or absence of anemia were analyzed using an independent two-samples t-test, and differences in BMD among the three groups according to anemia-ferritin levels were tested using ANOVA. When Table 2. Comparison between total dataset and PSM dataset
Variable Total dataset (n=13,127)
P-value PSM dataset (n=1,574)
P-value Normal (n=11,981) Anemia (n=1,146) Normal (n=787) Anemia (n=787)
Age 45.67±15.17 46.98±16.26 0.005b) 46.25±15.34 46.78±16.16 0.506
BMI 23.61±3.33 22.40±3.06 <0.001b) 22.20±2.35 22.27±2.91 0.604
Drinking, high risk 2,345 (19.6%) 150 (13.1%) <0.001b) 116 (14.7%) 106 (13.5%) 0.107
Physical activity 0.029a) 0.586
Low 3,419 (53.4%) 331 (55.7%) 227 (55.4%) 228 (55.1%)
Moderate 980 (15.3%) 106 (17.8%) 71 (17.3%) 82 (19.8%)
High 2,009 (31.4%) 157 (26.4%) 112 (27.3%) 104 (25.1%)
Education 0.002b) 0.208
Elementary (-) 2,229 (18.7%) 256 (22.5%) 154 (19.6%) 163 (20.7%)
Middle/High 5,678 (47.7%) 543 (47.8%) 358 (45.5%) 382 (48.5%)
College (+) 3,996 (33.6%) 338 (29.7%) 275 (35.0%) 242 (30.7%)
Household income 0.010a) 0.018a)
Low 2,890 (24.4%) 301 (26.7%) 190 (24.3%) 208 (26.8%)
Low-Middle 2,998 (25.3%) 300 (26.6%) 186 (23.8%) 202 (26.0%)
High-Middle 3,017 (25.5%) 298 (26.4%) 200 (25.5%) 214 (27.5%)
High 2,937 (24.8%) 230 (20.4%) 207 (26.4%) 153 (19.7%)
Current smoker 4,258 (35.5%) 137 (12.0%) <0.001b) 209 (26.6%) 91 (11.6%) <0.001b)
Vitamin D 18.49±6.78 16.80±6.91 <0.001b) 18.33±6.98 17.03±7.02 <0.001b)
Dietary calcium intake 511.43±335.27 446.85±279.28 <0.001b) 476.99±284.62 429.33±240.72 <0.001b)
Dietary iron intake 15.02±11.12 12.77±8.54 <0.001b) 13.90±9.52 12.44±7.74 0.001b)
Hypertension 1,701 (14.2%) 154 (13.4%) 0.474 99 (12.6%) 105 (13.3%) 0.653
Hyperlipidemia 435 (3.6%) 26 (2.3%) 0.017a) 22 (2.8%) 16 (2.0%) 0.324
Stroke 94 (0.8%) 15 (1.3%) 0.062 2 (0.3%) 11 (1.4%) 0.012a)
Coronary heart disease 155 (1.3%) 21 (1.8%) 0.129 8 (1.0%) 17 (2.2%) 0.070
Tuberculosis 16 (0.1%) 0 (0.0%) 0.216 2 (0.3%) 0 (0.0%) 0.157
Asthma 207 (1.7%) 13 (1.1%) 0.134 9 (1.1%) 10 (1.3%) 0.817
COPD 48 (0.4%) 8 (0.7%) 0.144 5 (0.6%) 7 (0.9%) 0.578
Duodenal ulcer 80 (0.7%) 8 (0.7%) 0.973 6 (0.8%) 6 (0.8%) 0.852
Data represented as mean±standard deviation or number (%). P-value by independent student t-test (continuous variables) or χ2 test (categorical vari- ables).
a)P<0.05. b)P<0.01.
PSM, propensity score matching; BMI, body mass index; COPD, chronic obstructive pulmonary disease.
differences between the groups were found to be signifi- cant in the analysis of variance, Scheffe’s method was ap- plied as a multiple comparison method.
Data from the KNHNES were obtained using a stratified, multi-staged, clustered, and probability sampling method with a composite sample design to improve the represen- tativeness and accuracy of the samples. Therefore, the pro- cess of assigning weights, stratification variables, and clus- ter variables was included in the analyses in the present study. In addition, in the integration of the data from the KNHNES from 2008 to 2011, which included BMD measure-
ments, integrated weights were calculated and applied in accordance with the “Guidelines for the use of raw data from the KNHNES”.
4. Study ethical considerations
The present study used data from the fourth and fifth KNHNES (2008-2011), which was approved by the institu- tional review board at Korea Centers for Disease Control and Prevention (Approval Nos. 2008-04 EXP-01-C, 2009-01CON- 03-2C, 2010-02CON-21-C, and 2011-02CON-06-C). The data were downloaded from the respective public website. The Table 3. Comparison between total dataset and PSM dataset on logistic regression result (anemia, anemia-ferritin status effect for osteopenia or osteoporosis)
Variable Total dataset PSM dataset
P-value OR (95% CI) P-value OR (95% CI)
Anemia, yes vs. no <0.001b) 0.350 (0.258-0.475) 0.006b) 0.541 (0.350-0.835)
Anemia-ferritin statusc)
Normal vs. with low ferritin 0.191 1.523 (0.810-2.862) 0.923 1.040 (0.468-2.313)
Normal vs. without low ferritin <0.001b) 3.313 (2.341-4.688) 0.002b) 2.109 (1.312-3.389)
Hemoglobin <0.001b) 0.652 (0.621-0.684) <0.001b) 0.754 (0.664-0.856)
Sex, female vs. male <0.001b) 0.243 (0.211-0.280) <0.001b) 0.373 (0.244-0.572)
Age <0.001b) 1.067 (1.059-1.075) <0.001b) 1.080 (1.054-1.106)
Height <0.001b) 0.907 (0.899-0.914) <0.001b) 0.915 (0.889-0.942)
Weight <0.001b) 0.901 (0.894-0.908) <0.001b) 0.886 (0.860-0.913)
BMI <0.001b) 0.842 (0.824-0.861) <0.001b) 0.795 (0.727-0.869)
Education
Elementary vs. middle/high <0.001b) 0.339 (0.295-0.390) <0.001b) 0.260 (0.162-0.417) Elementary vs. college <0.001b) 0.210 (0.172-0.255) <0.001b) 0.216 (0.111-0.421) Household income
Low vs. low-middle 0.208 0.892 (0.746-1.066) 0.681 0.882 (0.484-1.606)
Low vs. high-middle 0.061 0.844 (0.707-1.008) 0.640 0.871 (0.488-1.555)
Low vs. high <0.001b) 0.617 (0.517-0.736) 0.322 0.744 (0.415-1.336)
Smoking
Non-smoker vs. ex-smoker <0.001b) 0.391 (0.329-0.466) 0.755 0.906 (0.488-1.682)
Non-smoker vs. current smoker <0.001b) 0.427 (0.372-0.491) 0.005b) 0.523 (0.332-0.825) Drinking
None vs. moderate <0.001b) 0.362 (0.299-0.439) 0.154 0.697 (0.424-1.145)
None vs. high risk <0.001b) 0.230 (0.180-0.294) 0.121 0.508 (0.216-1.195)
Physical activity
Low vs. moderate 0.603 1.062 (0.847-1.331) 0.983 1.007 (0.504-2.014)
Low vs. high 0.001b) 0.739 (0.614-0.890) 0.519 0.815 (0.438-1.517)
Vitamin D <0.001b) 0.976 (0.968-0.984) 0.345 0.988 (0.963-1.013)
Dietary calcium intake <0.001b) 0.999 (0.999-0.999) 0.011a) 0.999 (0.998-1.000)
Dietary iron intake <0.001b) 0.975 (0.969-0.981) 0.498 0.993 (0.973-1.013)
a)P<0.05. b)P<0.01. c)Anemia-ferritin status was categorized as normal, anemia with low ferritin, and anemia without low ferritin.
PSM, propensity score matching; OR, odds ratio; CI, confidence interval; BMI, body mass index.
present study was conducted in compliance with the ethi- cal standards of the Declaration of Helsinki.
RESULTS
1. General characteristics of the subjects
A total of 13,127 men and women were included in the original dataset before the PSM method was applied, and the baseline information is shown in Table 1. When the subjects were divided into the normal, anemia with low ferritin, and anemia without low ferritin groups, and the characteristics of each group were compared between the groups, the results showed significant differences in most variables between the groups.
The mean age of male subjects was highest at 64.67±
13.76 years in the anemia without low ferritin group, fol- lowed by 57.47±15.54 years in the anemia with low ferri- tin group and 46.70±15.26 years in the normal group. The mean age of the female subjects was highest at 51.01±
18.56 years in the anemia without low ferritin group, fol- lowed by 44.54±15.00 years in the normal group and 39.95
±9.89 years in the anemia with low ferritin group.
In the men, BMI was highest in the normal group (24.05±
3.09 kg/m2), followed by the anemia with low ferritin group (22.05±3.06 kg/m2) and the anemia without low ferritin group (21.68±3.17 kg/m2). Meanwhile, in the women, BMI was highest in the normal group (23.13±3.51 kg/m2), fol- lowed by the anemia with low ferritin group (22.49±3.00 kg/m2) and anemia without low ferritin group (22.54±3.08 kg/m2).
In terms of educational level, the proportion of elemen- tary school graduates or lower in men was highest in the anemia without low ferritin group (54.5%), and this was the same for women (35.8%).
In men, the mean BMD (whole body, femoral neck, and lumbar spine) was highest in the normal group, followed by the anemia with low ferritin and anemia without low ferritin groups. In the women, the mean BMD was highest in the anemia with low ferritin group, followed by the nor- mal and anemia without low ferritin groups.
When comorbid disease status was compared between the groups, the results showed that in the men, the preva- lence rates of hypertension (29.4%), stroke (6.6%), and chron- ic obstructive pulmonary disease (3.8%) were relatively high in the anemia without low ferritin group, which had
the lowest mean BMD among the three groups. In the wom- en, the prevalence rates of hypertension (20.9%), stroke (1.6%), and coronary heart disease (2.7%) were relatively high in the anemia without low ferritin group, which had the lowest mean BMD.
A comparison of the characteristics of the original datas- et with those of the PSM dataset is shown in Table 2. The PSM dataset showed no difference in age, BMI, educational level, drinking frequency, and physical activity, which were selected as covariates between the normal and anemia groups. In addition, with regard to the prevalence of co- morbid diseases, the PSM dataset showed a difference only in the prevalence of stroke between the normal and anemia groups (P=0.012), but showed no significant dif- ferences in the prevalence of hypertension, hyperlipidemia, ischemic heart disease, tuberculosis, asthma, chronic ob- structive pulmonary disease, and duodenal ulcer between the normal and anemia groups.
To check the selection bias of the PSM dataset, logistic regression analysis with the osteopenic bone diseases (os- teoporosis or osteopenia) as dependent variables was per- formed both with the original dataset and PSM data (Table 3). The OR from the anemia group to the normal group in the original dataset was 0.350 (P<0.05), whereas the rele- vant OR in the PSM dataset was 0.541 (P<0.05), which were all statistically significant, and the direction of the ORs was also consistent. This was the same in comparing among the three groups according to the presence or absence of anemia and low ferritin level. The OR from the anemia with low ferritin group to the normal group in the original data- set was 1.523 (P=0.191), whereas the OR in the PSM data- set was 1.040 (P=0.923). The OR from the anemia without low ferritin group to the normal group in the original dataset was 3.313 (P<0.05), while the OR in the PSM dataset was 2.109 (P<0.05), showing the same results in terms of both statistical significance and direction of ORs.
2. Analysis of the linear association between Hb levels and BMD at each site
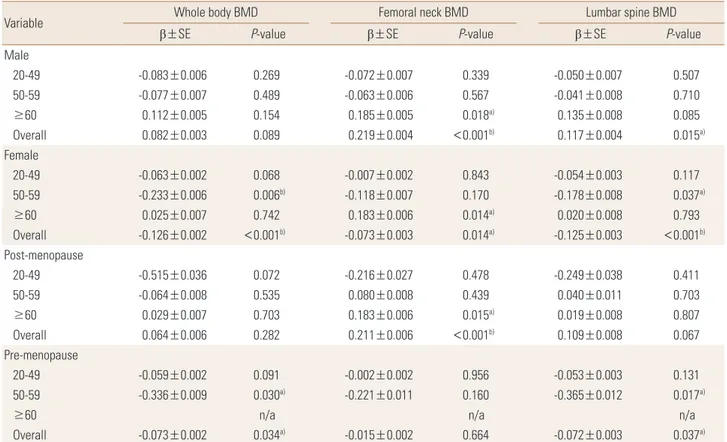
In the analysis of the linear relationship between Hb lev- el and BMD at each site, the result showed significant posi- tive associations between Hb level and femoral neck BMD (β=0.219, P<0.01) and lumbar spine BMD (β=0.117, P=
0.015) for men in all ages but significant negative associa- tions between Hb level and whole-body BMD (β=−0.126,
P<0.01), femoral neck BMD (β=−0.073, P=0.014), and lum- bar spine BMD (β=−0.125, P<0.01) in the women. Howev- er, in the analysis by age group, the results showed a signi- ficant positive association between Hb level and femoral neck BMD (β=0.183, P<0.05) in the men aged ≥60 years, but no statistically significant association between Hb level and BMD at other sites in the other age groups. In the wom- en, significant negative associations were found between
Hb level and whole-body BMD (β=−0.233, P=0.006) and lumbar spine BMD (β=−0.178, P=0.037) in those aged 50 to 59 years, and between Hb level and femoral neck BMD (β=−0.073, P=0.014) in those aged ≥60 years.
In the comparison between premenopausal and meno- pausal women, negative associations were found between Hb level and whole-body BMD (β=−0.073, P=0.034) and lumbar spine BMD (β=−0.072, P=0.037) in the premeno-
Table 4. Regression analysis between hemoglobin level and BMD by sex, age group, and menopausal status
Variable Whole body BMD Femoral neck BMD Lumbar spine BMD
β±SE P-value β±SE P-value β±SE P-value
Male
20-49 -0.083±0.006 0.269 -0.072±0.007 0.339 -0.050±0.007 0.507
50-59 -0.077±0.007 0.489 -0.063±0.006 0.567 -0.041±0.008 0.710
≥60 0.112±0.005 0.154 0.185±0.005 0.018a) 0.135±0.008 0.085
Overall 0.082±0.003 0.089 0.219±0.004 <0.001b) 0.117±0.004 0.015a)
Female
20-49 -0.063±0.002 0.068 -0.007±0.002 0.843 -0.054±0.003 0.117
50-59 -0.233±0.006 0.006b) -0.118±0.007 0.170 -0.178±0.008 0.037a)
≥60 0.025±0.007 0.742 0.183±0.006 0.014a) 0.020±0.008 0.793
Overall -0.126±0.002 <0.001b) -0.073±0.003 0.014a) -0.125±0.003 <0.001b)
Post-menopause
20-49 -0.515±0.036 0.072 -0.216±0.027 0.478 -0.249±0.038 0.411
50-59 -0.064±0.008 0.535 0.080±0.008 0.439 0.040±0.011 0.703
≥60 0.029±0.007 0.703 0.183±0.006 0.015a) 0.019±0.008 0.807
Overall 0.064±0.006 0.282 0.211±0.006 <0.001b) 0.109±0.008 0.067
Pre-menopause
20-49 -0.059±0.002 0.091 -0.002±0.002 0.956 -0.053±0.003 0.131
50-59 -0.336±0.009 0.030a) -0.221±0.011 0.160 -0.365±0.012 0.017a)
≥60 n/a n/a n/a
Overall -0.073±0.002 0.034a) -0.015±0.002 0.664 -0.072±0.003 0.037a)
β and SE were calculated by using linear regression analysis. Adjusted for age, body mass index, education, drinking, physical activity.
a)P<0.05. b)P<0.01.
BMD, bone mineral density; β, β–coefficient; SE, standard error; n/a, not available.
Fig. 2. Bone mineral densities (BMDs) of whole body, femoral neck and lumbar spine by sex.
Normal Anemia 1.4
1.2 1.0 0.8 0.6 0.4 0.2 0 BMD (g/cm2)
Whole body BMD Femoral neck BMD Lumbar spine BMD Male
P<0.01
P<0.01
P<0.01
Normal Anemia 1.4
1.2 1.0 0.8 0.6 0.4 0.2 0 BMD (g/cm2 )
Whole body BMD Femoral neck BMD Lumbar spine BMD Female
P<0.01
P<0.01
pausal women, whereas a positive association was found between Hb level and femoral neck BMD (β=0.211, P<0.01) in the menopausal women (Table 4).
3. Analysis of mean BMD at each site according to anemia
In the men, significant differences were observed in whole- body BMD, femoral neck BMD, and lumbar spine BMD ac- cording to the presence or absence of anemia. The normal group had significantly higher mean whole-body, femoral neck, and lumbar spine BMDs than the anemia group (P<0.01).
In the women as opposed to the men, the anemia group had higher whole-body and lumbar spine BMD scores than the normal group, showing statistically significant differ- ences (P<0.01) (Fig. 2).
4. Analysis of differences in mean BMD
according to anemia and serum ferritin level among the groups
The men and women were found to have an opposite BMD pattern according to the presence or absence of ane- mia; thus, an additional analysis was performed. Statistical- ly significant differences in whole-body, femoral neck, and lumbar spine BMD were found among the three groups of men. Whole-body BMD was significantly lower in the ane-
Table 5A. BMDs of whole body, femoral neck, and lumbar spine across anemia-serum ferritin categories (male)
Variable Anemia-ferritin group
F P-value
Group 1 Group 2 Group 3
Whole body BMD 1.154±0.113a) 1.141±0.108a) 1.116±0.116b) 3.939d) 0.020d)
Femoral neck BMD 0.773±0.123a) 0.727±0.145c) 0.697±0.134b) 13.275e) <0.001e)
Lumbar spine BMD 0.926±0.137a) 0.880±0.160b) 0.881±0.175b) 3.861d) 0.022d)
Data represented as mean±standard deviation, P-value by analysis of variance.
Group1: normal, Group2: anemia with low serum ferritin, Group3: anemia without low serum ferritin.
Multiple comparison: a)>b), a)=c), c)=b). d)P<0.05. e)P<0.01.
BMD, bone mineral density.
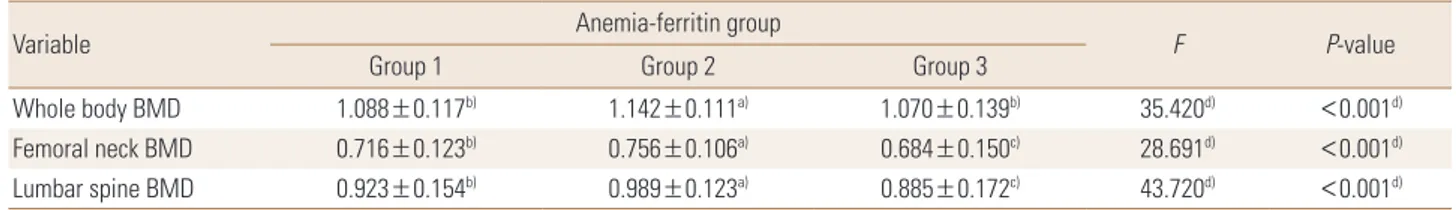
Table 5B. BMDs of whole body, femoral neck, and lumbar spine across anemia-serum ferritin categories (female)
Variable Anemia-ferritin group
F P-value
Group 1 Group 2 Group 3
Whole body BMD 1.088±0.117b) 1.142±0.111a) 1.070±0.139b) 35.420d) <0.001d)
Femoral neck BMD 0.716±0.123b) 0.756±0.106a) 0.684±0.150c) 28.691d) <0.001d)
Lumbar spine BMD 0.923±0.154b) 0.989±0.123a) 0.885±0.172c) 43.720d) <0.001d)
Data represented as mean±standard deviation, P-value by analysis of variance.
Group1: normal, Group2: anemia with low serum ferritin, Group3: anemia without low serum ferritin.
Multiple comparison: a)>b)>c). d)P<0.01.
BMD, bone mineral density.
mia without low ferritin group (1.116±0.116 g/cm2) than in the normal or anemia with low ferritin group (P=0.020).
Femoral neck BMD was significantly higher in the normal group (0.773±0.123 g/cm2) than in the anemia without low ferritin group (0.697±0.134 g/cm2; P<0.001). Lumbar spine BMD was significantly higher in the normal group (0.926±0.137 g/cm2) than in the anemia with low ferritin group (0.880±0.160 g/cm2) or the anemia without low fer- ritin group (0.881±0.175 g/cm2; P=0.022) (Table 5A).
Meanwhile, significant differences were found in whole- body, femoral neck, and lumbar spine BMDs in the women.
However, the BMD scores at all sites were highest in the anemia with low ferritin group, showing a difference from those in the men. Whole-body BMD was significantly high- er in the anemia with low ferritin group (1.142±0.111 g/
cm2) than in the normal group (1.088±0.117 g/cm2) or the anemia without low ferritin group (1.070±0.139 g/cm2; P<0.001). Significant differences in femoral neck BMD were found in the order of the anemia with low ferritin group (0.756±0.106 g/cm2) > the normal group (0.716±0.123 g/cm2) > the anemia without low ferritin group (0.684±
0.150 g/cm2; P<0.001). Significant differences were also found in lumbar spine BMD in the order of the anemia with low ferritin group (0.989±0.123 g/cm2) > the normal group (0.923±0.154 g/cm2) > the anemia without low ferritin
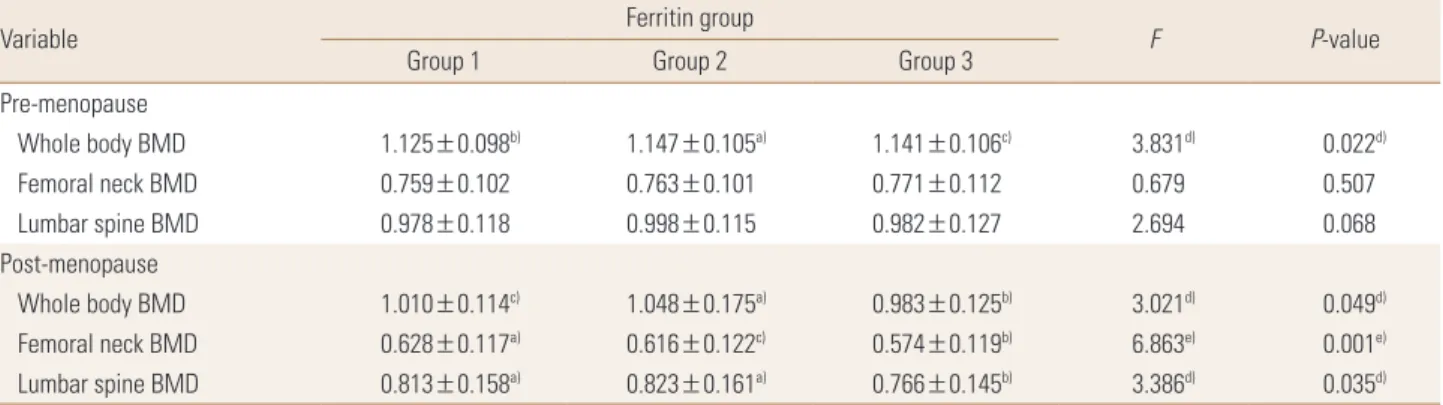
Table 6. BMDs of whole body, femoral neck, and lumbar spine across anemia-serum ferritin categories and menopausal status
Variable Ferritin group
F P-value
Group 1 Group 2 Group 3
Pre-menopause
Whole body BMD 1.125±0.098b) 1.147±0.105a) 1.141±0.106c) 3.831d) 0.022d)
Femoral neck BMD 0.759±0.102 0.763±0.101 0.771±0.112 0.679 0.507
Lumbar spine BMD 0.978±0.118 0.998±0.115 0.982±0.127 2.694 0.068
Post-menopause
Whole body BMD 1.010±0.114c) 1.048±0.175a) 0.983±0.125b) 3.021d) 0.049d)
Femoral neck BMD 0.628±0.117a) 0.616±0.122c) 0.574±0.119b) 6.863e) 0.001e)
Lumbar spine BMD 0.813±0.158a) 0.823±0.161a) 0.766±0.145b) 3.386d) 0.035d)
Data represented as mean±standard deviation, P-value by analysis of variance.
Group1: normal, Group2: anemia with low serum ferritin, Group3: anemia without low serum ferritin.
Multiple comparison: a)>b), a)=c), c)=b). d)P<0.05. e)P<0.01.
BMD, bone mineral density.
Fig. 3. Bone mineral densities (BMDs) of whole body, femoral neck, and lumbar spine across anemia-serum ferritin categories by sex. w/o, without.
Male
Normal
Anemia with low ferritin Anemia w/o low ferritin 1.4
1.2 1.0 0.8 0.6 0.4 0.2 0 BMD (g/cm2)
Whole body BMD Femoral neck BMD Lumbar spine BMD P<0.05
P<0.01
P<0.05
Female
Normal
Anemia with low ferritin Anemia w/o low ferritin 1.4
1.2 1.0 0.8 0.6 0.4 0.2 0 BMD (g/cm2 )
Whole body BMD Femoral neck BMD Lumbar spine BMD P<0.01
P<0.01
P<0.01
group (0.885±0.172 g/cm2; P<0.001) (Table 5A, B, Fig. 3).
We performed a subgroup analysis according to meno- pausal status in the women. In the premenopausal wom- en, only the mean whole-body BMD was significantly high- er in the anemia with low ferritin group (1.147±0.105 g/
cm2) than in the normal group (1.125±0.098 g/cm2) or the anemia without low ferritin group (1.141±0.106 g/cm2; P=0.022). In the menopausal women, significant differenc- es were found in whole-body, femoral neck, and lumbar spine BMDs. Whole-body BMD was higher in the anemia with low ferritin group (1.048±0.175 g/cm2) than in the normal group (1.010±0.114 g/cm2) or the anemia without low ferritin group (0.983±0.125 g/cm2; P=0.049). Femoral neck BMD was significantly higher in the normal group (0.628±0.117 g/cm2) than in the anemia without low fer- ritin group (0.574±0.119 g/cm2; P=0.001). No significant difference in lumbar spine BMD was found between the normal group (0.813±0.158 g/cm2) and the anemia with
low ferritin group (0.823±0.161 g/cm2), but lumbar spine BMD was significantly lower in the anemia without low ferritin group (0.766±0.145 g/cm2) than in the other two groups (P=0.035). In other words, a significant difference was found only in mean whole-body BMD between the groups of premenopausal women, whereas the BMD scores at all three sites were markedly low in the anemia without low ferritin group of menopausal women (Table 6).
DISCUSSION
In the present study, the association between Hb level and BMD was analyzed using various methods. According to the results of previous studies,[8-10] chronic hypoxia is likely to interfere with bone metabolism. Increased oxida- tive stress and extracellular acidification under hypoxic conditions are estimated to influence bone formation and remodeling. In addition, previous studies suggested the
association of whole body BMD loss and osteoporosis with various diseases such as inflammatory arthritis, inflamma- tory bowel disease, celiac disease, asthma, or chronic ob- structive pulmonary disease, which cause a chronic inflam- matory state of the body.[26] A specific study indicated that proinflammatory cytokines affect the development of anemia and osteoporosis.[27] In addition, osteoporotic tendency is observed in diseases that continuously affect hematopoietic function, such as sickle cell anemia,[11] thal- assemia,[28] and Fanconi anemia.[29] Although no clear mechanism of such an osteoporotic tendency has been es- tablished, a hypothesis explains BMD loss on the basis of hematological etiology.[16] According to the hypothesis, blood loss stimulates the proliferation of hematopoietic progenitor cells and increases the number of hematopoi- etic cells, including hematopoietic growth factors and os- teoclasts. Increased number of osteoclasts intensifies the resorption of bone tissue. In addition, reduced blood vol- ume due to blood loss stimulates bone development and results in increased number of osteoblasts, thereby pro- moting new bone formation. As bone formation is promot- ed, it again increases the production of osteoclasts, result- ing in increased bone resorption with subsequent increased hematopoietic area in the bone. The main point of the hy- pothesis is that if the above-mentioned process is repeat- ed dozens of times, such as women’s menstruations, the formation potential of osteogenic cells, including osteo- blasts, becomes fatigued and if the process is repeated over a long period, it may result in BMD loss. However, consider- ing that anemia is a phenotype of various physical or dis- ease states, we can assume that the pathogenesis of BMD loss may be differ depending on the etiology of anemia.
The results of the present study showed that in the men, the BMD in the anemia group was lower than that in the normal group, whereas in women, the BMD in the anemia group was higher than that in the normal group (Fig. 2). In addition, when the anemia group was divided into groups according to the presence or absence of low ferritin level to compare between groups, the results showed that in the men, the mean BMD was highest in the normal group and lowest in the anemia without low ferritin group, where- as in the women, the mean BMD was highest in the ane- mia with low ferritin group and lowest in the anemia with- out low ferritin group as found in the men (Table 5A, B, Fig.
3). When the BMD in premenopausal and menopausal
women was divided into three groups and compared, the results showed marked BMD loss in the anemia without low ferritin group among the menopausal women (Table 6).
The differences in results between the men and the wom- en in terms of BMD according to the presence or absence of anemia suggest that they may be due to the pathologi- cal difference between anemia in men and that in women.
The fact that in the men, women, and menopausal wom- en, the BMD was found to be consistently lower in the ane- mia without low ferritin group than in the normal or ane- mia with low ferritin group suggests that anemia, which is manifested as a phenotype of various diseases such as chro- nic inflammation or diseases with hypoxic condition but not due to blood loss or lack of iron intake, may be accom- panied by BMD loss. In the present study, various diseases (chronic renal failure, liver cirrhosis, diabetes, thyroid dis- ease, rheumatoid arthritis, and all types of cancer) that are known to interfere with bone metabolism were excluded.
However, we compared the prevalence rates of diseases, which are expected to cause chronic inflammation and hy- poxia in addition to the aforementioned diseases, among the three groups. As a result, diseases with remarkably high prevalence rates in the anemia without low ferritin group included hypertension (29.9%), stroke (6.7%), and chronic obstructive pulmonary disease (3.8%) in men, and hyper- tension (20.9%), stroke (1.6%), and coronary artery disease (2.7%) in the women. However, because the prevalence of other diseases except for hypertension was not high enough to account for all the causes of anemia without low ferritin level, the subjects with anemia without low ferritin level were likely to have a disease that was not surveyed during the KNHNES data collection or to be unaware of their dis- ease.
The finding of the present study that the mean BMD was higher in the anemia group with low ferritin level than the other two groups of women was unusual. Anemia with low ferritin suggests a deficiency of iron in the body, and the anemia in this case is likely to be iron-deficiency anemia on the basis of the pathogenesis of the anemia. In general, the most common anemia in women is iron-deficiency anemia, and women of childbearing age who weighs ap- proximately 60 kg without a specific underlying disease are known to consume approximately 10 mg more iron than any men or women who do not have menstruations.
[30] However, iron-deficiency anemia in older persons is
known to be due to a low intake of iron or lack of absorp- tion rather than due to periodic blood loss, unlike iron-de- ficiency anemia in premenopausal women.[31] In the case of anemia caused by chronic inflammation or iron-deficien- cy anemia caused by a lack of iron intake or absorption, only mechanisms underlying hypoxic and inflammatory bone metabolism inhibition are present, without any fac- tor that promotes bone metabolism. However, in the case of iron-deficiency anemia due to blood loss, a mechanism of bone formation stimulation exists due to the prolifera- tion of osteoblasts, on the basis of the aforementioned he- matological hypothesis. If the bone formation stimulation effect of blood loss is relatively larger than the bone absorp- tion effect until the overall bone formation ability of osteo- genic cells is lowered, the periodic blood loss may have a promoting effect on bone formation. The finding of the present study that the mean BMD was highest in the ane- mia with low ferritin group of women can be one of indi- rect evidence, and this was also partly suggested by the results of comparing BMD between premenopausal and menopausal women. This was also in line with the findings that in premenopausal women, whole-body BMD was sig- nificantly higher in the anemia with low ferritin group than in the other two groups and the lumbar spine BMD was not statistically significant but was highest in the anemia with low ferritin group among the three groups. On the other hand, the present study found that in the menopaus- al women, bone loss was noticeable in the anemia without low ferritin group, but the BMD was not higher in the ane- mia with low ferritin group than in the other two groups.
Although the aforementioned results of the present study cannot be said to be a direct evidence for supporting the hypothesis of bone metabolism based on hematological etiology, the results can be explained to some extent by the mechanism of the hypothesis.
The results of the present study suggest that reduced Hb levels or anemia findings do not necessarily mean BMD loss, but patients with anemia as a phenotype of various disea- ses other than typical iron-deficiency anemia are highly likely to also have BMD loss. Therefore, evaluation of BMD in patients with underlying disease and anemia findings may be meaningful.
The present study has limitations. This was not a prospec- tive study but was a cross-sectional study, so it cannot ex- plain the causal relationship between BMD and Hb levels,
and the available variable for determining the pathogene- sis of anemia was limited to serum ferritin levels. If the iron- binding ability or general blood test data from the fifth and succeeding KNHNES were included for analysis, we could classify the subtypes of anemia and analyze more accurate- ly the association between the subtypes of anemia and BMD. In addition, because the number of diseases investi- gated in the present study was limited, it is regrettable that there was a limitation in the identification of comorbid dis- eases in the anemia without low ferritin group or the un- derlying causes of anemia with low ferritin level, which is uncommon in men. Finally, the number of men with ane- mia was small, with only approximately one sixth of those with anemia in women.
Future studies regarding the association between Hb levels and BMD use markers that reflect bone formation (like osteocalcin, bone specific alkaline phosphatase) and bone resorption (N-telopeptide of collagen cross-link, C- telopeptide of collagen cross-link, deoxypyridinoline, etc.) in subjects for study designs that can verify hypotheses based on related hematological etiology [32] and long- term follow-up studies of the mechanism of anemia will be helpful to clearly understand the association between Hb levels and BMD.
REFERENCES
1. Johnell O, Kanis JA. An estimate of the worldwide preva- lence and disability associated with osteoporotic fractures.
Osteoporos Int 2006;17:1726-33.
2. Jang EJ, Lee YK, Choi HJ, et al. Osteoporotic fracture risk assessment using bone mineral density in Korean: a com- munity-based cohort study. J Bone Metab 2016;23:34-9.
3. New SA. Exercise, bone and nutrition. Proc Nutr Soc 2001;
60:265-74.
4. Espallargues M, Sampietro-Colom L, Estrada MD, et al. Iden- tifying bone-mass-related risk factors for fracture to guide bone densitometry measurements: a systematic review of the literature. Osteoporos Int 2001;12:811-22.
5. Tang YJ, Sheu WH, Liu PH, et al. Positive associations of bone mineral density with body mass index, physical activity, and blood triglyceride level in men over 70 years old: a TCVGH- AGE study. J Bone Miner Metab 2007;25:54-9.
6. Varenna M, Binelli L, Zucchi F, et al. Prevalence of osteopo- rosis by educational level in a cohort of postmenopausal