◎ Original Paper
ISSN (Print): 2287-9706
Internal Flow Characteristics of a Francis Hydro Turbine Model by Internal Flow Passage Shapes
Zhenmu Chen * , Qingsheng Wei * , Patrick Mark Singh * , Young-Do Choi ** †
1)Key Words : Francis Hydro Turbine(
프랜시스 수차), Performance(
성능), Internal Flow Characteristic(
내부유동 특성), Internal Flow Passage Shapes(
내부 유로 형상)
ABSTRACT
As a core component of a hydropower station, hydro turbines play a vital role in the integration of a power station. Research on the technology of hydro turbine is continuously increasing with the development of water electricity. On the basis of one-dimensional loss analysis, for three-dimension design, there are a lot of dimension of the internal flow passage shapes that are determined by experience. Therefore, the effect of the internal flow passage shapes on the performance and internal flow characteristics of a Francis hydro turbine model is investigated in this study. In this study, the small curvature of runner blade trailing edge shape is good for improving the efficiency of Francis turbine. The straight stay vane leading edge is good for suppressing the secondary flow. Moreover, suitable tongue passage shape and stay vane number improve the performance of the turbine considerably.
1. Introduction
Francis turbine is the most widely used turbine in the world. It has a wide head range from 10 m to 700 m. The efficiency of the Francis turbine can be as high as 95 %[1]. As a core component of a hydropower station, hydro turbine plays a vital role in the integration of a power station. Research on the technology of hydro turbine is continuously increasing with the development of water electricity.
On the basis of one dimensional loss analysis, for three-dimension design, there are a lot of dimension of the internal flow passage shapes determined by experience. Therefore, this study investigates the effect of the internal flow passage shapes on the performance and internal flow characteristics of a Francis hydro turbine model. Wei et. al[2] investigated the effects of guide vane opening on the internal flow of a Francis turbine by CFD analysis. Best guide vane
angle and guide vane number are obtained by CFD analysis. Choi et. al[3], analyzed the effect of inlet nozzle shape and draft tube shape on the performance and internal flow of a cross-flow hydro turbine by CFD calculations. These studies provide good understanding by using numerical analysis to predict the performance and internal flow characteristics of similar turbines.
In this study, the main objective is to investigate the effect of internal flow passage shapes on performance and internal flow characteristics of a Francis hydro turbine model by using numerical analysis.
2. Francis Hydro Turbine Model and Numerical Methods
2.1 Francis turbine model
The runner outlet diameter is
D
e=350 mm, and the inlet diameter isD
1=377.5 mm. The number of the* Graduate School, Department of Mechanical Engineering, Mokpo National University, Mokpo
** Department of Mechanical Engineering, Institute of New and Renewable Energy Technology Research, Mokpo National University, Mokpo
† 교신저자(Corresponding Author), E-mail : [email protected]
Specific speed N
s=200 [m-kW]
Rotational speed N=900 min
-1Effective head H=18 m
Flow rate (design point) Q=0.45 m3/s Runner inlet diameter D
1=377.5 mm Runner outlet diameter D
2=350 mm Runner blade number Z
r=13
Guide vane number Z
g=16
Stay vane number Z
s=8
Table 1 Design specifications of Francis turbine model Fig. 1 3D modeling view of the Francis turbine runner model
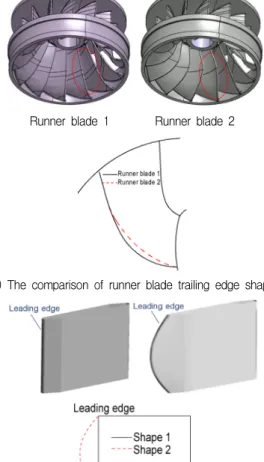
Runner blade 1 Runner blade 2
(a) The comparison of runner blade trailing edge shape
Stay vane shape 1 Stay vane shape 2 (b) The comparison of stay vane leading edge shape
Tongue wall shape 1 Tongue wall shape 2 (c) The comparison of tongue wall shape in spiral casing
(d) The comparison of stay vane number Fig. 2 Francis turbine model shape design
guide vanes areZ
g=16, and the number of the blade isZ
r=13. The guide vane opening can be fully opened to 64.4 mm, which is 100 % opening. The design point of the Francis turbine model is atH
=18 m for the effective head,Q
=0.45 m3/s for the water flow rate and the rotational speed isN
=900 min-1. The specific speed at the design point isN
S=200 m-kW. Figure 1 shows the three-dimensional modeling view of the Francis turbine runner. Table 1 shows the detailed design specifications of the Francis turbine model.Figure 2 shows the comparison of the Francis turbine model. Figure 2(a) is the comparison of the runner blade trailing edge shape. The curvature of runner blade trailing edge shape 1 is very small. In order to examine the runner blade trailing edge shape in regards to the performance and internal flow characteristics of the Francis turbine, a larger curvature of the runner trailing edge shape 2 is compared. The comparison of meridional shapes are also shown in this figure.
For one-dimension loss analysis, the stay vane angle can be determined. For the stay vane profile optimization, Wu et. al. [4] concluded that the outflow
from the stay vanes matches well with the inflow toward guide vanes after the profile of stay vane near the trailing edge is modified to protrude downstream.
In this study, two types of stay vane leading edge shapes are investigated as shown in Fig. 2(b), which has barely been studied before. The stay vane leading shape 1 is straight type, which is easy to manufacture.
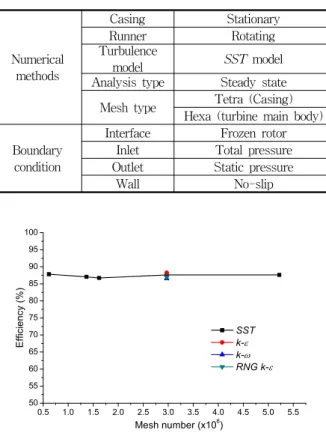
Numerical methods
Casing Stationary
Runner Rotating
Turbulence
model SST model
Analysis type Steady state Mesh type Tetra (Casing)
Hexa (turbine main body)
Boundary condition
Interface Frozen rotor
Inlet Total pressure
Outlet Static pressure
Wall No-slip
Table 2 Numerical methods and boundary condition
0.5 1.0 1.5 2.0 2.5 3.0 3.5 4.0 4.5 5.0 5.5 50
55 60 65 70 75 80 85 90 95 100
Efficiency (%)
Mesh number (x106) SST k-
k-
RNG k-
Fig. 3 Results of mesh and turbulence dependence
Fig. 4 Fine numerical grids of the runner
A curved corner shape at leading edge of the stay vane shape 2 is also studied. The comparison of meridional shapes are also shown in this figure.
Figure 2(c) shows that there are two cases with and without tongue wall at the ending of the spiral casing.
As shown in Fig. 2(c), location of the tongue wall is between the ending of the casing and the inlet of casing part. Tongue wall plays a role of stopping the water flow from recirculating into the casing.
Figure 2(d) shows the case with different stay vane number. Two kinds of stay vane number 8 and 16, are chosen to compare the influence on the performance and internal flow characteristics of the turbine model.
2.2 Numerical methods
Computational Fluid Dynamics (CFD) analysis is a very useful tool for predicting hydro machinery performance at various operating conditions[5-8]. This study employs a commercial CFD code of ANSYS CFX[9]
to conduct the internal flow analysis of Francis turbine model.
The numerical methods and boundary condition are set as shown in Table 2. The general connection is set
as the frozen rotor condition between the rotational area and the fixed area in the flow field for steady state calculation. The total pressure boundary condition is applied at the inlet of the calculation domain, and the static pressure is set for the outlet of the domain.
Figure 3 show the results of the mesh and turbulence dependence at the design point of the turbine model. The results show that the efficiency of four turbulence models are similar. However, the Shear stress transport (
SST
) turbulence model has been well known to estimate both separation and vortex occurrence on the wall of a complicated blade shape.Therefore, The
SST
is adopted as turbulence model.Moreover, the efficiency becomes constant after the mesh number excess of 3.0×10⁶. Therefore, the mesh number of about 3.0×10⁶ is selected for all the cases, for which the y+ is about 59 for runner blade surface.
Figure 4 shows the fine numerical grids of the runner.
The extended inlet pipe, stay vane, guide vane and draft tube of the turbine are made of hexahedral numerical grids. The casing part of the turbine fluid domain is made of tetrahedral grids because of the complex shape of the fluid domain.
3. Results and Discussion
3.1 Performance curves
When the water flows through the turbine, hydro losses may occur due to eddy formation in different components, such as change in flow direction as well as due to loss in kinetic energy at the exit of the turbine.
Considering only the hydro loss, the turbine efficiency is calculated by the following equation (1):
Efficiency Head Flow rate
0.80 0.84 0.88 0.92 0.96 1.00 1.04 1.08
Normalized : /Ini ; H/HIni ; ; Q/QIni
Design value Runner Blade SV shape Tongue wall No. SV
Fig. 5 Comparison of efficiencies by different internal flow passage
shapes Fig. 6 Pressure contours on the runner blade surface
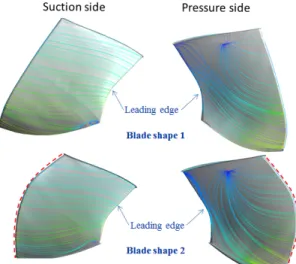
Fig. 7 Streamline distribution on the runner blade surface
(1)
Where
η
is the efficiency;T
is the torque on the runner;ω
is the angular speed of runner rotation on its own axis;ρ
is the water density;g
is the gravitational acceleration;Q
is the flow rate;H
is effective head.Figure 5 shows the result of efficiencies compared by different internal flow passage shapes. The best efficiency point is taken as reference condition. The initial turbine model consists of runner blade shape 1, stay vane shape 1, tongue wall shape 1 (no volute tongue wall) and stay vane number of 8. The efficiency of initial model (dashed line) is slightly higher than that of design point. The CFD analysis only considers the hydro loss at the clearance gap between runner and fixed casing, hence the efficiency of experiment appears lower than CFD results. Attaching the tongue wall at the end of spiral casing and increasing the stay vane number to 16 are effective to improve the efficiency of the Francis turbine model. As the boundary condition of total pressure at inlet and static pressure at outlet is used, the head of the turbine almost constant by different internal flow passage shapes. Moreover, the effect of internal flow passage shapes on the flow rate slightly.
3.2 Influence of runner blade trailing edge shape
Figure 6 shows the pressure contours at the pressure
and suction side of the runner blade surface. In comparison with the runner blade shape 1, the pressure at the runner blade shape 2 has a larger difference.
There is a low pressure region near the blade leading edge at pressure side and near trailing edge at the suction side at the blade shape 2. This low pressure region may cause the efficiency to drop, which is unwanted in turbine performance improvement.
Figure 7 presents the streamline distribution on the runner blade surface. The result shows that the streamline at the suction side has smooth distribution at the both blade shapes. However, the secondary flow occurs at the pressure side by both blade shapes.
Moreover, the secondary flow occurs at the leading edge of the runner blade shape 2 with curvature shape of trailing edge.
The velocity vectors distribution on the center plane
Fig. 10 Velocity vectors distribution by different stay vane shape
Fig. 11 Tangential velocity distribution without tongue wall Fig. 8 Velocity vectors distribution
Fig. 9 Streamline distribution on stay vane surface
of the casing are shown in Fig. 8. It clearly indicates that there is secondary flow at the pressure side of the runner blade for both the two cases with different runner blade trailing edge shapes. The effect of trailing edge shapes for suppressing secondary flow at the pressure side of the runner blade is poor.
3.3 Influence of stay vane shape
Figure 9 shows the streamline distribution on the stay vane surface. Smooth streamlines appear on the stay vane surface with straight corner leading edge (Stay vane shape 1). However, the secondary flow occurs when the curved leading edge was attached at the leading edge of stay vane (Stay vane shape 2). As a result, the secondary flow loss at the stay vane flow passage increases and the efficiency drops.
Figure 10 presents the velocity vector distribution on the cross section plane. Recirculation flow appears at the stay vane inlet area of stay vane shape 2, which
increases the energy loss and decreases the efficiency.
The curved coner leading edge of stay vane contributes to the secondary flow loss at the stay vane passage, where the turbine efficiency drops.
3.4 Influence of tongue wall
Figures 11 and 12 show the velocity distribution at the inlet and outlet of stay vane with and without tongue wall, respectively. The tangential velocity fluctuation of the turbine with tongue wall deceases.
This means the loss by fluctuation of velocity is reduced by tongue wall.
The flow angle at stay vane outlet is the flow angle at inlet of guide vane. These two angles should be similar for maximum efficiency. However, it is very difficult to match these angles. Therefore, these angles should be as close as possible for increasing efficiency.
The flow tangential angle in the region of stay vane
Fig. 12 Tangential velocity distribution with tongue wall
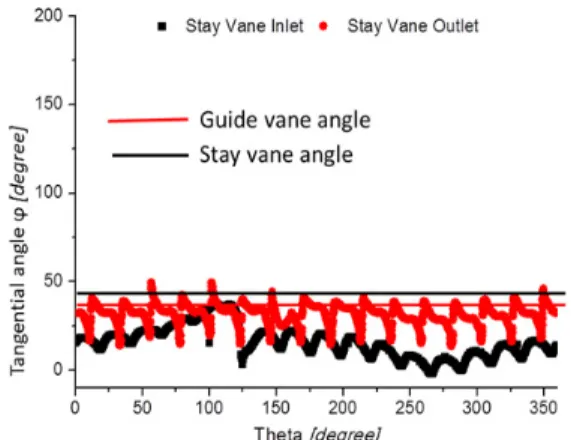
Fig. 13 Flow tangential angle without tongue wall
Fig. 14 Flow tangential angle with tongue wall
Fig. 15 Tangential velocity distribution with stay number of 8
Fig. 16 Tangential velocity distribution with stay number of 16
inlet at the location ofθ
from 0∽150˚ increaseseffectively near to the stay vane angle by attaching the tongue wall as shown in Figs 13 and 14. In addition, the tangential angle of stay vane outlet becomes closer to the guide vane inlet angle by attaching the tongue wall. This means that the effect of tongue wall suppresses the incidence loss by correcting the flow angle.
3.5 Influence of stay vane number
The results of Figs. 15 and 16 show that the flow tangential angle of stay vane outlet is closer to the guide vane angle with the stay vane number of 16, which means that the energy loss reduces with a closer angle between the flow tangential angle of stay vane outlet and guide vane inlet. That is why the efficiency improves with the stay vane number of 16.
4. Conclusion
According to the above discussions, conclusions can
be drawn as follows:
The change of runner blade shape to the curved trailing edge caused decrease in turbine efficiency, which is unwanted in turbine performance improvement.
Main reasons for this is located in the low pressure regions near the runner inlet part.
The curved corner leading edge of stay vane contributes to the secondary flow loss at the stay vane passage, where the turbine efficiency drops. Therefore,
the straight corner leading edge of stay vane is good for this Francis turbine model.
Tongue wall plays a role of stopping the water flow from recirculating into the casing. The flow tangential angle of stay vane inlet and outlet increases closer to the stay vane angle and guide vane angle, respectively. The incidence loss of the flow between stay vane and guide vane is suppressed by correcting the flow angle. Moreover, increasing of the stay vane number contributes to correcting the flow angle and accommodate the guide vane angle effectively.
Acknowledgement
This work was supported by the New and Renewable Energy of the Korea Institute of Energy Technology Evaluation and Planning (KETEP) grant funded by the Korea government Ministry of Trade, Industry and Energy (No. 2013T100200079).
References