• 검색 결과가 없습니다.

Analysis of Electrical Resistivity Characteristics of Concrete by Using Flat Electrode Method

N/A
N/A
Protected

Academic year: 2021

Share "Analysis of Electrical Resistivity Characteristics of Concrete by Using Flat Electrode Method"

Copied!
7
0
0

로드 중.... (전체 텍스트 보기)

전체 글

(1)

Park, Chang Seon 박`창`선 Member·Graduate Student, Department of Civil Engineering, Inha Univ. (E-mail : [email protected]) Park, Hae Won 박`해`원 Member·Graduate Student, Department of Civil Engineering, Inha Univ. (E-mail : [email protected]) Lee, Kang Hun 이`강`훈 Member·Researcher, Highway&Transportation Institute, Korea Institute of Civil Engineering and Building

Technology (E-mail : [email protected])

Jeong, Jin Hoon 정`진`훈 Member·Professor, Department of Civil Engineering, Inha Univ.·Corresponding Author (E-mail : [email protected])

1. INTRODUCTION

In general, weakening of the ground bearing capacity and cavities under the concrete pavement occur due to the poor drainage, the aging of large pipelines, and infiltration-related ground softening over time. A cavity under concrete

pavement causes separation between the concrete slab and the ground, which results in the settlement and cracking of the concrete slab (Park et al., 2012; Sohn et al., 2013). To prevent this problem, a pre-investigation of the ground under the concrete pavement should be conducted. Coring with the naked eye is a definite method to detect the ground condition

Int. J. Highw. Eng. Vol. 19 No. 3 : 57-63 JUNE 2017 https://doi.org/10.7855/IJHE.2017.19.3.057

ABSTRACT

PURPOSES : The pole electrode method damaged the concrete pavement on inserting the electrode into the pavement surface. This study examined the feasibility of the flat electrode method to observe the concrete pavement instead of the pole electrode method and analyzed the resistivity characteristics of the concrete by performing laboratory tests.

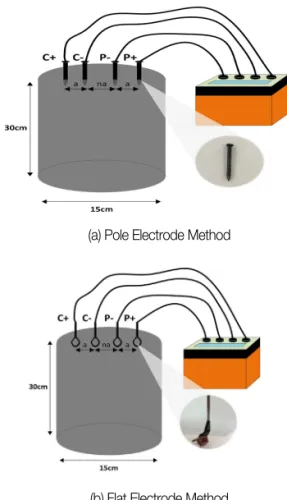
METHODS : The resistivity of the concrete specimens manufactured with three different mixing ratios (38.50%, 39.50%, and 40.50%) were measured using the pole and flat electrode methods according to the concrete age (7 and 28 days) and electrode spacing (20 mm, 30 mm, and 40 mm).

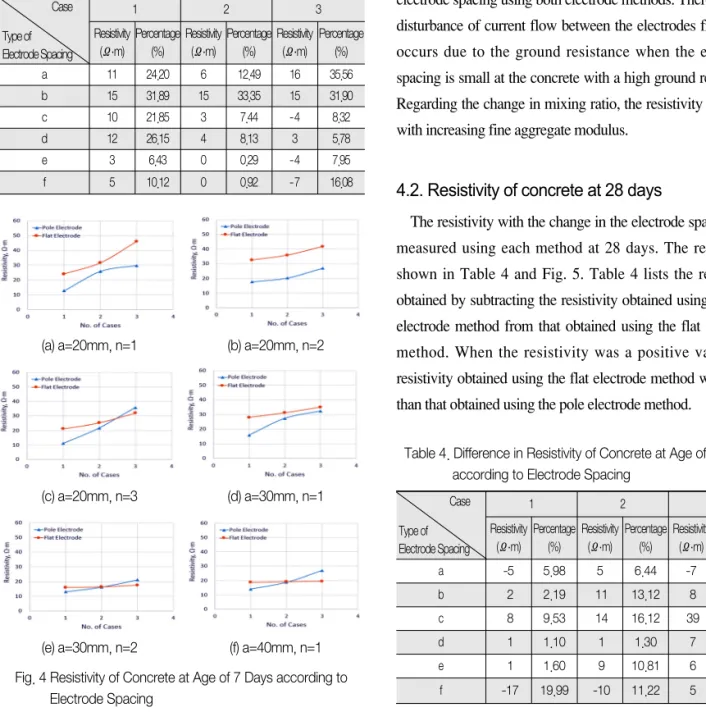
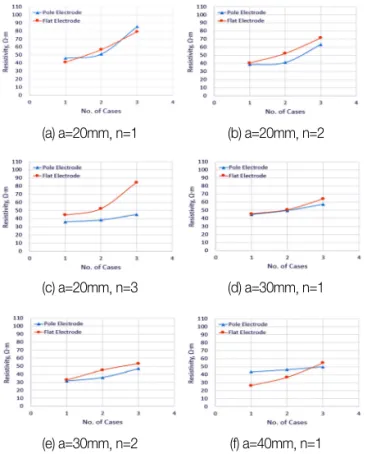
RESULTS : In both pole and flat electrode methods, the resistivity increased with increasing fine aggregate proportion regardless of the concrete age. The resistivity measured at a concrete age of 28 days was slightly larger than that measured at 7 days. In the case of a concrete age of 7 days, the resistivity measured by the flat electrode method was larger than that measured by the pole electrode method. The difference disappeared at 28 days.

CONCLUSIONS : The results suggest that the flat electrode method can replace the pole electrode method because the resistivity measured by both methods was similar. Hence, the development of a technology to apply the flat electrode method to actual concrete pavement is necessary.

Keywords

Resistivity, Pole electrode method, Flat electrode method, Concrete pavement, Fine aggregate modulus

Corresponding Author : Jeong, Jin Hoon, Professor Inha University, Department of Civil Engineering, 100 Inha-ro Nam-gu, Incheon, 22212, Korea Tel : +82.32.860.7574 Fax : +82.32.873.7560 E-mail : [email protected]

International Journal of Highway Engineering http://www.ksre.or.kr/

ISSN 1738-7159 (print) ISSN 2287-3678 (Online)

Received Mar. 24. 2017 Revised Jun. 01. 2017 Accepted Jun. 02. 2017

Analysis of Electrical Resistivity Characteristics of Concrete by Using Flat Electrode Method

평판접지 전극방법을 이용한 콘크리트의 전기비저항 특성 분석

(2)

under the concrete pavement but coring damages the concrete slab and reduces its durability. In addition, it is impossible to detect a deeply located cavity. To overcome such deficiencies, non-destructive testing should be conducted to determine the condition under the concrete pavement (Yeom et al., 2013;

Sohn et al, 2013; Lee et al., 2014).

Because a large amount of data is processed in a short period with high reliability due to the development of electronic devices, resistivity surveys have been used widely in geotechnical investigations: underground cavity location surveys, fault and crack identification, and underground water location surveys (Park et al., 2004; Park et al., 2006;

Gambetta et al., 2011; Reynolds, 2011). In general, a resistivity survey is conducted with the pole inserted and fixed on the pavement. On the other hand, it is difficult to insert and fix the pole on the concrete pavement because of its hardness. Moreover, it can damage the concrete pavement surface during installation (Lee et al., 2014).

Therefore, this study examined the feasibility of resistivity surveys using a flat electrode method to detect the ground condition under the concrete pavement without damaging the concrete. The survey was carried out in a laboratory using both the pole electrode method and flat electrode method.

The resistivity of the concrete specimens was measured with respect to the electrode spacing and mixing ratio.

2. THEORY of RESISTIVITY SURVEY 2.1. Resistivity

In a geophysical survey, resistivity is the most fundamental property. The amount of flowing current is determined when a constant voltage is applied to an object. If the structure under the concrete pavement is homogeneous, then the resistivity can be considered the true resistivity ( ). A resistivity survey normally uses 4 electrodes: a positive potential electrode (P+), negative potential electrode (P-), positive current electrode (C+), and negative current electrode (C-). The difference between two potential electrodes measured in situ helps determine the resistivity, as expressed in Eq. (1). The unit of resistivity is ·m (Ohm-meter) (Park et al., 2004; Farooq et al., 2009; Reynolds, 2011).

where is the difference between two potential electrodes, is the current, is the length of an object, and is the area of an object.

Even if the purpose of a resistivity survey is to determine the true resistivity, the resistivity measured is generally converted to the apparent resistivity, as expressed in Eq. (2).

This is because the actual underground medium is not completely homogeneous and the measured resistance depends on the way of arraying the electrodes so that the apparent resistivity can be defined as the equivalent resistance obtained from a heterogeneous medium corresponding to the resistance obtained from a homogeneous medium. The unit of apparent resistivity is ·m (Reynolds, 2011).

where is resistance ( ) and is a geometric factor that can be expressed as Eq. (3).

When the object to measure, such as the ground, is heterogeneous, the apparent resistivity changes with the array of electrodes because the geometric factor generally changes with the electrode array. Fig. 1 shows the general array of electrodes. On the other hand, if the structure under the concrete pavement is homogeneous, the calculated apparent resistivity can be considered to be the true resistivity (Reynolds, 2011).

2.2. Method of electrode array and installation Several electrode array methods are used for resistivity (1)

(2)

(3)

Fig. 1 General Electrode Array

(3)

surveying. This study used the dipole-dipole array method, which was performed in the vertical and horizontal directions simultaneously to investigate the two-dimensional structures under the concrete pavement. As shown in Fig. 2, the interval between the current electrodes (C+, C-) and potential electrodes (P+, P-) was fixed, and a survey was performed with interval increments of a, 2a, 3a, , na. The geometric factor for the dipole-dipole array can be expressed in Eq. (4). The value measured with the dipole-dipole array is illustrated in a particular position according to (Reynolds, 2011).

In a resistivity survey using the pole electrode method, the pole should be inserted and fixed on the concrete pavement.

Although the possibilities of error from poor contact is very low, its installation is time consuming and it can damage the concrete pavement surface. On the other hand, the flat electrode method is easy to install and does not damage the concrete pavement surface but there can be errors in data due to the poor contact and high resistance (Reynolds, 2011; Lee et al, 2014).

3. LABORATORY TEST

In this study, experiments were performed using these two methods, and the results were analyzed comparatively, as shown in Fig. 3. The pole electrode method uses 38-mm-long concrete nails, while the flat electrode method uses a hex- wrench and a copper plate.

Considering that the measuring depth of the resistivity varies with the electrode spacing, a laboratory test was performed with six electrode spacings, as shown in Table 1, as the maximum diameter of the specimen is 150mm.

To evaluate the effects of the fine aggregate modulus (S/a) on the resistivity, three concrete specimens were produced for each mix design based on the standard specifications of road construction (ASTM C192/C192M, 2015; MLTMA, 2009).

In total, 9 concrete specimens were produced with 3 different mix designs with a diameter of 150mm and a height of 300mm, as summarized in Table 2. The resistivity measurements were repeated 5 times using the pole electrode method and the flat electrode method at 7 and 28 days. The (4)

Fig. 2 Dipole-Dipole Array

(a) Pole Electrode Method

(b) Flat Electrode Method Fig. 3 Electric Resistivity Survey Methods

Table 1. Type of Electrode Spacing

Type Electrode Spacing

a (mm) n

a 20 1

b 20 2

c 20 3

d 30 1

e 30 2

f 40 1

(4)

results were analyzed by calculating the average value.

4. ANALYSIS of TEST RESULTS 4.1. Resistivity of concrete at 7 days

The resistivity with the change in the electrode spacing was measured using each method at 7 days. The results are shown in Table 3 and Fig. 4. Table 3 lists the resistivity obtained by

subtracting the resistivity obtained with the pole electrode method from the resistivity obtained using the flat electrode method. When the resistivity was a positive value, the resistivity obtained using the flat electrode method was larger than that obtained using the pole electrode method.

Overall, the resistivity obtained using the flat electrode method was slightly larger than that obtained using the pole electrode method. Because of the wide contact area of the flat electrode and the high ground resistance of the concrete surface, the ground resistance affected the current flow of the flat electrode method more than that of the pole electrode method. On the other hand, the difference range of the absolute value was 0-16 ·m and that of the percentage was 0.29-35.56 %, which was relatively small.

Furthermore, the change in the electrode spacing showed that sensitivity of the resistivity increased with decreasing electrode spacing using both electrode methods. Therefore, the disturbance of current flow between the electrodes frequently occurs due to the ground resistance when the electrode spacing is small at the concrete with a high ground resistance.

Regarding the change in mixing ratio, the resistivity increases with increasing fine aggregate modulus.

4.2. Resistivity of concrete at 28 days

The resistivity with the change in the electrode spacing was measured using each method at 28 days. The results are shown in Table 4 and Fig. 5. Table 4 lists the resistivity obtained by subtracting the resistivity obtained using the pole electrode method from that obtained using the flat electrode method. When the resistivity was a positive value, the resistivity obtained using the flat electrode method was larger than that obtained using the pole electrode method.

Table 2. Mix Design of Concrete

Case W/C

(%)

S/a (%)

Unit Quantity(kg/m

3

)

Cement Sand Gravel

a 40.00 38.50 7.51 11.80 19.58

b 45.00 39.50 6.67 12.37 19.69

c 50.00 40.50 6.00 12.90 19.70

Table 3. Difference in Resistivity of Concrete at Age of 7Days according to Electrode Spacing

Case Type of Electrode Spacing

1 2 3

Resistivity (Ω·m)

Percentage (%)

Resistivity (Ω·m)

Percentage (%)

Resistivity (Ω·m)

Percentage (%)

a 11 24.20 6 12.49 16 35.56

b 15 31.89 15 33.35 15 31.90

c 10 21.85 3 7.44 -4 8.32

d 12 26.15 4 8.13 3 5.78

e 3 6.43 0 0.29 -4 7.95

f 5 10.12 0 0.92 -7 16.08

Table 4. Difference in Resistivity of Concrete at Age of 28Days according to Electrode Spacing

Case Type of Electrode Spacing

1 2 3

Resistivity (Ω·m)

Percentage (%)

Resistivity (Ω·m)

Percentage (%)

Resistivity (Ω·m)

Percentage (%)

a -5 5.98 5 6.44 -7 7.66

b 2 2.19 11 13.12 8 9.56

c 8 9.53 14 16.12 39 46.11

d 1 1.10 1 1.30 7 7.86

e 1 1.60 9 10.81 6 7.39

f -17 19.99 -10 11.22 5 5.81

(a) a=20mm, n=1 (b) a=20mm, n=2

(c) a=20mm, n=3 (d) a=30mm, n=1

(e) a=30mm, n=2 (f) a=40mm, n=1

Fig. 4 Resistivity of Concrete at Age of 7 Days according to

Electrode Spacing

(5)

The difference in the absolute values measured by both methods was 1-39 ·m and that of the percentage was 1.10- 46.11 %. At the spacing ‘c’in Table 4, there was a significant difference in the absolute values and its maximum value was 39 ·m. In contrast, the tests at the other spacings showed a small difference of 17 ·m and the percentage was under 20

%. In general, the difference in the resistivity by both electrode methods was not large and the resistivity by both electrode methods was similar.

Regarding the change in electrode spacing, the sensitivity of the resistivity with both electrode methods was low compared to the sensitivity of the resistivity measured at 7 days. At the initial phase of the curing time, the surface of the concrete had dried significantly, and there was a significant difference in humidity between the inside and outside of the concrete. On the other hand, the pore water decreased inside the concrete due to hydration and evaporation and the both sides of the concrete became dry over time. Therefore, moisture has a similar effect on the ground resistance in both electrode methods.

When reviewing the change in resistivity according to the mixing ratio, however, the resistivity at 28 days increased with increasing fine aggregate modulus similar to the results

at 7 days.

4.3. Analysis of overall trend of resistivity

The resistivity measured on every concrete specimen at 7 and 28 days was analyzed according to the change in the electrode spacing. The results are shown in Fig. 6. Fig. 6 (a) presents the results measured in accordance with the change in the fine aggregate modulus by the different electrode methods, age, and electrode spacing. Fig. 6 (b) presents the results measured in accordance with the change in the fine aggregate modulus by the electrode methods and age, regardless of the electrode spacing. The results of the electrode spacing are already presented in sections 4.1 and 4.2. Although the electrode method did not affect the resistivity, it increased with age and increasing fine aggregate modulus. In general, the current flows due to ions dissolved in the pore water in the concrete. On the other hand, the pore water decreases due to hydration and evaporation over time, which makes the current flow rough and the electrical conductivity low. Eventually, the resistivity increases with the age of the concrete (Polder et al., 2000; Farooq et al., 2009).

(a) a=20mm, n=1 (b) a=20mm, n=2

(c) a=20mm, n=3 (d) a=30mm, n=1

(e) a=30mm, n=2 (f) a=40mm, n=1

Fig. 5 Resistivity of Concrete at Age of 28 Days according to Electrode Spacing

(a) All Data Points

(b) Ignore of Electrode Spacing

Fig. 6 Overall Trend of Resistivity of Concrete

(6)

5. CONCLUSIONS

This study examined the feasibility of a resistivity survey in concrete using flat electrode method. The investigation was carried out in a laboratory using concrete specimens.

Concrete specimens with three mixing ratios were prepared and the resistivity measured by the pole electrode method and was analyzed comparatively. Both were conducted with the change in the electrode spacing and age of the concrete. The results of this study were as follows.

1. The resistivity increased with increasing fine aggregate modulus in both methods. In addition, the resistivity measured at 28 days was larger than that measured at 7 days. This is because the amount of pore water and ions dissolved in it decrease due to hydration and evaporation, which leads to a decrease in electrical conductivity and an increase in resistivity.

2. At the test using the concrete specimens at 7 days, the resistivity measured by the flat electrode method was larger than that measured by the pole electrode method.

This is because of the wide contact area of the flat electrode, which is affected more by the current flow. On the other hand, the maximum difference in the absolute value was 16 ·m(35.56 %), which was relatively small. With the change in mixing ratio, there was no significant difference in resistivity between both electrode methods.

3. In the test using the concrete specimens at 28 days, there was no large difference between the resistivity by both electrode methods, compared to the results of the test using the specimens at 7 days. This is because of the decreased difference in humidity between the inside and outside of the concrete, which reduces the effect of the moisture and ground resistance. The trend of the resistivity with different mixing ratios in the tests by both methods was similar at 28 days.

4. The difference in resistivity measured by the pole electrode method and flat electrode method was small. In addition, the trend of the resistivity in accordance with the change in mixing ratio was similar in both electrode methods. Therefore, there is no problem using the flat electrode method, which does not damage the concrete surface and does not require difficult installation of the

electrodes. Hence, a technology that can apply the flat electrode method to an actual concrete pavement in the field will be needed.

ACKNOWLEDGEMENT

This research was supported by Basic Science Research Program through the National Research Foundation of Korea(NRF) funded by the Ministry of Education (NRF-2014R1A1A2055003) and by research project (Development of Eco-Friendly Pavements to Minimize Greenhouse Gas Emissions) funded by the Ministry of Land, Infrastructure and Transport(MOLIT) and the Korea Agency for Infrastructure Technology Advancement(KAIA).

REFERENCES

ASTM C 192/C192M, (2015), “Standard Practice for Making and Curing Test Specimens in the Laboratory”, American Society for Testing and Materials (ASTM).

Farooq, M., Park, S. G., Song, Y. S. and Kim, J. H., (2009), “Mortal Characterization using Electrical Resistivity Method”, Jigu- Mulli-wa-Mulli-Tamsa, Vol. 12. No. 2, pp. 215-220.

Gambetta, M., Armadillo, E., Carmisciano, C., Stefanelli, P., Cocchi, L., and Tontini, F. C., (2011), “Determining Geophysical Properties of a Near-surface Cave through Integrated Microgravity Vertical Gradient and Electrical Resistivity Tomography Measurements”, Journal of Cave and Karst Studies, Vol. 73, No. 1, pp. 11-15.

Ministry of Land, Transport and Maritime Affairs, (2009), “Road Construction Standard Specification”, Ministry of Land, Transport and Maritime Affairs.

Lee, H. S., Oh, S. H., Chung, H. J., Noh, M. G., Ji, Y. S., Ahn, T. G., Song, S. H. and Yong, H. H., (2014), “Application of DC Resistivity Survey from Upper Portion of Concrete and Geostatistical Integrated Analysis ”, Journal of Korean Earth Science Society, Vol. 35, pp. 29-40.

Park, S. G., Kim, J. H., Cho, S. J., Yi, M. J. and Son, J. S., (2004),

“Electrical Resistivity Characteristic of Soils”, Korean Geotechnical Society, Vol. 2004, pp. 847-854.

Park, S. G., Yi, M. J., Kim, C. R., Son, J. S., Kim, J. H., Cho, S. J., and Seo, G. W., (2006), “Detection of Limesilicate Cavities by 3-D Resistivity Survey ”, Korean Society of Earth and Exploration Geophysicists, Vol. 39, No. 5, pp. 368-372.

Park, S. Y., Sohn, D. S., Lee, J. H. and Jeong, J. H., 2012. A Study on Joint Position at Concrete Pavement with Box Culverts, Journal of the korean Society of Road Engineers, Vol. 14. No.

2, pp. 45-53.

Polder, R., Andrade, C., Elsener, B., Vennesland, Ø., Gulikers, J., Weidert, R. and Raupach, M., (2000), “Test methods for on site measurement of resistivity of concrete”, Materials and Structures, Vol. 33, pp. 603-611.

Reynolds, J. M., (2011), “An Introduction to applied and

Environmental Geophysics”, Second Edition, pp. 307-368.

(7)

Sohn, D. S., Lee, J. H., Jeong, H. S., Park, J. Y., and Jeong, J. H., (2013), “A Method for Evaluation of Hollow Existence in Sublayers of Concrete Pavement Considering Pavement Stiffness”, International Journal of Highway Engineering, Vol.

15, No. 1, pp. 95-102.

Yeom, W. S., Jeong, H. S., Yan, Y. S., Sohn, D. S., Lee, J. H., and

Jeong, J. H., (2013), “Optimal Joint Position in Concrete

Pavement Slab over Skewed Box Culvert”, International

Journal of Highway Engineering, Vol. 15, No. 5, pp. 47-55.

수치

Fig. 1 General Electrode Array
Fig. 2 Dipole-Dipole Array
Table 3. Difference in Resistivity of Concrete at Age of 7Days  according to Electrode Spacing
Fig. 5 Resistivity of Concrete at Age of 28 Days according to  Electrode Spacing

참조

관련 문서

50 simulated resin blocks with J-shaped curvature canals were instrumented by ProTaper (Dentsply Maillefer, Ballagiues, Switzerland) Ni-Ti files using the

The purpose of this study is to compare the degrees of conversion of light curing resin cement specimens cured by the light transmitted different thickness of zirconia

The purpose of this study is to evaluate the marginal and internal fit of coping made by CAD/CAM using different scanning methods.. Zirconia coping was made

저작권법에 따른 이용자의 권리는 위의 내용에 의하여 영향을 받지 않습니다.. 이것은 이용허락규약 (Legal Code) 을 이해하기

packing ratio in the bioelectrochemical anaerobic digester · · · 50 Table 4.5 VS, COD and methane yield according to the electrode packing r atio in the

The influence of age and gender on remifentanil EC 50 for preventing microemulsion propofol injection pain.. - Remifentanil EC 50 on propofol injection

¾ Electromagnetic methods use the response of the ground to the propagation of incident alternating electromagnetic waves which are made up of two

(1) In antiferromagnetically coupled multilayers, Conduction electrons of either spin having sufficiently long mean free paths will thermally sample a series of strong