24(10); 1273~1283; October 2015 http://dx.doi.org/10.5322/JESI.2015.24.10.1273
ORIGINAL ARTICLETemporal Characteristics of Selected Volatile Organic Compounds in Urban High-Stories Urban Apartments
Seung Ho Shin, Ji-Hoon Kim, Wan Kuen Jo
1)*Department of Health Environment, Daegu Health College, Daegu, 702-722, Korea
1)Department of Environmental Engineering, Kyungpook National University Daegu, 702-701, Korea
Abstract
In present study, the temporal characteristics of nine selected volatile organic compounds (VOCs), including four alcohol, 2 aldehyde, and 3 ketone compounds, in high-stories urban apartments over a 2-y period were investigated. The indoor VOC concentrations had generally a decreasing trend over the 2-y follow-up period. For examples, the 2E1H indoor concentration decreased from 10.8 ㎍/m3 for the first two months to 5.1 ㎍/m3 for the last two months. In addition, the DCA and ACT indoor concentrations decreased from 5.0 and 14 ㎍/m3 for the first two months to 2.2 and 6.4 ㎍/m3, respectively, for the last two months. The indoor-to outdoor concentration ratios over the 2-y period were much greater than 1, indicating that indoor VOC concentrations were higher than the outdoor VOC concentrations. Similar to those of the individual VOCs, the indoor- to-outdoor concentration ratios of all three VOC groups were higher than 1 over the 2-y follow-up period, suggesting higher indoor concentrations of the three VOC groups than outdoor concentrations. In consistence with the results of VOC indoor concentrations, the VOC emission rates decreased gradually as time passed, due to the decreased VOC emission strengths of indoor sources. Finally, there was an initial sharp decrease in the indoor VOC concentrations followed by a slower decrease, indicating a multi-exponential decay model for the target VOCs, which was demonstrated by comparison of the residuals and the adjusted coefficient of determination associated with the one and two-exponential fits of each data set.
Key words : Temporal characteristics; Decay compartment model; Consumer product; High story; VOC source
1. Introduction
1)Individual exposure to volatile organic compounds (VOCs) is a crucial environmental problem because of the harmful health effects and ubiquity of these pollutants in various indoor environments. The VOC exposure is closely associated with symptoms of Sick Building Syndrome, which is denoted as a group of symptoms, such as irritability, sleepiness, nausea, and other health effects (Cakmak et al., 2014; Langer et al., 2015; Ongwandee et al., 2011; Takigawa et al., 2012). The ubiquity of indoor VOCs is ascribed to a
range of emissions sources, including construction finishing materials (floor, ceiling and wall coverings, etc.), furniture, and consumer products (household cleaners, air fresheners, deodorizers, waxes, etc.) (Bari et al., 2015; Liang et al., 2014; Shin and Jo, 2013; Wang et al., 2015). Especially, the construction finishing and furnishing materials in newly-built buildings are primary indoor sources of a great deal of VOCs (Liang et al., 2014; Shin and Jo, 2013).
Therefore, high VOC concentration levels are more typically measured in new residential buildings than established ones (Wang et al., 2015).
Received 21 September, 2015; Revised 17 October, 2015;
Accepted 19 October, 2015
*Corresponding author : Wan Kuen Jo, Department of Environmental Engineering, Kyungpook National University Daegu, 702-701, Korea Phone: +82-53-950-6584
E-mail: [email protected]
ⓒ The Korean Environmental Sciences Society. All rights reserved.
This is an Open-Access article distributed under the terms of the Creative Commons Attribution Non-Commercial License (http://
creativecommons.org/licenses/by-nc/3.0) which permits unrestricted non-commercial use, distribution, and reproduction in any medium, provided the original work is properly cited.
It should be noted that the concentrations of VOCs in many new residential buildings decrease as time passes because the emission strength of construction finishing and furnishing materials decrease with time.
This assertion is supported by previous studies (Shin and Jo, 2013; Wang et al., 2015), that reported the long-term variation of indoor VOC concentrations in new buildings after the resident moved in. In those studies, indoor VOC measurements were repeated over a 2-y period. The results revealed that most VOC concentrations in new buildings did not exhibit levels similar to those of older building until two years. In addition, Järnström et al., (2006) repeated their VOC concentrations in newly-built buildings over a one year period and found that the VOC concentrations generally showed the greatest dec -rease most definitely during the first six months.
These time-interval VOC data might be associated with a VOC decay model to predict VOC concen -trations over time. Typically, a more reliable expon -ential decay model can be obtained with more measurement values. Therefore, the VOC measure -ment data collected from the previous studies are insufficient for establishing exponential decay models. As such, long-term observations with shorter observation time intervals are necessary to supply new and more reliable results regarding the indoor VOC concentration dependency on time. Neverth -eless, such studies have rarely reported to date, even though limited studies have determined short-term indoor VOC decay models to predict short-term concentrations on an hourly basis (Deng et al., 2012;
Li and Niu, 2007; Yan et al., 2009).
Moreover, past indoor VOC data regarding new buildings is likely inappropriate because of variations in emission strength of many VOCs and differences in ventilation conditions. Recently built-buildings are more tightly sealed for energy savings, leading to low ventilation conditions. This indicates that new information pertaining to VOC levels in recently
constructed houses is required to update the rela -tionship between exposure and health risk for residents of new buildings. Consequently, this study was performed to examine the temporal charac -teristics of selected VOCs (focusing on alcohol, aldehyde, and ketone groups) in new apartments every month over a 2-y period after the residents had moved in. In addition, the emission strength of indoor VOCs according to the survey period were estimated.
One- and two-compartment exponential decay models were also developed to evaluate long-term (two year) time dependence on indoor VOC concentrations after moving into new residential buildings were cons -tructed. Ultimately, the present study provides up -dated longitudinal indoor VOC concentration data after moving-into new apartments, emission infor -mation, and long-term VOC decay models.
2. Experimental methods
2.1. Experimental design
A 2-y time-series investigation of indoor and
outdoor VOC concentrations was performed in 25
new homes in selected high-story apartment buildings
(declared as 10 or more stories). Air sampling was
carried out in the selected apartments within one
month of when the residents moved in and then every
month over a 2-y period. During the survey, five
apartments were switched by their neighborhood
ones due to the residents moving or complaints about
their inconvenience. The buildings were located in
Daegu with about 2.5 million inhabitants. Residents
of 25 homes in 37 apartment buildings that satisfied
the experimental criteria were asked for permission to
measure the air concentration levels inside their
apartments. The criteria for apartment selection were
as follows: the buildings should be located at least
150 meters away from major roadways to reduce the
impact of motor vehicle exhausts; the age of the
apartments should be less than one month (counting
from the date on which heating fuel was supplied);
and the apartments should have two to three bed -rooms, one living room, and two bathrooms. All investigated apartments were constructed with con -crete and iron frames, while liquid petroleum gas was supplied as the main cooking and heating fuel for the apartments. The apartment floor was covered with parquet, polyvinyl chloride (PVC), and/or marble.
Interior wall was covered with marble and/or PVC, while ceiling was covered with PVC. Even though there was one fan in the kitchen and bathroom in the investigated apartments, the inhabitants were asked not to run them during air sampling.
VOC sampling was carried out inside the apart -ments in the morning (09:00 12:00) or afternoon (14:00 17:00). Before air sampling, all doors and windows were left open for 0.5 h to equilibrate the indoor VOC levels to the ambient levels. External doors and windows were then left closed for 2 h, but the room doors were left open. Subsequently indoor sampling was carried out for 1 h at a height of 1.5 m from the floor in the middle of the living room. For the cold sampling months, both the inhabitants and one technician stayed inside one bedroom, during which time both the door and the window were closed. However, they stayed outside the apartments during the sampling hours for the other measurement months to reduce the effects of occupants and their activities on indoor VOC levels. Either smoking or cooking activities were not observed during the measurements. Additionally, outdoor air sampling was concurrently carried out at the outdoor balcony of each apartment.
2.2. VOC measurements
The target compounds were collected by drawing air through a 0.64-cm-outside diameter and 10-cm length stainless steel trap containing Tenax TA using a sampling pump (Model 224-PCXR8, SKC Inc.).
The air flow rates were determined before and follo
-wing the collection of each sample using a digital flow meter. The average of the two air flow rates was utilized as the sampling flow rate for sample volume calculations. Flow rates of 25 30 and 35 40 mL min
-1were adjusted for indoor and outdoor samples, respectively, on the basis of the relative expected concentrations for each experimental condition.
The target compounds collected in the SS traps were analyzed using a gas chromatograph (HP 5890 II)/mass spectrometer (HP MSD5973) (GC/MS) unit or a GC/flame ionization detector (FID) system (HP 7890) combined with a thermal desorbing unit (TD, Perkin Elmer ATD 400). As displayed in Table 1, the target compounds included 11 chemicals, which are listed in the Japanese indoor air standard mixture (JP-4M7537, Supelco). These chemicals consisted of four alcohols, two aldehydes, and three ketones. The GC/FID system was utilized for VOC analyses, while the GC/MS was employed for confirmation of the GC/FID results. Identification of each chemical was carried out based on its retention time and/or Wiley 275 software library.
For the quality control program, laboratory and field blank traps and spiked samples were utilized.
Specified portions of duplicate measurements of integrated samples were carried out during field sampling periods. The laboratory and field blank traps were investigated daily for trap contamination.
To determine the quantitative response, known VOC
standards were infused into an adsorbent trap to
transfer the target chemicals to the analytical
instrument. If the instrumental response differed by
more than ± 15% from that estimated by a specified
calibration curve, a new calibration curve was pre
-pared. Seven traps spiked with known amounts of
the target chemicals were utilized to prepare the
calibration curve. Analyses of 41 duplicate sampling
traps (23 and 18 for indoor and outdoor sampling
traps, respectively) displayed the relative standard
deviations <15% for the target chemicals.
Group Compounds Type Month
1-2 3-4 5-6 7-8 9-10 11-12 13-14 15-16 17-18 19-20 21-22 23-24
Alcohols
2-Ethyl-1-Hexanol (2E1H)
In 10.8 10.3 9.1 8.5 8.1 7.6 7.6 6.4 5.7 5.2 5.1 5.1
Out 1.5 1.6 1.7 1.3 1.3 2.0 1.2 1.6 1.5 1.2 1.2 1.6
Ethanol (EOL)
In 27 24 18 16 14 13 12 11 11 11 11 11
Out ND 1.6 1.3 1.3 1.6 1.6 1.6 1.7 1.4 1.4 1.3 1.5
1-Propanol (1POL)
In 15 14 11 10 9.4 8.5 7.2 6.3 5.6 5.3 5.4 5.3
Out 3.1 2.5 2.5 2.4 3.1 1.7 3.8 2.8 2.3 2.1 2.4 2.1
2-Propanol (2POL)
In 8.6 8.0 7.7 6.9 6.2 5.6 5.3 5.3 5.3 5.2 5.3 5.3
Out 3.9 2.4 1.9 3.8 3.8 3.7 4.4 2.2 1.7 1.7 3.8 2.5
Aldehydes
Decanal (DCA)
In 5.0 4.1 3.9 3.5 3.3 2.7 2.4 2.3 2.3 2.3 2.1 2.2
Out 1.0 1.1 1.1 1.0 0.9 0.8 1.0 0.8 0.9 1.1 0.9 1.1
Nonanal (NNA)
In 8.3 8.0 7.7 7.6 7.0 6.2 5.7 5.3 5.0 5.2 4.7 4.7
Out 1.1 1.1 1.1 0.9 0.8 0.8 1.0 0.8 1.1 0.8 0.8 0.8
Ketones
Acetone (ACT)
In 14 12 12 11 9.9 9.8 9.0 7.9 6.9 6.7 6.5 6.4
Out 2.8 2.6 2.7 2.3 2.3 3.0 2.2 2.6 2.5 2.2 2.2 2.6
2-Butanone (2BT)
In 13 12 11 10 9.8 9.0 8.6 7.7 6.5 5.9 5.8 5.6
Out 2.1 1.7 1.7 3.1 3.7 3.6 3.9 2.8 2.3 1.3 3.1 2.7
4-Methyl-2-pentanone (4M2P)
In 8.8 8.0 7.4 7.6 6.7 6.4 5.9 5.2 4.8 4.8 4.8 4.6
Out 2.4 2.4 2.3 2.2 2.4 2.5 2.0 1.9 1.5 1.3 2.2 2.4
*Abbreviation of each VOC is displayed in parenthesis; ND, not detected.
Table 1. Mean values of monthly indoor and outdoor concentrations ( /m3) obtained in apartments over a 2-y period*
2.3. Estimation of emission rates
Emission rates were estimated using the measured VOC concentrations and a mass balanced relationship:
ER = Q(C
in- C
out) (1)
where ER is the VOC source emission rate ( /h), C
inis the measured VOC concentration ( /m
3), C
outis the outdoor VOC concentration, and Q is the ventilation rate (m
3/h), which was determined by multiplying apartment volume (m
3) by air exchange rate (ACH, h
-1). ACHs were determined by the tracer CO
2gas decay method, when main doors and windows were left closed, but the room doors were left open to maintain better air mixing among rooms
within the apartment. Major assumptions made in this study are as follows: perfect mixing within the houses and no net loss of target chemicals from the air due to other effects, such as adsorption on the inner surface of the houses or chemical reactions.
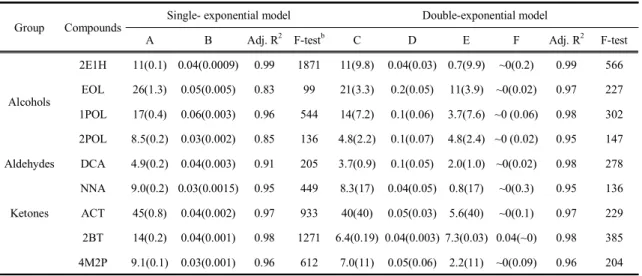
2.4. Development of exponential decay model The indoor VOC concentrations and their measure -ment times were stood for the following equations:
Y = A e
Btand Y = C e
Dt+ E e
Ft(2)
which matched to a single- and a double-type expon
-ential decay model, respectively. In these models, Y
is the VOC concentration determined at any time t,
A, C, and E are constants, and B, D and F are the
Group Compounds Month
1-2 3-4 5-6 7-8 9-10 11-12 13-14 15-16 17-18 19-20 21-22 23-24
Alcohols
2-Ethyl-1-Hexanol
(2E1H) 14 6.3 5.5 6.5 6.1 3.8 6.6 4.1 3.8 4.4 4.2 3.2
Ethanol
(EOL) 16 15 14 12 8.9 8.2 7.4 6.4 8.5 8.2 9.0 8.0
1-Propanol
(1POL) 4.9 5.7 4.5 4.2 3.1 5.2 1.9 2.2 2.4 2.6 2.3 2.5
2-Propanol
(2POL) 2.2 3.4 4.1 1.8 1.6 1.5 1.2 2.4 3.2 3.0 1.4 2.2
Aldehydes
Decanal
(DCA) 5.0 3.7 3.6 3.4 3.7 3.6 2.3 2.8 2.7 2.0 2.3 2.0
Nonanal
(NNA) 7.8 7.0 7.4 8.5 8.8 7.5 5.8 6.6 4.6 6.2 6.0 5.5
Ketones
Acetone
(ACT) 5.1 7.8 7.7 8.5 7.3 4.9 7.8 5.0 4.5 5.6 5.5 4.1
2-Butanone
(2BT) 6.1 7.1 6.4 3.3 2.6 2.5 2.2 2.7 2.9 4.4 1.8 2.0
4-Methyl-2-pentanone
(4M2P) 3.7 3.3 3.2 3.4 2.8 2.6 3.0 2.8 3.2 3.6 2.2 1.9
Table 2. Ratios of indoor to outdoor concentrations of selected VOCs measured in apartments over a 2-y period
exponential constants that are associated with the rate
of decay. Curve fitting was carried out by the nonlinear curve fitting program (Sigma Plot software, Jandel Scientific Software).
3. Results and Discussion
3.1. Temporal characteristics of selected VOCs The indoor and outdoor concentrations of nine selected VOCs were investigated in newly-construc -ted apartments over a 2-y period to assess the temporal characteristics of VOCs in the residences.
For many cases, the VOC concentration values were greater than the median values, suggesting the non- normal distribution of VOC concentrations. However, a normality test (Shapiro-Wilk) showed that the dis -tribution of VOC concentrations was log normal.
The temporal variations in indoor VOC concentra -tions measured in the survey apartments, along with VOC abbreviations, are displayed in Table 1. Here -after, the VOC abbreviations denoted in this table were utilized for brevity.
As displayed in Table 1, the indoor VOC concen -trations had generally a decreasing trend over the 2-y follow-up period. For examples, the 2E1H indoor concentration decreased from 10.8 /m
3for the first two months to 5.1 /m
3for the last two months. In addition, the DCA and ACT indoor concentrations decreased from 5.0 and 14 /m
3for the first two months to 2.2 and 6.4 /m
3, respectively, for the last two months. This descending tendency was ascribed to time-series decrease in VOC emissions of major indoor sources, including building finishing materials and furniture with time pass (Järnström et al., 2007;
Liu et al., 2013; Langer et al., 2015). Furthermore,
the indoor air concentrations of the 9 VOCs were
statistically higher than the outdoor air concentra
-tions, suggesting the influence of various indoor
sources, including building finishing materials and
furniture, for the target VOCs. In contrast to indoor
VOC concentrations, the outdoor VOC concentration
did not significantly vary with time. Specifically, the
2E1H outdoor concentration was 1.5 /m
3for the
first two months and 1.6 /m
3for the last two
months. Additionally, the DCA and ACT outdoor concentrations were 1.0 and 2.8 /m
3for the first two months to 1.1 and 2.6 /m
3, respectively, for the last two months. These results indicated that outdoor VOC source strengths did not substantially vary with time pass.
Outdoor VOC concentrations can affect the indoor VOC concentrations of residences by the penetration from outdoor environments into building interiors (Shin and Jo, 2013). As such, Table 2 shows the ratios of indoor to outdoor concentrations of indi -vidual 9 VOCs measured in apartments over a 2-y period. The indoor-to outdoor concentration ratios over the 2-y period were much greater than 1, indi -cating that indoor VOC concentrations were higher than the outdoor VOC concentrations. Specifically, the indoor-to outdoor concentration ratios ranged from 3.2 to 14 for 2E1H, from 2.0 to 5.0 for DCA, and from 4.1 to 5.1 for ACT. These findings suggest that outdoor VOCs do not significantly influence the indoor VOC concentration levels and that indoor VOC sources are primary cause for the indoor VOC concentrations (Bari et al., 2015).
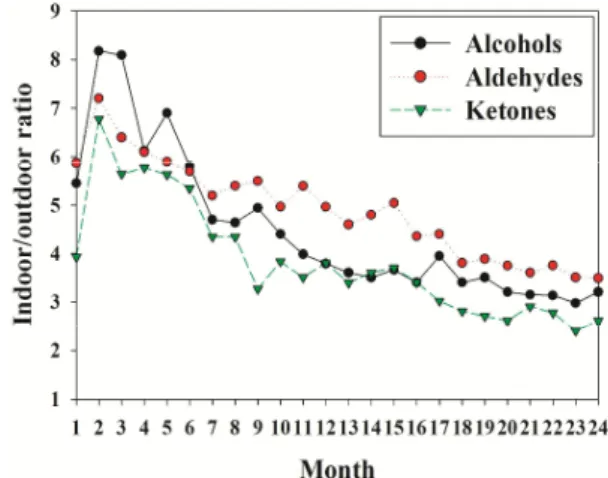
Figure 1 was also prepared to examine the relation -ships between indoor VOC concentrations standar -dized to outdoor VOC concentrations (indoor-to- outdoor concentration ratios) of three selected VOC groups (alcohols, aldehydes, and ketone groups) versus their measurement months. Similar to those of the individual VOCs, the indoor-to-outdoor concent -ration ratios of all three VOC groups were higher than 1 over the 2-y follow-up period, suggesting higher indoor concentrations of the three VOC groups than outdoor concentrations. Furthermore, the ratios of these VOC groups exhibited a descending trend over the 2-y follow-up period, while there was an initial sharp decrease in the ratios followed by a slower decrease over the rest follow-up period, indicating a multi-exponential decay model. Consistently, other research groups (Park and Ikeda, 2006; Tuomainen et
al., 2003) observed that certain VOC indoor concent -rations decreased gradually over 3-y follow-up periods. In addition, a great deal of research groups reported that indoor VOC concentrations were typically higher than outdoor VOC concentrations in residential, school, hair salon, and office buildings (Cometto-Muñiz and Abraham, 2015; de Gennaro et al., 2014; Do et al., 2015; Gokhale et al., 2008;
Mishra et al., 2015; Su et al., 2013; Uchiyama et al., 2015; Wangchuk et al., 2015).
Fig. 1. Temporal variations in ratios of indoor to outdoor concentrations of selected VOC groups (alcohols, aldehydes, ketones).
Table 3 reveals the emission rates of 9 selected
VOCs (2E1H, EOL, 1POL, 2POL, DCA, NNA,
ACT, 2BT, and 4M2P) estimated for the investigated
apartments according to survey period. Generally,
EOL displayed the highest emission rates for the first
two months with a value of 2162 /h, followed by
1POL (1046 /h), ACT (988 /h), 2BT (911 /h),
2E1H (854 /h), NNA (615 /h), 4M2P (546 /h),
2POL (401 /h), and DCA (341 /h). Although
some exceptional cases, this pattern was applicable to
the rest follow-period results. In consistence with the
results of VOC indoor concentrations, the VOC
emission rates decreased gradually as time passed,
Group Compounds Month
1-2 3-4 5-6 7-8 9-10 11-12 13-14 15-16 17-18 19-20 21-22 23-24 Alcohols 2-Ethyl-1-Hexanol
(2E1H) 854 735 635 615 576 478 547 407 358 345 329 297
Ethanol
(EOL) 2162 1956 1447 1238 1043 951 865 779 890 862 857 866
1-Propanol
(1POL) 1046 1007 735 651 536 586 285 296 280 278 256 275
2-Propanol
(2POL) 401 479 491 257 208 164 180 264 309 298 127 242
Aldehydes Decanal
(DCA) 341 253 240 214 206 165 115 128 122 98 103 32
Nonanal
(NNA) 615 586 568 570 527 458 404 381 332 367 334 325
Ketones Acetone
(ACT) 988 941 943 836 720 671 669 535 458 466 455 410
2-Butanone
(2BT) 911 870 788 598 515 461 402 415 362 389 223 243
4-Methyl-2-pentanone
(4M2P) 546 473 435 454 366 331 335 288 281 291 223 191
Table 3. Emission rates ( /h) of selected VOC groups standardized to the number of VOC species according to survey period
Apartment
ID ACH
Indoor concentration of total VOCs Month
1-2 3-4 5-6 7-8 9-10 11-12 13-14 15-16 17-18 19-20 21-22 23-24
1 0.41 136 127 97 99 93 97 92 76 54 72 64 52
2 0.44 132 122 96 90 79 73 56 52 49 38 53 40
3 0.42 78 84 76 70 69 70 59 54 49 58 51 43
4 0.38 95 98 90 77 72 59 56 51 57 48 41 40
5 0.42 103 106 85 74 77 64 67 51 49 60 44 55
6 0.42 99 100 89 76 79 64 59 63 56 49 59 47
7 0.37 156 141 126 115 104 100 97 86 80 75 71 62
8 0.41 109 95 79 74 67 69 64 50 65 43 46 43
9 0.43 134 92 97 76 75 56 51 55 57 47 53 56
10 0.60 116 124 94 79 82 74 69 61 60 51 50 53
Table 4. Indoor concentrations ( /m3) of total VOCs and air exchange rates (ACH, h-1) estimated in apartments
due to the decreased VOC emission strengths of
indoor sources (Chen et al., 2014; Han et al., 2011;
Wang et al., 2015).
The indoor concentrations of total VOCs and ACH values measured in ten selected apartments during are shown in Table 4. For the apartments, the total VOC
concentration for the first two months were higher
than those for the rest follow periods. As mentioned
previously, these findings are attributed to additional
emissions of total VOCs from building finishing
materials, furniture, and consumer products since
residents have moved into the apartments (Chen et
Group Compounds Single- exponential model Double-exponential model
A B Adj. R2 F-testb C D E F Adj. R2 F-test
Alcohols
2E1H 11(0.1) 0.04(0.0009) 0.99 1871 11(9.8) 0.04(0.03) 0.7(9.9) ~0(0.2) 0.99 566 EOL 26(1.3) 0.05(0.005) 0.83 99 21(3.3) 0.2(0.05) 11(3.9) ~0(0.02) 0.97 227 1POL 17(0.4) 0.06(0.003) 0.96 544 14(7.2) 0.1(0.06) 3.7(7.6) ~0 (0.06) 0.98 302 2POL 8.5(0.2) 0.03(0.002) 0.85 136 4.8(2.2) 0.1(0.07) 4.8(2.4) ~0 (0.02) 0.95 147 Aldehydes DCA 4.9(0.2) 0.04(0.003) 0.91 205 3.7(0.9) 0.1(0.05) 2.0(1.0) ~0(0.02) 0.98 278 NNA 9.0(0.2) 0.03(0.0015) 0.95 449 8.3(17) 0.04(0.05) 0.8(17) ~0(0.3) 0.95 136 Ketones ACT 45(0.8) 0.04(0.002) 0.97 933 40(40) 0.05(0.03) 5.6(40) ~0(0.1) 0.97 229 2BT 14(0.2) 0.04(0.001) 0.98 1271 6.4(0.19) 0.04(0.003) 7.3(0.03) 0.04(~0) 0.98 385 4M2P 9.1(0.1) 0.03(0.001) 0.96 612 7.0(11) 0.05(0.06) 2.2(11) ~0(0.09) 0.96 204
a The numbers in parenthesis are the standard error values; A, C, and E are constants, and B, D and F are the exponential constants that are associated with the rate of decay.
b F-test value.
Table 5. Modeling values of one- and two-exponential models for VOC concentrations determined in apartments monthly over a 2-y perioda