양양군 국유림 지역의 음이온 농도와 임상, 숲 관련인자와의 상관
1a엄태원2*․김갑태2
Correlations Between Concentrations of Negative Ions and Forest Type, and Site Factors at National Forests in Yangyang-gun
1aTae-Won Um2*, Gab-Tae Kim2
요 약
본 숲에서 발생하는 음이온의 농도가 임상과 숲 관련인자에 따른 변이를 파악하고자, 강원도 고성군, 양양군에 위치한 국유림지역에서 52개의 방형구에서 산림조사와 음이온의 농도를 측정하고 관련성을 분석하였다. 측정된 음이온 의 평균값 2,405개/㎤는 일반적인 숲에서 보고된 2,000개/㎤ 보다는 조금 높은 값이었다. 음이온 농도와 지형에서는 5% 유의수준에서, 음이온 농도와 토양수분, 해발고에서는 1% 유의수준에서 각각 정의 상관이 인정되었다. 조사지의 음이온 농도는 토양수분 수준간 고도의 통계적 유의성이 인정되었으며, 다습한 지역에서 평균 음이온 농도가 4,524.4개/
㎤로 가장 높았다. 지형에서는 계곡부 조사지의 평균 음이온 농도가 3,372.4개/㎤로 가장 높았으며, 사면, 능선 순으로 점차 낮아지는 경향을 보였다. 측정시간대에서는 오전(12시 이전)에 측정된 평균 음이온 농도가 3,133.4개/㎤로 가장 높았으며, 낮(12:00~15:00), 저녁(15시 이후) 순으로 점차 낮아지는 경향을 보였다. 임상에서는 활엽수 혼효림에서 측정된 평균 음이온 농도가 3,503.9개/㎤로 가장 높았으며, 참나무림, 소나무림, 소나무-참나무 혼효림 순으로 점차 낮아지는 경향을 보였다. 이 연구의 결과는 치유의 숲 입지선정에 활용할 수 있을 것이라 사료된다.
주요어: 토양수분, 지형, 산림세라피
1 접수 2010년 5월 4일, 수정(1차: 2010년 10월 14일, 2차: 2010년 10월 19일), 게재확정 2010년 10월 20일 Received 4 May 2010; Revised(1st: 14 October 2010, 2nd: 19 October 2010); Accepted 20 October 2010
2 상지대학교 산림과학과 Dept. of Forest Sciences, College of Life Sci. & Resour., Sangji Univ., Wonju(220-702), Korea a 이 논문의 일부는 2006년 상지대학교 교내연구비 지원에 의한 것임.
* 교신저자 Corresponding author([email protected])
ABSTRACT
To investigate the variation of anion concentrations in relation to forest type, forest-related factors, forest survey and anion concentrations measurement were carried out on the 52 quadrats located at the national forest areas in Yangyang-gun, Kangwon-do. The relationship between anion concentrations and forest-related factors were correlated. Total mean of anion concentration was 2,405 ea/㎤, which was slightly higher than general figures 2,000ea/㎤. Highly significant positive correlations were observed between anion concentrations and soil moisture contents, and also between anion concentrations and altitude. Significant positive correlations were observed between anion concentrations and topography. Anion concentrations were significantly different among soil moisture levels. Mean anion concentration were highest at 4,524.4ea/㎤ in on wet sites, and followed slightly wet sites and moderate sites. Mean anion concentrations was highest on valley sites at 3,372.4ea/㎤, followed by slope and ridge areas. Mean anion concentrations measured before noon was highest
Figure 1. The Location map of the survey plots at 3,133.4ea/㎤, and measurements during 12:00~15:00 and after 15:00, showed relatively low anion concentrations. Mean anion concentrations was highest at mixed deciduous forests at 3,503.9ea/㎤, followed by oak forests, pine forests, and pine-oak forests. Results of this study are expected to be used in planning therapeutic forests.
KEY WORDS: SOIL MOISTURE, TOPOGRAPHY, FOREST THERAPHY
서 론
산림휴양 활동의 효과는 매우 다양하게 설명되고 있으며, 많은 사람들이 숲을 찾고 있으며 앞으로 더욱 증가할 것으 로 추정된다. 인류는 오랫동안 자연환경 특히, 숲에서 생활 해 왔고 인위적 환경보다 숲이라는 자연환경 속에서 심리 적, 생리적으로 안정되며 스트레스가 없어지는 등으로 면역 력이 높아지고 심리적 치유가 가능하다는 산림치유의 효능 에 대한 연구가 국내외에서 입증되고 있다(Yoshihumi and Park, 2008; Kim seon kyu, 2007; Kukovinets, et al., 2006;
Krueger and Reed, 1976; Lips et al., 1987; Reilly and Stevenson, 1993). 산림청에서도 국민의 여가 문화와 휴양 을 위하여 경관이 뛰어난 국 ․ 공유림을 대상으로 1988년부 터 자연휴양림을 조성하고, 각 휴양림마다 산림욕장을 개설 하였다. 2008년 산림문화․휴양에 관한 법률이 발효된 이후 산림청에서는 다양한 숲을 통한 문화와 휴양수요에 대처하 기 위한 치유의 숲 조성 등 많은 노력을 기울이고 있다.
숲의 건강증진 효과에 대한 연구는 다양하게 진행되고 있으 나(Kim Ki Weon, 2006; Kim Se-Cheon et al., 2009; Kim si gyung et al., 2008; Kim yeong yong, 2006; Kim one, 2007; Park sung hyun, 2007; Yoo rhee hwa & Jeong seong ae, 2009; Lim young seuk, 2008; Cah youn jung, 1995), 대부분의 연구가 치유의 숲 설계기준, 정책적인 면, 시설의 계획 등이거나 숲의 치유효과에 대한 과학적 근거가 조금은 부족한 실정이다.
일본을 중심으로 산림세라피(forest theraphy)에 대한 건 강증진 효과에 대한 연구가 시도되고 있으며(Yoshihumi and Park, 2008), 숲에서 발생하는 피톤치드(Kim Seon Kyu, 2007; Kukovinets et al., 2006; Kukovinets, et al., 2006)와 음이온(Kim yu chang et al., 2000; Jee cheol geun, 2003; Krueger & Reed, 1976; Lips et al., 1987; Reilly
& Stevenson, 1993)이 건강증진에 효과적임을 보고하였다.
수목이 발산하는 피톤치드(테르펜)가 병원균을 죽이고 스 트레스를 없애 심신을 순화하고 여러 가지 질병을 예방하는 효과를 가지며, 울창한 숲에서 발생하는 음이온을 마시면 세포의 신진대사를 촉진하고 활력을 증진시키며 피를 맑게
하고 신경안정과 피로회복, 식욕증진의 효과가 있으므로 각 종 문명질환을 치유하는 효과를 가진다(Shin weon sup, 2005; Jee cheol geun, 2003; Cah youn jung, 1995; Um Tae Won et al., 2009; Karjalainen et al., 2010).
이에 이 연구는 숲에서 발생하는 음이온 농도가 임상과 환경 인자에 따라 어떠한 변이를 보이는지 파악하고자 강원 도 양양군에 위치한 양양국유림관리소 관내 국유림지역을 대상으로 식생조사와 음이온의 농도를 측정하고 관련성을 분석하였다.
재료 및 방법
1. 식생조사
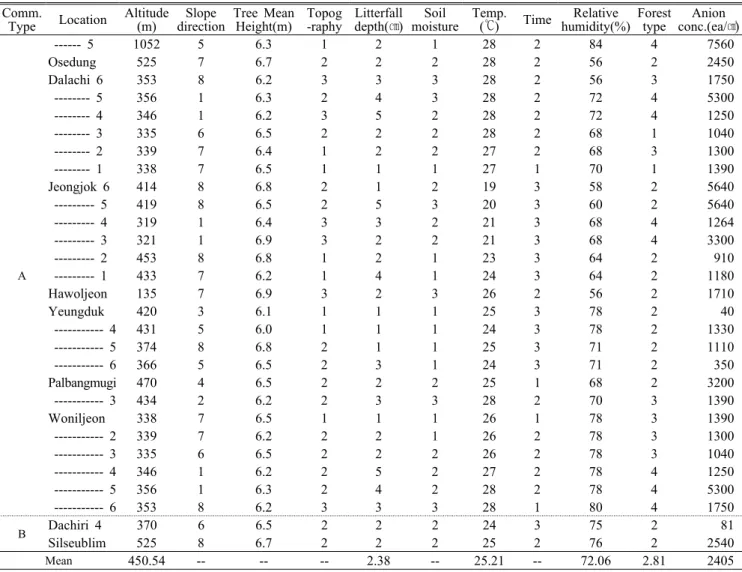
양양국유림관리소가 관리하는 4개의 경영계획구(양양 36,789ha, 현북 8,440ha, 제1실습림 1,692ha, 제2실습림 1,692ha) 총 48,613ha의 국유림을 대상으로 천연림 상태를 유지하고 있는 임분에서 현존식생, 지형, 사면방위를 고려 하여 총 52개의 방형구(20m x 20m)를 설치하고 주요 입지 인자, 토양특성, 매목조사 및 음이온 농도를 측정하였다 (Figure 1). 식생조사는 각 조사구에 대하여 수관의 위치에 따라 상․중․하층으로 구분하여 수종과 흉고직경을 측정하여 식생조사표에 기록하였다. 숲에서 발생되는 음이온의 농도 와 관련성을 알아보고자 해발고, 방위, 경사도, 평균수고, 낙엽퇴, 표토층 깊이, 지형 등을 함께 조사하였다.
2. 음이온 농도 측정
기상조건에 따라 민감하게 변화되는 음이온 농도와 숲 관련인자와의 관련성을 파악하고자 2008년 7월 2일부터 4일, 8월 18일부터 21일 사이에 집중적으로 조사하였으며, 식생조사 중에 방형구 중앙부위에 음이온 측정기(ITC-201A, 일본 제품)를 지상에서 5㎝ 정도 띄워서 작동시키고 10분이 지난 후의 측정값을 기록하였으며, 측정 시의 기온과 상대 습도, 측정시각을 기록하였다.
3. 상관관계 및 분산분석
음이온 농도와 임상 및 숲 관련인자와 상관관계 및 관련 인자들 간의 분산분석은 SPSS(ver 10.1)을 이용하여 분석 하였다. 음이온 농도와 숲 관련인자 간의 상관분석을 위하 여 해발고, 낙엽퇴 등은 측정치를 그대로 이용하였으며, 다 른 숲 관련인자들은 다음과 같이 수치화하여 분석하였다.
∙ 식생형 : 소나무림 1, 참나무림 2, 침활혼효림 3, 활엽수 혼효림 4
∙ 지형 특성 : 능선 1, 사면 2, 계곡 3
∙ 토양수분 : 간이토양수분 측정기로 측정; 보통 1, 습 2, 다습 3
∙ 사면 방위 : 북 1, 북서 2, 북동 3, 서 4, 동 5,남서 6, 남동 7, 남 8
∙ 시간 : 오전 9시~12시 1, 오후 12시~3시 2, 오후 3시~6시 3
결과 및 고찰
1. 숲의 일반적 특성과 음이온 농도
1) 군집분류 및 층위별 상대우점치
각 조사구들을 Cluster분석한 결과에 따라 2개의 군집으 로 분류되었다. 군집별 나타난 주요 수종에 대한 수종별 상 대우점치(Importance percentage, I.P)를 Table 1에 보였다.
신갈나무혼효림군집(A)은 신갈나무의 평균상대우점치가 20%로 가장 높은 값을 나타냈으며, 다음으로 굴참나무가 13.2%로 나타났다. 그 다음은 소나무(10.0%), 졸참나무 (6.8%), 당단풍(6.8%)순으로 나타났다. 굴참나무군집(B) 또한 해발고가 낮고 산복부에 위치한 조사구들로 굴참나무 의 평균상대우점치(M.I.P)가 42.5%로 가장 높았고, 다음으 로 신갈나무(28.0%), 조록싸리(6.5%), 물푸레(5.0%)순으로 나타났다.
층위별 상대우점치(IP)는 신갈나무혼효군집(A)의 경우 상층에서는 신갈나무의 상대우점치가 25.2%로 가장 높게 나타났고, 다음으로 굴참나무(20.8%), 소나무(18.0%), 졸 참나무(10.6%)순으로 나타났다. 중층에서는 신갈나무와 당 단풍나무의 상대우점치가 18.6%, 16.3%로 높은 값을 나타 냈으며 쪽동백나무와 굴참나무가 9%, 8%로 그 다음이었 다. 하층에서는 생강나무(15.1%), 조록싸리(14.9%), 철쭉 (9%) 순으로 골고루 차지하고 있었다.
굴참나무군집(B)의 경우 상층에서는 굴참나무의 상대우 점치가 70%로 가장 높았으며, 다음으로 신갈나무(16%), 졸 참나무(7%), 물푸레나무(6%) 순으로 나타났다. 중층에서 는 신갈나무의 상대우점치가 54%로 높았고, 굴참나무 (18%), 산벚나무(9%), 소나무(6%) 순으로 나타났으며, 하 층에서는 조록싸리가 21%로 가장 높고, 다음으로 신갈나무 (12%), 굴참나무(9%), 난티잎개암나무(9%) 순으로 상대우 점치가 높게 나타났다(Table 1).
2) 흉고직경급 분포
2개의 군집으로 분류된 신갈나무혼효군집(A) 흉고직경 의 분포는 소경목과 중경목의 비가 높아 역 J자 모양에서 종 모양으로 바뀌어가고 있는 모양을 나타내고 있으며, 가 장 많은 밀도를 가지고 있는 신갈나무의 흉고직경급 분포는 2㎝급 17.5%, 3∼7㎝급 28.4%, 8∼12㎝급 45.3%, 13∼17
㎝급 41.3%, 18∼22㎝급 24.0%, 23∼27㎝급 19.5%, 28∼
32㎝급 14.5%, 33∼37㎝급 28.0%, 38∼42㎝급 29.5%, 43
㎝이상급 25.0%로 8∼12㎝급의 비율이 가장 높았다. 그리 고 신갈나무, 굴참나무, 소나무가 비교적 다양한 직경급에 서 출현하고 있으며, 다음으로 졸참나무, 물푸레나무가 많 이 출현하는 것으로 나타났다. 흉고직경 30㎝ 이상의 중경 급은 신갈나무, 굴참나무, 소나무, 졸참나무가 많이 분포하 고 있으며 대부분 수종들의 직경은 20㎝이하의 소경급에 분포하고 있는 것으로 조사되었다.
Plant community Species name
Quercus mongolica-Mixed Broad leaved community(A)
U* M* L* M.I.P(%)
Quercus mongolica 25.2 18.6 7.0 20.0
Quercus variabilis 20.8 7.3 1.9 13.2
Pinus densiflora 18.0 2.6 0.6 10.0
Quercus serrata 10.6 3.7 1.6 6.8
Acer pseudosieboldianum 0.7 16.3 6.0 6.8
Styrax obassia 1.0 8.9 4.1 4.1
Lindera obtusiloba - 4.3 15.1 3.9
Fraxinus rhynchophylla 3.7 4.0 2.8 3.7
Lespedeza maximowiczii - - 14.9 2.5
Rhododendron schlippenbachii - 0.8 9.3 1.8
Tilia amurensis 2.1 1.7 0.6 1.7
Tilia mandshurica 2.5 0.8 0.3 1.6
Carpinus laxiflora - 4.1 1.0 1.5
Fraxinus mandshurica 2.2 1.0 0.2 1.4
Acer okamotoanum 1.1 2.1 0.8 1.4
Pinus koraiensis 1.0 1.7 0.6 1.2
Sorbus alnifolia 0.7 1.7 1.1 1.1
Betula schmidtii 1.6 0.7 0.2 1.1
Maackia amurensis 1.1 1.3 0.4 1.1
Magnolia sieboldii - 2.4 1.2 1.0
Quercus variabilis community(B)
U* M* L* M.I.P(%)
Quercus variabilis 70.0 18.0 9.0 42.5
Quercus mongolica 16.0 54.0 12.0 28.0
Lespedeza maximowiczii - - 39.0 6.5
Fraxinus rhynchophylla 6.0 4.0 4.0 5.0
Quercus serrata 7.0 - 2.0 3.8
Prunus sargentii - 9.0 2.0 3.3
Lindera obtusiloba - 5.0 7.0 2.8
Pinus densiflora - 6.0 - 2.0
Styrax obassia - 4.0 2.0 1.7
Corylus heterophylla - - 9.0 1.5
*U: Upper layer(%), M: Middle layer(%), L: Lower layer(%)
Table 1. Importance percentage(I.P.) and mean importance percentage(M.I.P.) of major woody species
굴참나무군집(B)에서는 밀도는 적지만 굴참나무가 대체 로 고르게 중경목 직경급을 차지하고 종 모양을 나타냈으 며, 밀도가 적은 이유는 굴참나무로 이루어진 군집의 수가 적고 산림경영에 의해 인위적으로 간벌을 실시 한 것으로 보여 진다. 신갈나무치수들이 많은 것으로 보아 점차 굴참 나무와 신갈나무중심의 활엽수림으로 성장할 것으로 판단 된다(Table 2).
3) 음이온 농도
16개 리에 분포하는 52개 조사구에서 측정된 음이온 농
도, 지형, 식생상관, 관련 인자들을 Table 3에 보였다. 음이 온 농도의 평균은 2,405개/㎤로 나타났으며, 범위는 40~12,700개/㎤로 변이폭이 매우 넓었다. 이는 대기 중의 음이온 농도가 여러 가지 인자들의 영향을 받으며 끊임없이 변화하는 특성을 가졌기 때문이라 추정된다. 측정된 음이온 의 평균값 2,405개/㎤는 일반적인 숲속 2,000개/㎤(Jee cheol geun, 2003) 보다는 조금 높은 값이라 판단되며, 도시, 공업지대 및 아파트 실내의 500~1,800개/㎤(Jee cheol geun, 2003)보다는 높은 값으로 숲에서의 음이온의 건강증 진 효과(Kim yu chang et al., 2000; Jee cheol geun, 2003;
Plant community Species name D1 D2 D3 D4 D5 D6 D7 D8 D9 D10
Quercus mongolica-Mixed
Broad Ieaved community(A)
Quercus mongolica 124 487 518 231 95 45 20 21 13 12
Acer pseudosieboldianum 270 611 112 13 4 1
Quercus variabilis 50 97 188 181 153 78 37 21 9 3
Styrax obassia 86 231 89 8 2 1
Pinus densiflora 7 17 54 54 90 67 58 20 17 26
Quercus serrata 28 50 67 48 42 32 18 10 3 7
Fraxinus rhynchophylla 25 85 61 19 6 8 4 3 2
Lindera obtusiloba 103 71 9
Carpinus laxiflora 17 68 45 5 4
Quercus variabilis- community(B)
Quercus variabilis 4 16 20 9 1
Quercus mongolica 6 13 25 4
Prunus sargentii 5 3
Lindera obtusiloba 2 1
* D1: DBH=2, D2: 2<DBH≤7, D3: 7<DBH≤12, D4: 12<DBH≤17, D5: 17<DBH≤22, D6: 22<DBH≤27
Table 2. The DBH distribution of major woody species for each plant community in the national forest area
Comm.
Type Location Altitude
(m) Slope
direction Tree Mean
Height(m) Topog
-raphy Litterfall depth(㎝) Soil
moisture Temp.
(℃) Time Relative
humidity(%) Forest
type Anion conc.(ea/㎤)
A
Gadunji 5 349 3 7 2 2 2 24 3 72 2 1720
--- 3 384 3 7 1 3 2 24 2 77 2 880
--- 2 419 1 6.5 2 3 2 25 2 72 2 1010
--- 1 384 8 6.7 2 1 2 26 2 66 2 860
Goseung 3 419 2 7 2 5 1 21 2 89 4 113
--- 2 452 1 6.8 1 4 1 29 1 90 2 98
--- 1 617 6 6.3 1 3 1 24 1 88 3 249
Dachiri 1 617 3 6.8 2 4 1 25 3 82 2 1370
Dowonri 388 3 5.8 2 0 1 26 1 81 2 2070
Myunokjiri 1 276 7 6.5 1 3 1 25 2 56 2 1680
--- 3 338 5 6.6 3 2 1 25 2 58 2 3080
--- 5 400 1 5.8 2 3 1 22 3 68 3 790
Michongol 1 470 4 6.5 1 3 1 24 3 56 3 330
--- 2 540 2 6.8 1 2 1 24 2 58 4 770
--- 3 555 4 6.5 2 2 3 25 2 72 4 1760
--- 4 539 4 6.8 2 2 2 25 2 72 4 1010
--- 5 539 1 6.3 2 2 2 26 2 68 4 1760
--- 6 512 8 6.4 3 1 2 25 2 65 4 2950
Baltakgoge 341 7 6.0 2 2 2 27 2 79 3 1890
Alpus 1 724 4 6.7 3 2 3 22 1 89 4 8720
--- 2 767 4 6.4 3 1 2 26 1 80 4 7950
--- 3 1036 8 6.3 2 1 3 26 2 84 2 1270
--- 4 767 4 6.4 2 1 2 28 2 84 4 7560
Table 3. List of major site factors, anion concentrations and forest types for each survey sites Krueger & Reed, 1976; Lips et al., 1987; Reilly &
Stevenson, 1993)를 얻을 수 있을 것이라 판단된다. 조사 당시의 평균기온은 25.21℃였으며, 범위는 19~29℃였다.
상대습도의 평균은 72.06%, 해발고의 평균은 450.54m였으 며, 범위는 135 ~ 1,052m 이었다(Table 3).
2. 조사지의 음이온 농도와 숲의 일반적 특성들 간의 상관관계
조사지의 음이온 농도와 숲 관련인자들 간의 pearson의 상관계수를 Table 4에 보였다. 음이온 농도와 지형에서는
Comm.
Type Location Altitude
(m) Slope
direction Tree Mean
Height(m) Topog
-raphy Litterfall depth(㎝) Soil
moisture Temp.
(℃) Time Relative
humidity(%) Forest
type Anion conc.(ea/㎤)
A
--- 5 1052 5 6.3 1 2 1 28 2 84 4 7560
Osedung 525 7 6.7 2 2 2 28 2 56 2 2450
Dalachi 6 353 8 6.2 3 3 3 28 2 56 3 1750
--- 5 356 1 6.3 2 4 3 28 2 72 4 5300
--- 4 346 1 6.2 3 5 2 28 2 72 4 1250
--- 3 335 6 6.5 2 2 2 28 2 68 1 1040
--- 2 339 7 6.4 1 2 2 27 2 68 3 1300
--- 1 338 7 6.5 1 1 1 27 1 70 1 1390
Jeongjok 6 414 8 6.8 2 1 2 19 3 58 2 5640
--- 5 419 8 6.5 2 5 3 20 3 60 2 5640
--- 4 319 1 6.4 3 3 2 21 3 68 4 1264
--- 3 321 1 6.9 3 2 2 21 3 68 4 3300
--- 2 453 8 6.8 1 2 1 23 3 64 2 910
--- 1 433 7 6.2 1 4 1 24 3 64 2 1180
Hawoljeon 135 7 6.9 3 2 3 26 2 56 2 1710
Yeungduk 420 3 6.1 1 1 1 25 3 78 2 40
--- 4 431 5 6.0 1 1 1 24 3 78 2 1330
--- 5 374 8 6.8 2 1 1 25 3 71 2 1110
--- 6 366 5 6.5 2 3 1 24 3 71 2 350
Palbangmugi 470 4 6.5 2 2 2 25 1 68 2 3200
--- 3 434 2 6.2 2 3 3 28 2 70 3 1390
Woniljeon 338 7 6.5 1 1 1 26 1 78 3 1390
--- 2 339 7 6.2 2 2 1 26 2 78 3 1300
--- 3 335 6 6.5 2 2 2 26 2 78 3 1040
--- 4 346 1 6.2 2 5 2 27 2 78 4 1250
--- 5 356 1 6.3 2 4 2 28 2 78 4 5300
--- 6 353 8 6.2 3 3 3 28 1 80 4 1750
B Dachiri 4 370 6 6.5 2 2 2 24 3 75 2 81
Silseublim 525 8 6.7 2 2 2 25 2 76 2 2540
Mean 450.54 -- -- -- 2.38 -- 25.21 -- 72.06 2.81 2405
Table 3. (Continued)
Temp.
(℃) Time Relative
humidity(%) Forest
physiognomy Topogr
-aphy Soil
moisture Litterfall
depth(㎝) Altitude
(m) Slope direction Anion conc.(ea/㎤) .015 -.176 .209 .215 .277* .419** -.141 .567** .050
*, ** indicate significant at the 0.05, 0.01 level(2tailed).
Table 4. Pearson's correlation coefficients between anion concentrations and forest types, and site factors
5% 유의수준에서, 음이온 농도와 토양수분, 해발고에서는 1% 유의수준에서 각각 정의 상관이 인정되었다. 이는 음이 온 농도는 능선에서 계곡부로 갈수록, 토양수분과 해발고가 높을수록 높아진다는 의미이다. 온도, 측정시각, 식생상관, 낙엽퇴 및 사면방위와는 일정한 상관이 인정되지 않았다.
이러한 결과는 좁은 지역이며 관련인자들의 변이가 크지 않은 국유림에서의 측정이라는 제한이 있었기에 나타난 결 과라 판단되며, 향후 더 연구할 필요가 있다고 판단된다.
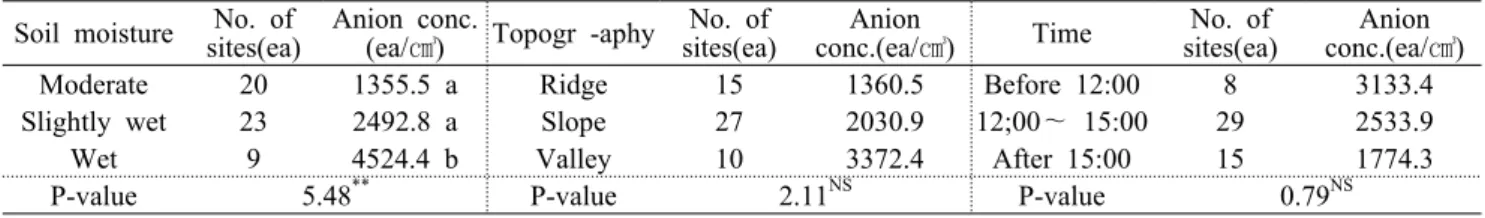
3. 숲의 일반적 특성들 간의 음이온 농도 비교 숲 관련인자들의 수준별 평균 음이온 농도와 통계처리 결과를 Table 5, 6에 보였다. 조사지의 음이온 농도는 토양 수분 수준간 고도의 통계적 유의성이 인정되었으나, 지형, 측정시간대 및 임상 간에는 통계적 유의성이 인정되지 않았 다. 토양수분 조건이 다습한 지역에서 평균 음이온 농도가 4,524.4개/㎤로 가장 높았으며, 여타 지역과의 통계적 유의
Soil moisture No. of
sites(ea) Anion conc.
(ea/㎤) Topogr -aphy No. of
sites(ea) Anion
conc.(ea/㎤) Time No. of
sites(ea) Anion conc.(ea/㎤)
Moderate 20 1355.5 a Ridge 15 1360.5 Before 12:00 8 3133.4
Slightly wet 23 2492.8 a Slope 27 2030.9 12;00~ 15:00 29 2533.9
Wet 9 4524.4 b Valley 10 3372.4 After 15:00 15 1774.3
P-value 5.48** P-value 2.11NS P-value 0.79NS
* and ** indicate significant at the 0.05and 0.01 level(2tailed).
Differences in letters in vertical columns indicates difference at 5% level for Duncan test.
Table 5. Mean anion concentrations for each site factors
Forest physiognomy No. of sites (ea)
Anion conc.
(ea/㎤)
Pine forest 2 1215.0
Oak forest 23 2249.5
Pine-oak forest 10 1142.9
Mixed broadleaved forest 17 3503.9
P-value 2.11NS
Table 6. Mean anion concentrations for each forest physiognomy
차가 인정되었다(Table 5). 지형 간 통계적 유의차는 인정되 지 않았으나 계곡부 조사지의 평균 음이온 농도가 3,372.4 개/㎤로 가장 높았으며, 사면, 능선 순으로 점차 낮아지는 경향을 보였다. 측정시간대 간 통계적 유의차는 인정되지 않았으나 오전(12시 이전)에 측정된 평균 음이온 농도가 3,133.4개/㎤로 가장 높았으며, 낮(12:00`15:00), 저녁(15시 이후) 순으로 점차 낮아지는 경향을 보였다. 임상 간 통계적 유의차는 인정되지 않았으나 활엽수 혼효림에서 측정된 평 균 음이온 농도가 3,503.9개/㎤로 가장 높았으며, 참나무림, 소나무림, 참나무-소나무 혼효림 순으로 점차 낮아지는 경 향을 보였다(Table 6).
음이온 농도가 임상별, 지형별, 토양수분별 변이를 나타 내는 이 연구의 결과를 고려할 때, 치유의 숲, 자연휴양림의 입지선정에 활용할 수 있을 것이라 사료된다.
인용문헌
Cha, Y.J.(1995) Sanrimyok a trip to the woods. Donghaksa. 262pp.
Jee, C.G.(2003) Effect of anion - Govern health anion-. Living Books. p.171
Karjalainen, E., T. Sarjala and H. Raitio(2010) Promoting human health through forests: Overview and major challenges.
Environ. Health Prev. Med. 15: 1-8.
Kim, K.W.(2006) Theoretical Study of Characteristics of Therapeutic Elements and Application to Forest Therapy.
Korean society for People, Plants and Environment 9(4):
111-123.
Kim, O.(2007) Possibility of the use of forests In the treatment of depression. Symposium Proceedings ‘Health of the forest’, pp.
59-64., Sponsored by Korea Forest Service, Subjective Korea Forest Research Institute, Forest Healing Forum(2007).
Kim, S.C., Y.H. Han, K.U. Park and H.K. Oh(2009) Improvement Methods of the Forest Therapeutic Function in Recreational Forest. Institute Of Forest Recreation 12(4): 1-8.
Kim, S.G., W.S. Sin, M.G. Kim, P.S. Yeon, J.H. Pack and R.H.
Yu(2008) The Effects of Negative Ions on Stress Responses and Cognitive Functions. The Journal of Korean Forestry 98(4): 1-8.
Kim, S.K.(2007) P. Activity of gingivalis phytoncide. Kyunghee University, 27pp.
Kim, Y.C., C.M. Lee, Y.H. Lee and H.W. Jeong(2000) Effect of anions on the mental workload. Ergonomics Society of Korea Proceedings, pp. 217-220.
Kim, Y.Y.(2006) Phytoncide and health of forests. Cheju National University of Education Society 35: 281-303.
Krueger, A.P. and E.J. Reed(1976) Biological impact of small air ions. Science 193(4259): 1209-1213.
Kukovinets, O.S., R.A. Zainullin and M.I. Kislitsyn(2006) Natural Arylterpenes and their Biological Activity. Chemistry of Natural Compounds 42(1): 1-15.
Lim, Y.S.(2008) A study on the healing of the Forest Plan standards.
Seoul National University Graduate School of Environmental Master's Thesis, 154pp.
Lips, R., H.T. Salawu, P. Kember and S.D. Probert(1987) Intermittent exposures to enhanced air-ion concentrations for improved comfort and increased productivity? Applied Energy 28(2): 83-94.
Park, S.H.(2007) Environment in the surgery room, recovery of the vegetation on the therapeutic effects. Symposium Proceedings
‘From the forest health’ pp. 89-91, Sponsored by Korea Forest Service Subjective Korea Forest Research Institute, Forest Healing Forum(2007).
Reilly, T and I.C. Stevenson(1993) An investigation of the effects of negative air ions on responses to submaximal exercise at dif-
ferent times of day. J. Hum. Ergol. (Tokyo) 22(1): 1-9.
Shin, W.S.(2005) Healing Forest. MOONJI PUBLISHING, 222pp.
Um, T.W., G.T. Kim, Y.J. Lim and H.G. Lee(2009) Forests and Health. Sang Ji University, 282pp.
Yoo, R.H. and S.A. Jeong(2009) A Case Study on Application of the Effect Using Forest on Human Health Improvement and Disease Prevention - Focusing on the Forest Therapy
Certification in Japan -. Korean Institute of Forest Recreation 13(2): 45-51.
Yoshihumi, M. and B.J. Park(2008) The physiological effects of Shnrin-yoku(taking in the atmosphere of the forest, or forest bathing). pp. 7-24, Proceedings 'Forest, Human Health and Happiness' The 1st International Symposium on Forest Therapy(2008).