Received: June 18, 2019 Revised: August 7, 2019 Accepted:August 9, 2019
OPEN ACCESS
HORTICULTURAL SCIENCE and TECHNOLOGY 37(5):598-608, 2019
URL: http://www.hst-j.org pISSN : 1226-8763 eISSN : 2465-8588
This is an Open Access article distributed under the terms of the Creative Commons Attribution Non-Commercial License which permits unrestricted non-commercial use, distribution, and reproduction in any medium, provided the original work is properly cited.
Copyrightⓒ2019 Korean Society for Horticultural Science.
This work was supported by the Gyeongnam National University of Science and Technology Grant in 2018.
Growth and Biochemical Responses of Ice Plant Irradiated by Various Visible Light Spectra in Plant Factories
Ji-Won Lee 1,2† , Ki-Ho Son 3† , Jin-Hui Lee 1,2 , Yun-Jung Kim 1,2 , and Myung-Min Oh 1,2*
1
Division of Animal, Horticultural and Food Sciences, Chungbuk National University, Cheongju 28644, Korea
2
Brain Korea 21 Center for Bio-Resource Development, Chungbuk National University, Cheongju 28644, Korea
3
Department of Horticultural Science, Gyeongnam National University of Science and Technology, Jinju 52725, Korea
*Corresponding author: [email protected]
†
These authors contributed equally to this work.
Abstract
The goal of this study was to determine the effects of various visible light spectra on the growth and bioactive compounds of ice plant ( Mesembryanthemum crystallinum L.) in a plant factory with artificial light. Three-week-old seedlings were transplanted into subirrigation systems in a plant factory (average of 23°C air temperature, 60% relative humidity, 170 µmol·m
-2·s
-1photosynthetic photon flux density, 12 h photoperiod, and 1,000 µmol·mol
-1CO
2) equipped with fluorescent lamps (FL, control); monochromatic red (R, 654 nm), green (G, 518 nm), and blue (B, 455 nm) light- emitting diodes (LEDs); and various combinations of R and B (R:B = 6:4, 7:3, 8:2, 9:1), or RB with G (R:G:B = 5:1:4, 6:1:3, 7:1:2, 8:1:1, 9:1:0) LEDs. Shoot fresh weight was higher in the R8B2, R7B3, and R8G1B1 treatments, but did not significantly differ from that in the control. Root fresh weight was highest in the R8G1B1 treatment among all treatments. Leaf area showed a similar trend to shoot fresh weight. The specific leaf weight increased as the ratio of B LEDs increased under the RB and RGB treatments, except in the R8G1B1 treatment. Plants in the RGB treatments with 5 - 6% G light had a higher photosynthetic rate when compared with the RB treatments. The total phenolic content based on unit grams in plants irradiated with RB and RGB LEDs did not show a significant difference except in the R9G1B0 treatment. Antioxidant capacity per unit dry weight tended to increase as the ratio of B LEDs increased in the RB treatments. Regarding total phenolic content and antioxidant capacity per plant, the highest values were recorded in treatments R8B2, R7B3, and R8G1B1, which was similar to the shoot growth results. These results indicate that LEDs with R8B2, R7B3, and R8G1B1 ratios, as well as FL, are suitable visible lighting sources for producing high-value ice plants in plant factories.
Additional key words: antioxidants, light-emitting diodes, light quality, Mesembryanthemum crystallinum L., total phenolic content
Introduction
The ice plant (Mesembryanthemum crystallinum) is a succulent plant native to the Namibian desert
in southern Africa and has been utilized as a vegetable in Europe and Asia, including Japan and
Taiwan. The plant is covered with large, glistening bladder cells, which look like ice. Thus, the plant’s common name is ice plant, or crystalline ice plant. The ice plant is known to be rich in minerals, such as potassium and sodium (Kang et al., 2016), antioxidants (Lee et al., 2015), and polyols, such as myo-inositol and pinitol, which are effective in the prevention of cardiovascular diseases, liver damage, and cancer (Do and Koo, 2007). In particular, pinitol is used as a natural blood glucose regulator for type 2 diabetes patients around the world because of its excellent blood glucose control effects (Son et al., 2009).
Unlike other plants that contain polyols, such as soybeans (Glycine max) and pine (Pinus sp.) needles, polyols contained in the ice plant are easy to uptake because the plant is consumed as a fresh material without cooking (Agarie et al., 2009).
Ice plant has a high nutrient absorption ability when compared with other vegetables such as carrots (Daucus carota subsp. sativus), radishes (Raphanus raphanistrum subsp. sativus), and tomatoes (Solanum lycopersicum) (Shevyakova et al., 2003; Yang et al., 2009). It is safer to cultivate ice plant in hydroponic systems rather than in the field because there is concern regarding the absorption of heavy metals contained in the soil during commercial field cultivation for mass production. In addition, ice plant is sensitive to environmental stresses, such as drought, low temperature, and high light intensity;
consequently, lateral shoots occur, and leaves become smaller and thicker, depreciating the commercial value of the plant.
Aerial environmental factors, such as light, temperature, CO
2, and humidity, as well as underground factors, such as chemical conditions [pH and electrical conductivity (EC)], temperature, and dissolved oxygen nutrient solution, can be artificially controlled in plant factories to promote growth and development. As a result, it is possible to produce high-quality, uniform crops throughout the year by creating a suitable environment (Kozai, 2013). However, mass production of a high-value crop is necessary to make plant factories economically viable because of the considerable expense involved in installation and operation. In this respect, cultivation methods for producing high-quality ice plants should be established for making plant factories commercially viable. Aspects of the optimal cultivation environment of ice plants in plant factories have been studied, including photoperiod (Jo et al., 2016), temperature (Cha et al., 2016a), nutrient solution, light intensity, planting density (Cha et al., 2016b), and a photosynthetic (photosynthesis and stomatal conductance) model (Park et al., 2016). However, there is a lack of research on the effect of light quality on the growth of ice plant and the production of bioactive compounds.
Therefore, the goals of this study were to determine the growth and content of bioactive compounds of ice plant grown under monochromatic light-emitting diodes (LEDs) and different combinations of red (R) and blue (B) LEDs or red + blue (RB) with green (G) LEDs, and to provide basic information on optimal light conditions for the mass production of ice plant in plant factories under artificial light.
Materials and Methods
Plant Materials and Growth Conditions
Seeds of the common ice plant provided by Jeju National University were sown and germinated in 105-cell plug trays
with horticultural growing medium (Myung-Moon; Dongbu Hannong, Seoul, Korea). Three-week-old seedlings were
transplanted into plastic pots [6.5 × 6.5 × 8 cm (L × W × H)] that were placed on a sub-irrigation tray [32 × 22 × 6.5 cm
(L × W × H)]. Twenty-five pots per LED treatment were cultivated in a plant factory with artificial light under the
following conditions: air temperature of 23°C, relative humidity of 60%, 1,000 µmol·mol
-1CO
2, a 12 h photoperiod, and
a photosynthetic photon flux density (PPFD) of 170 µmol·m
-2·s
-1. The nutrient solution (Cha et al., 2016b; EC 1.5 dS·m
-1, pH 6.0) was subirrigated to the plants, and the solution was maintained at a 1-cm depth in the sub-irrigation tray and changed once every two weeks.
Light Treatments
Monochromatic R (654 nm), G (518 nm), and B (456 nm) LEDs (Itswell, Incheon, Korea) were used alone and in four combinations of RB LEDs (R:B = 9:1, 8:2, 7:3, and 6:4, based on chip number) and five combinations of RGB LEDs (R:G:B = 9:1:0, 8:1:1, 7:1:2, 6:1:3, and 5:1:4). Fluorescent lamps (FL; HYG-FPL 36 W-R; Nam Yung, Seoul, Korea) were used as the control. The PPFD was measured at 12 points in the cultivation position for each light treatment using a quantum sensor (LI-1400; Li-Cor, Lincoln, NE, USA), and the average was set to 170 µmol·m
-2·s
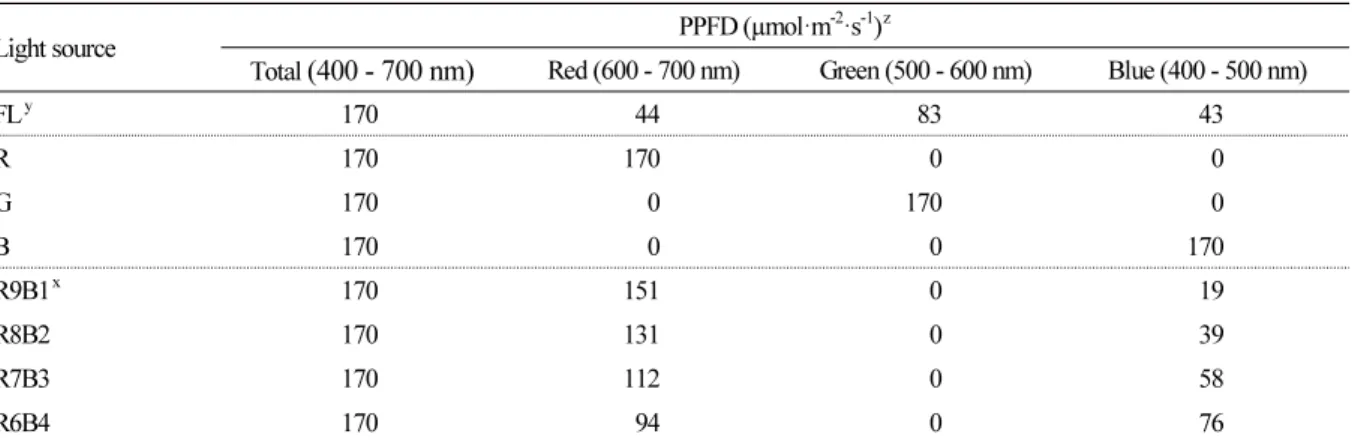
-1. The light spectrum was analyzed at 0.4 nm intervals using a spectroradiometer (Jaz-EL 200; Ocean Optics, Dunedin, FL, USA) for each light treatment (Fig. 1) , and the results were expressed as a PPFD of 400 nm to 700 nm (Table 1) . During the cultivation period, the subirrigation trays were rotated clockwise once a day for uniformity of light distribution.
Fig. 1. Relative spectral distribution of fluorescent lamps (FL), and monochromatic red (R), green (G), and blue (B) LEDs used in this study.
Table 1. Spectral data for monochromatic and various combined ratios of red (R) to blue (B), and RB with green (G) light-emitting diodes (LEDs). Data were recorded at the location of 170 µmol·m
-2·s
-1with a spectrophotometer
Light source PPFD (µmol·m
-2·s
-1)
zTotal (400 - 700 nm) Red (600 - 700 nm) Green (500 - 600 nm) Blue (400 - 500 nm)
FL
y170 44 83 43
R 170 170 0 0
G 170 0 170 0
B 170 0 0 170
R9B1
x170 151 0 19
R8B2 170 131 0 39
R7B3 170 112 0 58
R6B4 170 94 0 76
Growth Characteristics
To compare the growth characteristics of the plants in the different light treatments, fresh weights of shoots and roots, number of leaves, leaf area, specific leaf weight, and SPAD value were measured at 4 weeks of treatment. Fresh weights of shoots and roots were measured using a digital scale (Si-234; Denver Instrument, Denver, CO, USA). The number of leaves was counted, with the exception of leaves in lateral shoots, and leaf area was measured using a leaf area meter (LI-3100C; Li-Cor, Lincoln, NE, USA). Specific leaf weight, representing leaf thickness, was expressed as shoot dry weight per leaf area. The SPAD value, representing the chlorophyll content of the third pair of leaves from the bottom leaf pair, was measured using a portable chlorophyll meter (SPAD-502; Konica Minolta, Tokyo, Japan).
Photosynthetic Rate
The photosynthetic rate of the plants was measured after 4 weeks of treatment. A portable photosynthesis system (LI-6400; Li-Cor, Lincoln, NE, USA) equipped with a transparent open-type leaf chamber (LI-6400-08, 2 × 3 cm; Li-Cor, Lincoln, NE, USA) was adopted to measure the photosynthetic rate under each light treatment (average PPFD of 170 µmol·m
-2·s
-1). The photosynthetic rate was measured from 10:00, one hour after the lights were turned on, until 14:00.
The measurement conditions were similar to the growing conditions: air flow rate, CO
2concentration, and block temperature of the photosynthesis system were set at 400 µmol·s
-1, 1,000 µmol·mol
-1, and 23°C, respectively.
Total Phenolic Content
Shoot samples of ice plant were freeze-dried for 72 h in a freeze dryer (FD8512; Ilshin Lab. Co. Ltd., Dongducheon, Korea) and then finely ground into powder with a mill (Tube Mill control, IKA, Wilmington, NC, USA) for 2 min at 25,000 rpm. All the powdered samples were stored at 4°C until use.
Total phenolic content was analyzed using a slightly modified Folin-Ciocalteu method (Ainsworth and Gillespie, 2007). The powder samples (approximately 40 mg) were mixed with 4 mL of 80% (v/v) acetone and extracted for 15 min using an ultrasonic sonicator (SK5210HP; Hangzhou Nade Scientific Instrument, Zhejiang, China). After incubation in the dark at 4°C for 12 h, the samples were centrifuged at 3,000 × g for 2 min at 4°C, and the supernatants were used for Table 1. Spectral data for monochromatic and various combined ratios of red (R) to blue (B), and RB with green (G) light-emitting diodes (LEDs). Data were recorded at the location of 170 µmol·m
-2·s
-1with a spectrophotometer (continued)
Light source PPFD (µmol·m
-2·s
-1)
zTotal (400 - 700 nm) Red (600 - 700 nm) Green (500 - 600 nm) Blue (400 - 500 nm)
R9G1B0 170 158 10 2
R8G1B1 170 133 10 27
R7G1B2 170 109 10 51
R6G1B3 170 88 9 73
R5G1B4 170 70 8 92
z
PPFD of red, green, and blue.
y
Fluorescent lamp.
x
Ratios of red, green, and blue LEDs based on the number of LED chips.
analysis. The remainder of the procedure was then performed as described by Son and Oh (2013). Results were expressed as milligrams of gallic acid equivalents (Acros Organics, Geel, Belgium) (GAE) per unit dry weight (GAE mg·g
-1DW) or gallic acid equivalents per plant (GAE mg/plant).
Antioxidant Capacity
Sample preparation was the same as that for total phenolic content. Antioxidant capacity was measured using 2,2-Azino-bis (3-ethylbenzothiazoline-6-sulfonic acid) (ABTS; Sigma-Aldrich, St. Louis, MO, USA) as described in Son and Oh (2013). The extracts were stored for 12 h in the dark at -20°C and then centrifuged at 3,000 × g for 2 min at -20°C.
The extracted supernatant was diluted 10-fold with 80% acetone for analysis. ABTS was diluted with 5 mM PBS (phosphate buffer saline, pH 7.4, ionic strength [150 mM] NaCl), and the absorbance was adjusted to 0.7 ± 0.5 at 730 nm.
Results were expressed as trolox (6-Hydroxy-2, 5, 7, 8-tetramethylchromane-2-carboxyl acid) (Sigma-Aldrich, St. Louis, MO, USA) equivalent antioxidant capacity (mM) per unit dry weight (mM TEAC·g
-1DW) or per plant (mM TEAC/
plant).
Statistical Analysis
For all measurement parameters, five individual plants were considered as five biological replicates, except for photosynthesis rate, which had four replicates. The SAS program (SAS 9.4, SAS Institute, Cary, NC, USA) was used for statistical analysis. A one-way analysis of variance (ANOVA) was conducted to test for significant differences among treatments, and the means were compared using Duncan’s multiple range test at p < 0.05.
Results
Growth Characteristics and Photosynthetic Rate
Among the monochromatic LED treatments, R LEDs showed a positive effect on shoot fresh weight (Fig. 2A) . The
A B
Fig. 2. Shoot (A) and root (B) fresh weight of ice plant grown under monochromatic and various combined ratios of red (R) to blue (B) and RB with green (G) light-emitting diodes (LEDs) at 4 weeks of treatment. Data indicate the means ± SE (n
= 5). Different letters above bars indicate significant differences at p < 0.05.
R8B2 and R7B3 treatments resulted in higher fresh weights when compared with the other RB treatments, despite the lack of statistical significance. Among the RGB treatments, R8G1B1 resulted in the highest shoot weight, which was significantly higher when compared with that of the R9G1B0 and R6G1B3 treatments. The shoot weight in the control (FL) was 12 g/plant, which was not significantly different from that of the treatments except for the monochromatic B LED treatment. The root fresh weight did not significantly differ among the monochromatic LED treatments (Fig. 2B) . In the RB treatments, the root fresh weight tended to increase as the ratio of B LEDs increased, but there was no significant
Table 2. Number of leaves, leaf area, specific leaf weight, and SPAD values of ice plant subjected to monochromatic and various combined ratios of red (R) to blue (B), and RB with green (G) light-emitting diodes (LEDs) at 4 weeks of treatment (n = 5)
Light source No. of leaves Leaf area (cm
2) Specific leaf weight (mg DW·cm
-2) SPAD value
FL
z8.8 a
y110.0 ab 4.74 ab 47.1 ab
R 6.2 d 104.3 ab 3.98 d 32.8 f
G 7.2 b-d 84.9 bc 3.46 e 32.0 f
B 8.4 ab 62.0 c 4.03 d 36.7 ef
R9B1 7.2 b-d 96.0 bc 4.08 cd 38.6 de
R8B2 8.0 ab 123.2 ab 4.44 b-d 43.6 a-d
R7B3 8.0 ab 121.3 ab 4.60 ab 47.6 a
R6B4 6.4 cd 87.2 bc 4.96 a 45.5 a-c
R9G1B0 8.0 ab 108.3 ab 3.97 d 41.2 c-e
R8G1B1 7.4 bc 138.1 a 4.41 b-d 42.9 a-d
R7G1B2 8.0 ab 112.9 ab 4.07 cd 42.2 b-d
R6G1B3 7.8 ab 99.9 ab 4.24 b-d 41.0 c-e
R5G1B4 8.0 ab 105.5 ab 4.57 a-c 43.6 a-d
z
Fluorescent lamp.
y