Received: September 27, 2018 Revised: December 18, 2018 Accepted:January 5, 2019
OPEN ACCESS
HORTICULTURAL SCIENCE and TECHNOLOGY 37(2):206-218, 2019
URL: http://www.kjhst.org pISSN : 1226-8763 eISSN : 2465-8588
This is an Open Access article distributed under the terms of the Creative Commons Attribution Non-Commercial License which permits unrestricted non-commercial use, distribution, and reproduction in any medium, provided the original work is properly cited.
Copyrightⓒ2019 Korean Society for Horticultural Science.
Effect of Light Quality on Physiological Disorder, Growth, and Secondary Metabolite Content of Water Spinach (Ipomoea aquatica Forsk) Cultivated in a Closed-type Plant Production System
Mizuki Kitayama 1 , Duyen T.P. Nguyen 1 , Na Lu 2* , and Michiko Takagaki 1
1
Graduate School of Horticulture, Chiba University, 648 Matsudo, Chiba, Japan
2
Center for Environment, Health and Field Sciences, Chiba University, 6-2-1 Kashiwanoha, Chiba, Japan
*Corresponding author: [email protected]
Abstract
Light quality is a critical factor that affects plant quality, including phytochemical accumulation and marketable characteristics, in closed-type plant production systems. The purpose of this study was to determine the appropriate light quality for production of good quality water spinach in terms of its appearance and accumulation of phytochemicals in an artificial environment. Plants were hydroponically cultured under five different light quality conditions: red, blue, green, red and blue (as a control), and red and blue with far red at a photosynthetic photon flux density of 200 µmol·m
-2·s
-1for 14 days after transplantation. Shoot (stem and leaf) fresh weights (FW) under red-containing light conditions increased more than 39.7% compared to that under monochromatic blue light, and monochromatic red light produced significantly higher stem FW but lower leaf FW compared to that under blue-containing light conditions. Monochromatic blue light significantly increased the antioxidant activity capacity in leaves and stems more than 210.0% compared to other treatments.
However, blue-containing light significantly stimulated physiological disorder (intumescence injury) in stems and suppressed stem elongation compared to monochromatic red or green light. Monochromatic red light reduced the number of intumescent lesions by 95.8% and enhanced stem elongation compared to control. These findings suggest that red-rich light promotes growth of water spinach with less intumescence.
Additional key words: antioxidant activity, hydroponic, intumescence, light-emitting diodes, monochromatic light
Introduction
A closed-type plant production system, called an indoor plant production system, can efficiently
produce vegetables, medicinal plants, and young seedlings throughout the year. In addition, the yield
and nutritional quality of crops can be improved by adjusting the cultivation conditions (Liu et al.,
2018). Light is one of the most essential environmental factors that affects plant growth and
development (Zhang et al., 2015). Thus, selection of an optimal light source is an essential task in
closed-type plant production systems.
Apart from light intensity, light quality or the light spectrum is also important for plant growth and development. Red and blue wavelengths of light have the greatest impact on photosynthetic biosynthesis and photomorphogenesis because chlorophyll a and b in leaf cells effectively absorb both red and blue light for photosynthesis (Sandquist and Ehleringer, 2015); in addition, photoreceptors such as phytochromes, phytotropins, and cryptochromes absorb both red and blue light for photomorphogenesis (Taiz et al., 2015). The red and blue lights have different effects on plant growth. For instance, red light is effective in promoting plant biomass (Johkan et al., 2010), and blue light is important for chlorophyll biosynthesis (Wang et al., 2009) and stomatal opening (Savvides et al., 2012). In addition, specific wavelengths influence plant metabolic composition such as ascorbic acid and flavonoid antioxidants (Bach et al., 2018; Zhang et al., 2015).
Combined red and blue lights were shown to be more effective than monochromatic red or blue light in increasing biomass (Shin et al., 2008). However, the effect of light quality is complex; while red light enhances biomass in many plants compared to blue light, some plants show opposite results (Son et al., 2013; Zheng and Labeke, 2018). Therefore, individual evaluation of each plant species or cultivars is a key imperative.
Physiological disorder is one of the main problems that affects product quality in closed-type plant production systems.
Intumescence injury, also referred to as edema, oedema, neoplasms, enations, genetic tumors, and galls, has been observed in many plant species, such as white poplar (Populus grandidentatal) (D and Rue, 1933), tomato (Solanum lycopersicum and Lycopersicon hirsutum) (Lang and Tibbitts, 1983), sweet potato (Ipomoea batatas) (Craver et al., 2014), and potato (Solanum tuberosum) (Douglas, 1907). This nonpathogenic injury is visually characterized by abnormal blister- or callus-like tumor growth (Eguchi et al., 2016). In tomato plants cultivated in closed-type plant production systems, intumescence injury mainly develops on the surface of leaves and sometimes on the petioles and the stems (Eguchi et al., 2016).
Previous studies indicated that light quality plays a key role in intumescence. It is widely known that ultraviolet (UV) radiation, especially UV-B radiation (280 - 320 nm), inhibits the development of intumescence (Lang and Tibbitts, 1983;
Craver et al., 2014; Eguchi et al., 2016; Kubota et al., 2017). In addition to UV-B, far-red (Fr), blue (B), and green (G) light also have a preventive effect against intumescence (Wollaeger and Runkle, 2015; Eguchi et al., 2016). For example, in a study by Morrow and Tibbitts (1988), 0% and 3% of tomato leaf discs developed intumescence under B and G light treatment, respectively, while the corresponding figure was as high as 63% under red light treatment; in addition, Fr light mitigated intumescence with an increase in the irradiation level. However, the cause of intumescence and its underlying mechanisms are poorly understood.
Water spinach (Ipomoea aquatica Forsk) is an aquatic plant with worldwide distribution, including in Africa, Asia, and
the Southwest Pacific islands (Austin, 2007), where it is one of the most popular green, leafy vegetables (Prasad et al.,
2008). The plant exhibits vigorous growth; the maximum reported growth rate is approximately 10 cm per day and its
shoot may exceed 21 m in length (Mccann et al., 1996). In addition, its leaves and stems are rich sources of minerals,
proteins, vitamins, and fiber (Wills and Rangga, 1996; Umar et al., 2007). Thus, water spinach can be a suitable candidate
vegetable for indoor food production. However, some indoor cultivation companies are encountering an intumescence
problem that reduces the plant’s marketable value. The issue appears often, especially with LED systems, which is a
future trend for indoor plant production. The basic knowledge pertaining to production of water spinach in indoor plant
production systems and the effects of LED quality on physiological disorder of water spinach are largely lacking. In this
study, we aim to clarify the appropriate light quality for production of water spinach in an artificial environment.
Materials and Methods
Plant Materials and Growth Conditions
Water spinach seeds (Matol Seeds, Bangkok, Thailand) were soaked in 30°C water for 16 hours and then wrapped in wet paper at 27°C air temperature until the appearance of roots. Rooted seeds were sown in urethane sponge cubes (14.78 cm
3) in a cultivation room and kept in a dark condition for the first 24 hours. Subsequently, light was provided for 16 hours per day using cool white fluorescent lamps (FHF32 EX-W-J; Hitachi Appliances, Tokyo, Japan). Photosynthetic photon flux density (PPFD) at the surface of the cultivation panel was set at 150 µmol·m
-2·s
-1. Seedlings were cultivated hydroponically using nutrient solution (NO
3-N 12.0 me·L
-1, PO
4-P 4.0 me·L
-1, SO
4-S 2.0 me·L
-1, NH
4-N 1.3 me·L
-1, K 4.0 me·L
-1, Ca 4.3 me·L
-1, Mg 2.0 me·L
-1, Fe 2.85 mg·L
-1, B 0.32 mg·L
-1, Mn 0.02 mg·L
-1, Zn 0.04 mg·L
-1, Cu 0.02 mg·L
-1, and Mo 0.02 mg·L
-1) with an EC of 1.0 dS·m
-1and pH of 6.8 ± 0.2. Air temperature and relative humidity were 24 ± 2/20 ± 1°C (light/dark period) and 21 - 74%, respectively.
Twelve days after sowing, seedlings were planted on polystyrene raft panels (30 cm × 60 cm) and transplanted into a DFT system (120 cm × 60 cm × 3 racks) in a walk-in-type plant factory (2.9 m × 2.0 m × 3.0 m in LWH). Water depth was maintained at 3 cm and circulated by a pump (MD-30R; Iwaki Co, Tokyo, Japan). One panel contained 26 plants, each spaced 8.4 cm apart (effective planting density of 144 plants per m
2). The EC of the nutrient solution was set at 2.0 dS·m
-1and adjusted every minute by an Easy-Treatment-Fertilizer-Controller 2 (CEM Corporation Co., Tokyo, Japan). Throughout the experiment, air temperature, relative humidity, and CO
2concentration in the plant factory were maintained at 24 ± 2/19 ± 1°C (light/dark period), 42 - 81%, and 1,500 µmol·mol
-1, respectively.
Treatments
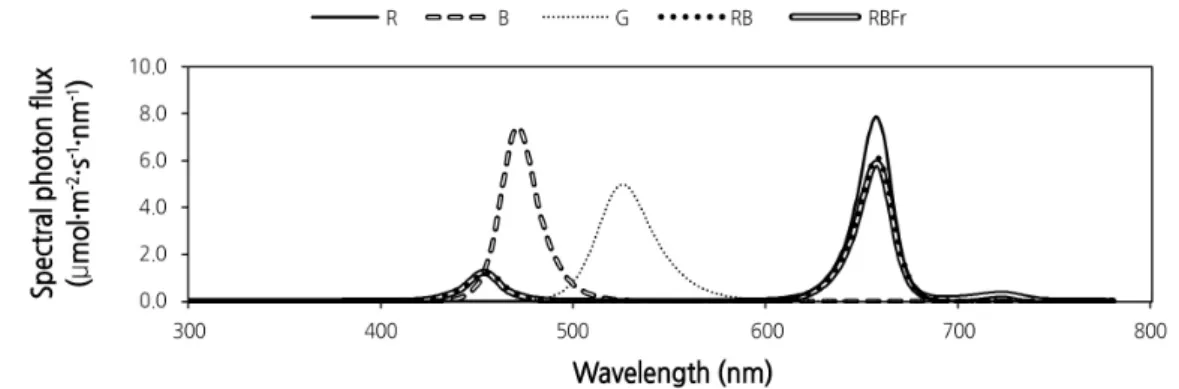
Five different spectra of LEDs were used (Fig. 1) : 1, red (R); 2, blue (B); 3, green (G) (LED Small lighting Unit for Plant Research, ISLM-150 × 150-RR· -BB· -GG; CCS Inc., Kyoto, Japan); 4, red and blue (RB) (red:blue = 87:13 photon flux density); and 5, red and blue with far red (RBFr) (red:blue:far red = 81.5:12.5:6 photon flux density) (GreenPower LED production module, DR/B· DR/B/FR; Philips Japan, Tokyo, Japan). RB was used as the control. Light intensity of all treatments was set at a PPFD of 200 ± 15 µmol·m
-2·s
-1with a photoperiod of 14 hours per day for 14 days after transplantation. The PPFD was measured in six locations of the cultivation panel surface using a quantum sensor (LI
Fig. 1. Relative spectral distributions of each LED lights. R = red; B = blue; G = green; RB = red + blue (R:B = 87:13); RBFr =
red + blue with far red (R:B:Fr = 81.5:12.5:6). Average PPFD was 200 µmol·m
-2·s
-1for all treatments.
250A, LI-190R; Li-Cor Inc., Lincoln, NE, USA). The light spectra were measured by a spectroradiometer (Lighting Passport, AsenseTek, Taiwan) over wavelengths ranging from 380 to 780 nm.
Measurement of Growth Parameters and Intumescence Number on Stems
Water spinach was harvested at 26 days after sowing. Stem and leaf fresh weights (FW) and shoot length were determined immediately after harvesting. Then, the total leaf area per plant was determined using a leaf area meter (Li-3000; Li-Cor, Inc., Lincoln, NE, USA). The leaf and stem samples were placed in an oven at 80°C for 4 days to determine dry weight (DW). The leaf and stem relative water content (WC) was calculated using the following formula:
WC = [(FW - DW)/FW] × 100. Total nitrogen (N) and total carbon (C) content in the leaf were determined using dried leaf samples and a CNS analyzer (Elementar Vario Max CNS; Elementar Japan K.K., Kanagawa, Japan). The number of intumescences on the stem was counted from the center of the first internode (1 cm
2). The anatomical analysis was performed based on the method described by Hajiboland et al. (2012), with slight modifications. The stem sample of the first internode was cut horizontally by a razor. The samples were washed with distilled water and placed in 5% sodium hypochlorite solution for 30 min for clearing and rinsed with distilled water. Following washing in 10% acetic acid for 5 min to remove sodium hypochlorite, the sections were stained with iodine green and carmine for lignin and cellulose, respectively, for 5 min and then rinsed with distilled water. Anatomical characteristics were observed under a microscope (Motic BA310; SHIMADZU RIKA Co., Tokyo, Japan).
Determination of Pigment Concentrations
The chlorophyll (Chl) a and b, total Chl, and total carotenoid concentrations were measured in the tip of fully opened leaf tissues by immersion in N,N-dimethylformamide (DMF) (Wako Pure Chemical Industries, Osaka, Japan). Two leaf discs with a total area of 1 cm
2were placed into glass vials containing 5 mL of DMF and immediately placed in the dark at 4°C for 36 hours. The absorbance of the solution was then read on a spectrophotometer at 663.8, 646.8, and 480 nm, using DMF as a blank. The pigment concentrations were calculated according to the following equations (Wellburn, 1994).
Chl
a( µ g·mL
-1) = 12A
663.8‑ 3.11A
646.8Chl
b( µ g·mL
-1) = 20.78A
646.8‑ 4.88A
663.8Total Chl ( µ g·mL
-1) = 17.67A
646.8+ 7.12A
663.8Total carotenoid ( µ g·mL
-1) = (1,000A
480.0‑ 1.12Chl
a‑ 34.07Chl
b)/245
DPPH Radical-Scavenging Activity
The scavenging activity of 1,1-diphenyl-2-picrydrazyl (DPPH) radicals was determined using spectrophotometric analysis based on a slightly modified version of the method described by Prior et al. (2005) and Gonçalves et al. (2013).
The stem and the leaves of each plant were sampled separately for measurement. One gram of frozen samples was
homogenized with 5 mL of 95% ethanol (Wako Pure Chemical Industries, Osaka, Japan) for 1 min. The extract was
centrifuged at 4°C and 10,000 × g for 30 min. The supernatant was diluted with ethanol to 6 mL and stored at - 30°C until
further analysis. Solution (0.1 mL) was added to 2 mL of 30 µM DPPH radical solutions (Sigma-Aldrich, Tokyo, Japan) in ethanol and rapidly mixed. Absorbance at 517 nm was determined after incubation in the dark at room temperature for 30 min. DPPH radical-scavenging activity was determined from the liner equation of a standard curve obtained with different concentrations of Trolox (Wako Pure Chemical Industries, Osaka, Japan), and ethanol was taken as a blank. The linear equation of a standard curve was 0.999, and the results were expressed as milligrams Trolox equivalent (TE) per gram FW (mg TE/g FW).
Measurement of Ascorbic Acid Content
Ascorbic acid content was measured as described by Tabata et al. (2001) with slight modification using a reflectometer (RQflex plus; Merck KGaA, Darmstadt, Germany) and analysis strips (Ascorbic Acid Test; Merck KGaA, Darmstadt, Germany). Twenty-six days after sowing, the stem and the leaves of each plant were separated and stored in polyethylene bags at - 30°C until further processing. One gram of frozen sample was homogenized with 4 or 2 mL of 5% metaphoric acid (w/v) (Wako Pure Chemical Industries, Osaka, Japan). Then, the filtered liquid solution was measured.
Total Phenolic Content
The total phenolic content was determined using Folin-Ciocalteu reagent (Sigma-Aldrich, Tokyo, Japan) using a slightly modified version of the method described by Prior et al. (2005) and Bantis et al. (2016). The stem extract and the leaf extract were prepared as described in the DPPH radical-scavenging activity method. The plant extract (0.25 mL) was mixed with 1.25 mL of 10% Folin-Ciocalteu reagent (v/v) and was neutralized with 1 mL of 7.5% (w/v) sodium carbonate solution (Wako Pure Chemical Industries, Osaka, Japan). The reaction mixture was incubated at room temperature for 1 hour. The absorbance of the resulting blue color was measured at 765 nm using a spectrophotometer (ASV11D; AS ONE Co., Osaka, Japan). The total phenolic content was determined from the linear equation of a standard curve prepared with different concentrations of gallic acid (correlation coefficient: R
2= 0.998) and expressed as milligrams gallic acid equivalents (GAE) per gram FW (mg GAE/g FW).
Statistical Analysis
Twenty-three plants were sampled for each treatment. Fifteen plants were used to evaluate growth parameters (stem length, stem FW, stem DW, stem WC, leaf number, leaf FW, leaf DW, leaf WC, and leaf area), of which eight plants were used for counting the number of intumescent lesions, and total C and total N content. Eight plants were used to determine chlorophyll content and secondary metabolic parameters. The data were subjected to analysis of variance, and mean values were compared between different treatment groups using Tukey’s test; p < 0.05 was considered indicative of significant between-group difference. Correlation between number of intumescent lesions and shoot length, between the number of intumescent lesions and the total N content in shoot, between secondary metabolite parameters in stem (antioxidant capacity and ascorbic acid content) and stem WC, and between secondary metabolite parameters in stem (antioxidant capacity and ascorbic acid content) and stem DW were evaluated with Pearson’s correlation coefficient.
SPSS software (IBM SPSS Statistics, Version 25.0; IBM Co., Armonk, NY, USA) was used for all statistical analyses.
Results
Growth Parameters
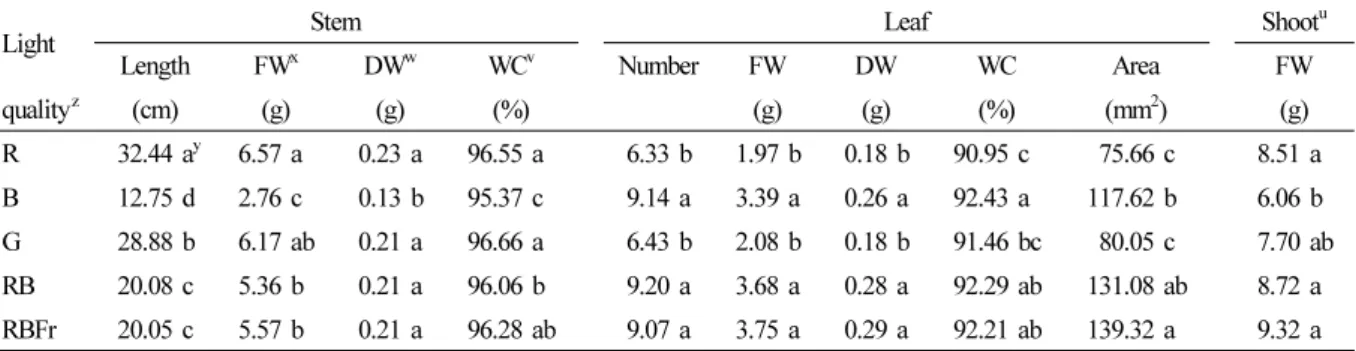
Light quality significantly affected the growth of water spinach. Data pertaining to stem length, stem FW and DW, leaf number, leaf FW and DW, leaf area, and shoot FW in different treatment groups are presented in Table 1 . Stem length increased significantly under R light treatment. Compared with RB light treatment, stem length increased by 61.55% and 43.82% under R and G light treatment, respectively. A similar trend was observed with respect to stem FW, DW, and WC.
In contrast to stem parameters, leaf number, leaf FW, leaf DW, leaf WC, and leaf area under R and G light treatment were lower than those under RB, RBFr, and B light treatment. The highest shoot FW was observed under RBFr light treatment, followed by RB, R, and G light treatment; the lowest shoot FW was observed under B light treatment. Total N and total C content (mg·g
-1DW) in the shoot under B light treatment was significantly greater than that observed under RB light treatment, while that observed under G and R light treatment was lower than that observed under RB light treatment (Fig. 2) .
Table 1. Growth parameters of water spinach grown under red (R), blue (B), green (G), red and blue (RB), and red and blue with far-red (RBFr) light at 14 days after treatment (n = 15)
Light Stem Leaf Shoot
uLength FW
xDW
wWC
vNumber FW DW WC Area FW
quality
z(cm) (g) (g) (%) (g) (g) (%) (mm
2) (g)
R 32.44 a
y6.57 a 0.23 a 96.55 a 6.33 b 1.97 b 0.18 b 90.95 c 75.66 c 8.51 a
B 12.75 d 2.76 c 0.13 b 95.37 c 9.14 a 3.39 a 0.26 a 92.43 a 117.62 b 6.06 b
G 28.88 b 6.17 ab 0.21 a 96.66 a 6.43 b 2.08 b 0.18 b 91.46 bc 80.05 c 7.70 ab
RB 20.08 c 5.36 b 0.21 a 96.06 b 9.20 a 3.68 a 0.28 a 92.29 ab 131.08 ab 8.72 a RBFr 20.05 c 5.57 b 0.21 a 96.28 ab 9.07 a 3.75 a 0.29 a 92.21 ab 139.32 a 9.32 a
z
R = red; B = blue; G = green; RB = red + blue (R:B = 87:13); RBFr = red + blue with far red (R:B:Fr = 81.5:12.5:6).
y
Different letters in each column indicate significant difference ( p < 0.05, Tukey’s test).
x
Fresh weight.
w
Dry weight.
v
Relative water content.
u
Stem + leaf.
Fig. 2. Total nitrogen (N) and total carbon (C) content in shoot (stem and leaf) of water spinach grown under red (R), blue
(B), green (G), red and blue (RB), and red and blue with far red (RBFr) light at 14 days after treatment (n = 8). Data are
presented as mean ± SE with vertical error bar. Different letters in each column indicate significant difference (p < 0.05,
Tukey’s test).
Intumescence on the Stem
We observed intumescence on the epidermis of the stem, whereas no symptoms were observed on the petioles or leaves.
The symptoms were most severe in the first internode above the cotyledons and were affected by light quality, especially B light (Fig. 3A) . Hyperplasia of epidermal cells was observed in the intumescent stems (Fig. 3B) . Compared to RB light treatment, the number of intumescent lesions increased by 50.25% and 27.66% under B and RBFr light treatment, respectively (Fig. 3C) ; in contrast, that in R and G light treatment significantly decreased by 95.80% and 72.34%, respectively. A strong negative correlation was observed between the number of intumescent lesions and the shoot length (r = - 0.88: p < 0.01) (Fig. 3D) ; however, there was no significant correlation between the number of intumescent lesions and the total N content in shoot (r = 0.67).
A
B C
D
Fig. 3. Intumescent lesions on stem of water spinach grown under red (R), blue (B), green (G), red and blue (RB), and red
and blue with far red (RBFr) light at 14 days after treatment. (A), Intumescence injury on stems under five different light
treatments. (B), An intumescence (arrow) and cellular organization after staining with toluidine blue: vascular cores (Vc),
epidermis (Ep), and pith cavity (Pc). (C), Number of intumescent lesions. Data are presented as mean ± SE with vertical
error bar (n = 8). Different letters in each column indicate significant difference (p < 0.05, Tukey’s test). (D), Correlation
between number of intumescence lesions and shoot length (n = 30, r = - 0.88: p < 0.01).
Pigment Concentration
The concentrations of Chl a, b, total Chl, Chl a to b ratio (Chl a/b), and total carotenoids are presented in Table 2 . Water spinach grown under B and G light showed lower content of Chl a, Chl b, total Chl, and total carotenoids compared to that under RB light treatment. Chl a/b was significantly higher under B light treatment and significantly lower under G light treatment compared to that under RB light treatment.
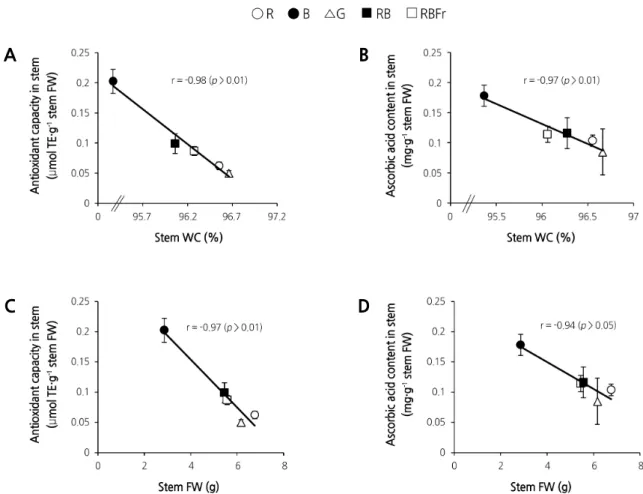
Secondary Metabolites
The antioxidant capacity, ascorbic acid content, and total phenolic content in different treatment groups are shown in Fig. 4 . Antioxidant capacity in leaf and stem showed a similar trend with the highest antioxidant capacity in both leaf and
Table 2. Chlorophyll (Chl) and total carotenoid content of water spinach grown under red (R), blue (B), green (G), red and blue (RB), and red and blue with far red (RBFr) light at 14 days after treatment (n = 8)
Light Chl a Chl b Total Chl Chl a/b Total carotenoid
quality
z(mg·cm
-2) (mg·cm
-2) (mg·cm
-2) (mg·cm
-2)
R 40.96 a
y12.98 a 53.95 a 3.15 b 8.67 a
B 37.86 b 10.70 b 48.56 b 3.54 a 7.72 b
G 32.63 c 11.18 b 43.81 c 2.92 c 7.00 c
RB 40.00 ab 12.62 a 52.62 a 3.17 b 8.51 a
RBFr 40.27 ab 12.58 a 52.84 a 3.20 b 8.68 a
z
R = red; B = blue; G = green; RB = red + blue (R:B = 87:13); RBFr = red + blue with far red (R:B:Fr = 81.5:12.5:6).
y